Persons using assistive technology might not be able to fully access information in this file. For assistance, please send e-mail to: mmwrq@cdc.gov. Type 508 Accommodation and the title of the report in the subject line of e-mail.
Current Cigarette Smoking Among Adults — United States, 2011
Tobacco use remains the single largest preventable cause of death and disease in the United States. According to the 2010 U.S. Surgeon General's report, approximately 443,000 U.S. adults die from smoking-related illnesses each year (1). In addition, smoking has been estimated to cost the United States $96 billion in direct medical expenses and $97 billion in lost productivity annually (2). To assess progress toward the Healthy People 2020 (HP2020) objective to reduce cigarette smoking by adults (objective TU-1.1),* CDC's Office on Smoking and Health used data from the 2011 National Health Interview Survey (NHIS) to estimate current national cigarette smoking prevalence. The findings indicate that 19.0% of adults smoked cigarettes in 2011 and no statistically significant change in current adult smoking prevalence occurred from 2010 (19.3%) to 2011 (19.0%). Among daily smokers, the proportion who smoked ≥30 cigarettes per day (CPD) declined significantly, from 12.6% in 2005 to 9.1% in 2011, whereas the proportion of those who smoked 1–9 CPD increased significantly, from 16.4% to 22.0%. To help reduce the national prevalence of cigarette smoking among adults to the HP2020 target of 12%, population-based prevention strategies (e.g., increasing prices of tobacco products, antitobacco media campaigns featuring graphic personal stories on the adverse health impact of smoking, smoke-free laws for workplaces and public places, and barrier-free access to help quitting) will need to be implemented more extensively. Such evidence-based tobacco control interventions can help adults quit and prevent the initiation of tobacco use (3).
The NHIS adult core questionnaire is administered by in-person interviews to a nationally representative sample of the noninstitutionalized, U.S. civilian population aged ≥18 years. The 2011 NHIS adult core sample included 33,014 respondents, and the overall response rate was 66.3% (4). Current smokers were those who had smoked at least 100 cigarettes during their lifetimes and, at the time of interview, reported smoking every day or some days. Former smokers were those who reported smoking at least 100 cigarettes during their lifetimes but currently did not smoke. A quit attempt was defined as a report by a current smoker that they had stopped smoking for >1 day during the preceding year because they were trying to quit smoking, or a report by a former smoker that they had quit during the preceding year.† Overall and sex-specific estimates of current smoking were calculated by age, race/ethnicity, education level, poverty status,§ U.S. Census region,¶ and disability status.** The mean number of CPD was calculated for daily current smokers.
Data were adjusted for nonresponse and weighted to provide national estimates of smoking prevalence. A chi-square test was used to assess the statistical significance of changes in prevalence from 2010 to 2011 (p<0.05). Logistic regression was used to analyze overall temporal changes in prevalence and CPD during 2005–2011, controlling for sex, age, and race/ethnicity. The Wald test was used to determine statistical significance (p<0.05) of trends.
In 2011, an estimated 19.0% (43.8 million) of U.S. adults were current cigarette smokers. Of these, 77.8% (34.1 million) smoked every day, and 22.2% (9.7 million) smoked some days. Overall, among current smokers and those who had quit during the preceding year, 51.8% had made a quit attempt for >1 day during the preceding year.
Overall smoking prevalence did not change significantly from 2010 to 2011 (Table). Smoking prevalence in 2011 was 21.6% among males and 16.5% among females. By race/ethnicity, prevalence was lowest among non-Hispanic Asians (9.9%) and highest among non-Hispanic American Indians/Alaska Natives (31.5%). Prevalence was lowest among adults aged ≥65 years (7.9%) and highest among those aged 25–44 years (22.1%). Prevalence was higher among adults living below the federal poverty level (29.0%) compared with those living at or above this level (17.9%). Also, prevalence was higher among those reporting having a disability (25.4%) compared with those who reported no disability (17.3%).
During 2005–2011, a slight overall decline in current smoking prevalence was noted; the largest decline in current smoking prevalence occurred in adults aged 18–24 years (from 24.4% to 18.9%; p<0.05 for trend) (Figure 1). Among daily smokers, a significant decline in mean CPD was observed from 2005 (16.7) to 2011 (15.1) (p<0.05 for trend). The proportion of daily smokers who smoked ≥30 CPD declined significantly from 2005 (12.6%) to 2011 (9.1%). Meanwhile, a significant increase was observed in the proportion of daily smokers who smoked 1–9 CPD (from 16.4% to 22.0%; p<0.05 for trend) (Figure 2).
Reported by
Israel Agaku, DMD, Brian King, PhD, Shanta R. Dube, PhD, Office on Smoking and Health, National Center for Chronic Disease Prevention and Health Promotion, CDC. Corresponding contributor: Israel Agaku, iagaku@cdc.gov, 770-488-5138.
Editorial Note
Current smoking prevalence declined most markedly from 2005 to 2011 among adults aged 18–24 years (from 24.4% to 18.9%), and this age group, which had the highest prevalence in 2005, now has the lowest of any group aged <65 years. Although overall smoking prevalence declined slightly since 2005, it was 19.0% in 2011, higher than the HP2020 target of 12% for all U.S. adults. This underscores the need for more extensive implementation of evidence-based interventions, such as those outlined in the World Health Organization's MPOWER package.†† These include increasing the price of tobacco products, implementing smoke-free laws in workplaces and public places, warning about the dangers of tobacco use with antitobacco media campaigns, increasing access to help quitting, and enforcing restrictions on tobacco advertising, promotion, and sponsorship (3). Such population-based interventions have been shown to reduce population smoking prevalence as well as overall smoking intensity (i.e., CPD) (5).
Disparities in current smoking prevalence presented in this report are consistent with those in previous reports (6–8). The disparities in smoking prevalence by education level might result from differences in understanding of the health hazards of smoking and increased vulnerability to tobacco marketing (8).
In recent years, several advances in tobacco control have occurred in the United States. These include implementation of the 2009 Family Smoking Prevention and Tobacco Control Act, which granted the Food and Drug Administration the authority to regulate the manufacture, distribution, and marketing of tobacco products.§§ Although not affecting these 2011 findings, the federal mass media campaign conducted in early 2012, which included graphic personal stories on the adverse health impact of smoking, might contribute to future decreases in prevalence (9).
The findings in this report are subject to at least five limitations. First, the estimates of cigarette smoking were self-reported and were not validated by biochemical tests. However, research has indicated that self-reported smoking status correlates highly with measured serum cotinine levels (10). Second, questionnaires were administered only in English and Spanish, which might have resulted in nonresponse among persons who speak neither of those languages. Third, because NHIS does not include institutionalized populations and persons in the military, these results might not be generalizable to these groups. Fourth, the NHIS response rate of 66.3% might have resulted in nonresponse bias, even after adjustment for nonresponse. Finally, small samples sizes resulted in imprecise annual estimates for certain population groups (e.g., American Indians/Alaska Natives).
Although comprehensive tobacco control programs¶¶ have been effective in decreasing tobacco use in the United States, they remain underfunded. In fiscal year 2011, CDC recommended appropriate annual funding levels for each state comprehensive tobacco control program. However, only two states funded tobacco control programs at CDC-recommended levels, whereas 27 states funded at <25% of these levels (CDC, unpublished data, 2012). Despite increases in excise tax revenue, state funding for tobacco control programs has actually decreased during the past 5 years. Full implementation of comprehensive tobacco control programs at CDC-recommended funding levels might result in a substantial reduction in tobacco-related disease and death and billions of dollars in savings from averted medical costs and lost productivity (3).
Acknowledgments
National Center for Health Statistics; Public Health Surveillance Program Office, Office of Surveillance, Epidemiology, and Laboratory Services; Kat Asman, Office on Smoking and Health, National Center for Chronic Disease Prevention and Health Promotion, CDC.
References
- US Department of Health and Human Services. How tobacco smoke causes disease: the biology and behavioral basis for smoking-attributable disease: a report of the Surgeon General. Atlanta, GA: US Department of Health and Human Services, CDC; 2010. Available at http://www.cdc.gov/tobacco/data_statistics/sgr/2010/index.htm. Accessed November 1, 2012.
- CDC. Smoking-attributable mortality, years of potential life lost, and productivity losses—United States, 2000–2004. MMWR 2008;57:1226–8.
- CDC. Best practices for comprehensive tobacco control programs—2007. Atlanta, GA: US Department of Health and Human Services, CDC; 2007. Available at http://www.cdc.gov/tobacco/stateandcommunity/best_practices/index.htm. Accessed August 28, 2012.
- CDC. 2011 National Health Interview Survey (NHIS) public use data release. Hyattsville, MD: US Department of Health and Human Services, CDC, National Center for Health Statistics; 2011. Available at ftp://ftp.cdc.gov/pub/health_statistics/nchs/dataset_documentation/nhis/2011/srvydesc.pdf. Accessed November 1, 2012.
- Pierce JP, Messer K, White MM, Cowling DW, Thomas DP. Prevalence of heavy smoking in California and the United States, 1965–2007. JAMA 2011;305:1106–12.
- CDC. Vital signs: current cigarette smoking among adults aged ≥18 years—United States, 2009. MMWR 2010;59:1135–40.
- CDC. Vital signs: current cigarette smoking among adults aged ≥18 years—United States, 2005–2010. MMWR 2011;60:1207–12.
- CDC. Cigarette smoking among adults and trends in smoking cessation—United States, 2008. MMWR 2009;58:1227–32.
- Rigotti N, Wakefield M. Real people, real stories: a new mass media campaign that could help smokers quit. Ann Intern Med [Epub ahead of print]; September 25, 2012.
- Caraballo RS, Giovino GA, Pechacek TF, Mowery PD. Factors associated with discrepancies between self-reports on cigarette smoking and measured serum cotinine levels among person aged 17 years or older: Third National Health and Nutrition Examination Survey, 1988–1994. Am J Epidemiol 2001;153:807–14.
* Additional information available at http://healthypeople.gov/2020/topicsobjectives2020.
† Additional information available at http://www.healthindicators.gov/Indicators/Smoking-cessation-attempts-by-adult-smokers-percent_1513/Profile.
§ Based on reported family income and 2010 poverty thresholds published by the U.S. Census Bureau.
¶ Northeast: Connecticut, Maine, Massachusetts, New Hampshire, New Jersey, New York, Pennsylvania, Rhode Island, and Vermont; Midwest: Illinois, Indiana, Iowa, Kansas, Michigan, Minnesota, Missouri, Nebraska, North Dakota, Ohio, South Dakota, and Wisconsin; South: Alabama, Arkansas, Delaware, District of Columbia, Florida, Georgia, Kentucky, Louisiana, Maryland, Mississippi, North Carolina, Oklahoma, South Carolina, Tennessee, Texas, Virginia, and West Virginia; West: Alaska, Arizona, California, Colorado, Hawaii, Idaho, Montana, Nevada, New Mexico, Oregon, Utah, Washington, and Wyoming.
** Functional disability defined based on self-reported presence of selected impairments, including vision, hearing, cognition, and movement. Limitations in performing activities of daily living (ADLs) defined based on response to the question, "Because of a physical, mental, or emotional problem, does [person] need the help of other persons with personal care needs, such as eating, bathing, dressing, or getting around inside this home?" Limitations in performing instrumental activities of daily living (IADLs) defined based on response to the question, "Because of a physical, mental, or emotional problem, does [person] need the help of other persons in handling routine needs, such as everyday household chores, doing necessary business, shopping, or getting around for other purposes?" Any disability/limitation defined as a "yes" response to at least one of the above (i.e., vision, hearing, cognition, movement, ADL, or IADL).
†† Additional information available at http://www.who.int/tobacco/mpower/mpower_report_full_2008.pdf.
§§ Additional information available at http://www.fda.gov/tobaccoproducts/guidancecomplianceregulatoryinformation/ucm246129.htm.
¶¶ Additional information available at http://www.cdc.gov/tobacco/stateandcommunity/best_practices/index.htm.
What is already known on this topic?
Approximately one in five U.S. adults smoke cigarettes, and certain subpopulations have a higher prevalence of smoking. Smoking has been estimated to cost the United States $96 billion in direct medical expenses and $97 billion in lost productivity annually.
What is added by this report?
Although smoking prevalence declined slightly since 2005, it was 19.0% in 2011, higher than the Healthy People 2020 target of 12% for all U.S. adults. Smoking prevalence is particularly high among U.S. adults living below the federal poverty level, those with less education, and those reporting having a disability or activity limitation.
What are the implications for public health practice?
To meet the Healthy People 2020 target for smoking among adults, effective interventions need to be continued or augmented, such as a combination of smoke-free laws, tobacco price increases, access to tobacco cessation treatments and services, and antitobacco media campaigns featuring graphic personal stories on the adverse health impact of smoking.
FIGURE 1. Percentage of adults aged ≥18 years who were current smokers,* by age group — National Health Interview Survey, United States, 2005–2011
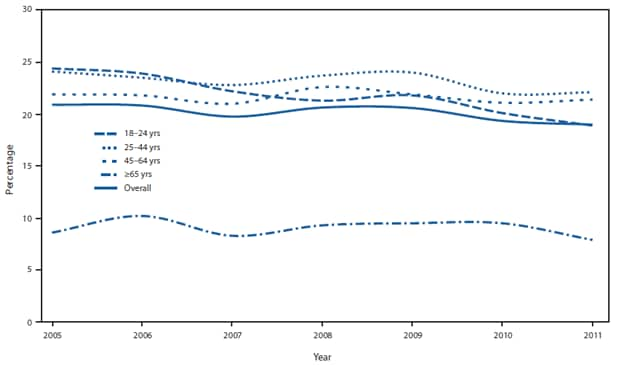
* Persons who reported smoking at least 100 cigarettes during their lifetime and who, at the time of interview, reported smoking every day or some days.
Alternate Text: The figure above shows the percentage of adults aged ≥18 years who were current smokers, by age group, in United States during 2005-2011. A slight overall decline in current smok¬ing prevalence was noted; the largest decline in current smoking prevalence occurred in adults aged 18-24 years (from 24.4% to 18.9%; p<0.05 for trend).
FIGURE 2. Percentage of daily smokers* aged ≥18 years, by number of cigarettes smoked per day (CPD) — National Health Interview Survey, United States, 2005–2011
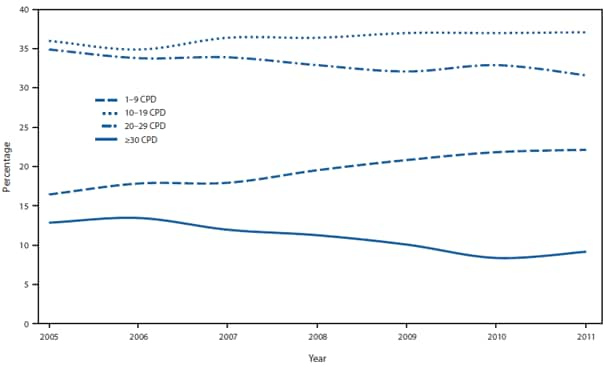
* Persons who reported smoking at least 100 cigarettes during their lifetime and who, at the time of the survey, reported smoking cigarettes every day.
Alternate Text: The figure above shows the percentage of daily smokers aged ≥18 years, by number of cigarettes smoked per day (CPD), in the United States during 2005-2011. Among daily smokers, a significant decline in mean CPD was observed from 2005 (16.7) to 2011 (15.1) (p<0.05 for trend). The proportion of daily smokers who smoked ≥30 CPD declined significantly from 2005 (12.6%) to 2011 (9.1%). Meanwhile, a significant increase was observed in the proportion of daily smokers who smoked 1-9 CPD (from 16.4% to 22.0%; p<0.05 for trend).
Use of trade names and commercial sources is for identification only and does not imply endorsement by the U.S. Department of
Health and Human Services.
References to non-CDC sites on the Internet are
provided as a service to MMWR readers and do not constitute or imply
endorsement of these organizations or their programs by CDC or the U.S.
Department of Health and Human Services. CDC is not responsible for the content
of pages found at these sites. URL addresses listed in MMWR were current as of
the date of publication.
All MMWR HTML versions of articles are electronic conversions from typeset documents.
This conversion might result in character translation or format errors in the HTML version.
Users are referred to the electronic PDF version (http://www.cdc.gov/mmwr)
and/or the original MMWR paper copy for printable versions of official text, figures, and tables.
An original paper copy of this issue can be obtained from the Superintendent of Documents, U.S.
Government Printing Office (GPO), Washington, DC 20402-9371;
telephone: (202) 512-1800. Contact GPO for current prices.
**Questions or messages regarding errors in formatting should be addressed to
mmwrq@cdc.gov.
