
Persons using assistive technology might not be able to fully access information in this file. For assistance, please send e-mail to: mmwrq@cdc.gov. Type 508 Accommodation and the title of the report in the subject line of e-mail.
Cigarette Smoking Among Adults and Trends in Smoking Cessation --- United States, 2008
Cigarette smoking continues to be the leading cause of preventable morbidity and mortality in the United States (1). Full implementation of population-based strategies (2) and clinical interventions can educate adult smokers about the dangers of tobacco use and assist them in quitting (3,4). To assess progress toward the Healthy People 2010 objective of reducing the prevalence of cigarette smoking among adults to <12% (objective 27-1a) (5), CDC analyzed data from the 2008 National Health Interview Survey (NHIS). This report summarizes the results of that analysis, which indicated that during 1998--2008, the proportion of U.S. adults who were current cigarette smokers declined 3.5% (from 24.1% to 20.6%). However, the proportion did not change significantly from 2007 (19.8%) to 2008 (20.6%). In 2008, adults aged ≥25 years with low educational attainment had the highest prevalence of smoking (41.3% among persons with a General Educational Development certificate [GED] and 27.5% among persons with less than a high school diploma, compared with 5.7% among those with a graduate degree). Adults with education levels at or below the equivalent of a high school diploma, who comprise approximately half of current smokers, had the lowest quit ratios (2008 range: 39.9% to 48.8%). Evidence-based programs known to be effective at reducing smoking should be intensified among groups with lower education, and health-care providers should take education level into account when communicating about smoking hazards and cessation to these patients.
The 2008 NHIS adult core questionnaire was administered by in-person interview and included 21,781 persons aged >18 years from among the noninstitutionalized, U.S. civilian population. Respondents were selected by a random probability sample, and the survey included questions on cigarette smoking and cessation attempts. The overall response rate for the 2008 adult core questionnaire was 62.6%. To determine smoking status, respondents were asked, "Have you smoked at least 100 cigarettes in your entire life?" Those who answered "yes" were asked, "Do you now smoke cigarettes every day, some days, or not at all?" Ever smokers were defined as those who reported having smoked at least 100 cigarettes during their lifetime. Current smokers were those who had smoked at least 100 cigarettes during their lifetime and, at the time of interview, reported smoking every day or some days. Former smokers were those who reported smoking at least 100 cigarettes during their lifetime but currently did not smoke. Never smokers were those who reported never having smoked 100 cigarettes during their lifetime. Starting in 2007, income-related follow-up questions were added to NHIS to reduce the number of responses with unknown values.* For this report, poverty status was defined by using 2006 poverty thresholds published by the U.S. Census Bureau for the 2007 estimates and 2007 poverty thresholds published by the U.S. Census Bureau for the 2008 estimates; family income was reported by the family respondent who might or might not have been the same as the sample adult respondent from whom smoking information was collected.
To measure trends in cigarette smoking cessation in the population, quit ratios were calculated as the ratio of former smokers to ever smokers for each survey year from 1998 to 2008. Quit ratios were analyzed by education level to determine if differing quit ratios accounted for part of the differing prevalence among education groups. Data were adjusted for nonresponse and weighted to provide national estimates of cigarette smoking prevalence; 95% confidence intervals were calculated using statistical analysis software to account for the survey's multistage probability sample design. For year-to-year prevalence comparisons, statistical significance (p<0.05) was determined by using a two-sided t-test. Logistic regression analysis was used to analyze temporal changes in quit ratios during 1998--2008, controlling for sex, age, and race/ethnicity.
Overall smoking prevalence did not change significantly from 2007 to 2008 (Table). In 2008, an estimated 20.6% (46.0 million) of U.S. adults were current cigarette smokers; of these, 79.8% (36.7 million) smoked every day, and 20.2% (9.3 million) smoked some days. Among current cigarette smokers, an estimated 45.3% (20.8 million) had stopped smoking for 1 day or more during the preceding 12 months because they were trying to quit. Of the estimated 94 million persons who had smoked at least 100 cigarettes during their lifetime (ever smokers), 51.1% (48.1 million) were no longer smoking at the time of interview (former smoker).
In 2008, smoking prevalence was higher among men (23.1%) than women (18.3%) (Table). Among racial/ethnic groups, Asians had the lowest prevalence (9.9%), and Hispanics had a lower prevalence of smoking (15.8%) than non-Hispanic blacks (21.3%) and non-Hispanic whites (22.0%). American Indians/Alaska Natives had higher prevalence of current smoking compared with the other racial/ethnic groups (32.4%).
Variations in smoking prevalence in 2008 also were observed by education level (Table). Smoking prevalence was highest among adults who had earned a General Education Development certificate (GED). Smoking prevalence was lowest among adults with a graduate degree (5.7%). The prevalence of current smoking was higher among adults living below the federal poverty level (31.5%) than among those at or above this level (19.6%). Smoking prevalence did not vary significantly for adults aged 18--24 years (21.4%), 25--44 years (23.7%), and 45--64 years (22.6%); however, smoking prevalence was lower for adults aged >65 years (9.3%) (Table, Figure 1).
During 1998--2008, the proportion of U.S. adults who were current cigarette smokers declined 3.5% (from 24.1% to 20.6% [p<0.05]), and a statistically significant downward trend was observed (p<0.05). In 2008, quit ratios were lower for adults aged >25 years with a GED (39.9%), adults with no high school diploma (45.7%), and adults with a high school diploma (48.8%), compared with quit ratios observed overall for adults aged >25 years (53.8%) (Figure 2). During 1998--2008, the overall quit ratio was stable (or varied little) and ranged from 48.7% (1998) to 51.1% (2008). Persons with an undergraduate degree and persons with a graduate degree had quit ratios consistently higher than 60.0%. The only group with a significant upward linear trend in cessation was persons with a graduate degree; in 2008, the quit ratio was 80.7%, compared with 76.0% in 1998. Adults with a GED had the lowest quit ratio; during 1998--2008, their quit ratios ranged from 31.2% (2001) to 39.9% (2008).
Reported by: SR Dube, PhD, K Asman, MSPH, A Malarcher, PhD, R Carabollo, PhD, Office on Smoking and Health, National Center for Chronic Disease Prevention and Health Promotion, CDC.
Editorial Note:
The prevalence of current cigarette smoking among adults has declined (from 24.1% in 1998 [6] to 20.6% in 2008) since the 1998 Master Settlement Agreement (MSA),† which stipulated that seven tobacco companies would change their marketing of tobacco products and pay an estimated $206 billion to states as compensation for tobacco-related health-care costs. Significant year-to-year decreases in smoking prevalence have been observed only sporadically. For example, a decrease occurred from 2006 to 2007 (3) but not from 2007 to 2008; during the past 5 years, rates have shown virtually no change. Some population subgroups (e.g., Hispanic and Asian women, persons with higher levels of education, and older adults) continue to meet the Healthy People 2010 target of <12% prevalence of smoking.
The causes of differences in smoking prevalence among population subgroups are complex and multifactorial. Cultural factors might explain lower prevalence among certain population groups (e.g., social disapproval among Asian women) (7). Prevalence variations by education level are likely related to differences in understanding of the health hazards of smoking and differences in receptivity to smoking-related health messages (3). Moreover, persons with higher levels of education might have a better understanding of the health hazards of smoking and might be more receptive to health messaging about the dangers of smoking (3). However, the majority of subgroups, including those with low education levels, likely will not meet the Healthy People 2010 target.
In 1998, the percentage of current smokers in the United States (24.1%) was greater than that of former smokers (22.9%). Since 2002, former smokers have outnumbered current smokers. However, increases in the proportion of former smokers have not been consistent among education groups.
The findings in this report are subject to at least five limitations. First, the estimates of cigarette smoking were self-reported and were not validated by biochemical tests. However, studies have indicated that self-reported smoking status is validated by measured serum cotinine levels, which yield similar prevalence estimates (8). Second, the NHIS questionnaire is administered only in English and Spanish; therefore, estimates for certain racial/ethnic populations might be underestimated if English and Spanish are not the primary languages spoken. Moreover, race/ethnicity was not adjusted for by socioeconomic status. Third, because NHIS does not include institutionalized populations and persons in the military, these results might not be generalizable to these groups. Fourth, information on former smokers is limited because no information is available regarding when persons actually quit smoking. Finally, because of small samples sizes for certain population groups (e.g., American Indians/Alaska Natives), single-year estimates might have resulted in imprecise estimates.
The 2008 NHIS mean prevalence of 20.6% for current smoking among adults aged ≥18 years differs from the median of 18.4% calculated for the prevalence of current smoking for the 50 states and the District of Columbia (9) by the Behavioral Risk Factor Surveillance System (BRFSS). The national mean from BRFSS was not reported because the focus of BRFSS is on state-level estimates. In contrast, NHIS mean prevalence serves as the national measure for tracking progress toward Healthy People 2010 objectives (5). For BRFSS analyses, each state draws its own independent sample to produce a state-level estimate. A number of differences between the two surveys exist, including survey type (telephone versus household), variations in response rates, and sampling and weighting procedures.
Although comprehensive tobacco control programs have been effective in decreasing tobacco use in the United States, they remain underfunded.§ During 2000--2009, total tobacco-generated funds that states have received included $203.5 billion in tobacco revenue ($79.2 billion from MSA and $124.3 billion from tobacco taxes). However, currently less than 3.0% of these funds are dedicated to tobacco prevention and cessation programs in the states. Only 15% of the $24.6 billion in MSA funds and excise tax revenue that states receive annually would be needed to fully fund state tobacco control programs at CDC-recommended levels (i.e., at a per capita annual expenditure of $9.23 to $18.03) (2). In fiscal year 2009, no state was funding these programs at CDC-recommended levels. Funding at CDC-recommended levels is needed to continue and improve state comprehensive tobacco control programs, especially when reaching populations that have disproportionately high rates of smoking.
Effective population-based strategies for preventing tobacco use and encouraging tobacco use cessation (including enforcing bans on advertisement) are outlined in the World Health Organization's MPOWER package.¶ Despite partial bans on some forms of advertisement, the tobacco industry continues to conduct targeted marketing toward socially disadvantaged subgroups and vulnerable populations, such as persons with low socioeconomic status and youths (10).
Offering and providing effective cessation counseling and treatments are integral to reducing the smoking epidemic, especially in subpopulations with high rates of smoking. Because persons with lower educational attainment generally have higher rates of smoking, are less likely to quit, and have less knowledge about the health effects of smoking but are interested in quitting, health-care providers should take education level into account when communicating with such patients (3,4).
References
- US Department of Health and Human Services. The health consequences of smoking: a report of the Surgeon General. Atlanta, GA: US Department of Health and Human Services, CDC; 2004. Available at http://www.cdc.gov/tobacco/data_statistics/sgr/sgr_2004/index.htm. Accessed November 5, 2009.
- CDC. Best practices for comprehensive tobacco control programs---2007. Atlanta, GA: US Department of Health and Human Services, CDC; 2007. Available at http://www.cdc.gov/tobacco/tobacco_control_programs/stateandcommunity/best_practices/index.htm. Accessed November 5, 2009.
- Siahpush M, McNeill A, Hammond D, Fong GT. Socioeconomic and country variations in knowledge of health risks of tobacco smoking and toxic constituents of smoke: results from the 2002 International Tobacco Control (ITC) Four Country Survey. Tobacco Control 2006;15(Suppl III):III65--70.
- Fiore MC, Jaen CR, Baker TB, et al. Treating tobacco use and dependence: 2008 update. Clinical practice guideline. Rockville, MD: US Department of Health and Human Services, Public Health Service; 2008. Available at http://www.surgeongeneral.gov/tobacco/index.html. Accessed November 5, 2009.
- US Department of Health and Human Services. Objective 27-1a: reduce tobacco use in adults (cigarette smoking). In: Healthy People 2010 (conference ed, in 2 vols). Washington, DC: US Department of Health and Human Services; 2000. Available at http://www.healthypeople.gov/document/html/objectives/27-01.htm. Accessed November 5, 2009.
- CDC. Cigarette smoking among adults---United States, 2006. MMWR 2007;56:1157--61.
- Morrow M, Ngoc DH, Hoang TT, Trinh TH. Smoking and young women in Vietnam: the influence of normative gender roles. Soc Sci Med 2002;55:681--90.
- Caraballo RS, Giovino GA, Pechacek TF, Mowery PD. Factors associated with discrepancies between self-reports on cigarette smoking and measured serum cotinine levels among person aged 17 years or older: third National Health and Nutrition Examination Survey, 1988--1994. Am J Epidemiol 2001;153:807--14.
- CDC. State-Specific secondhand smoke exposure and current cigarette smoking among adults---United States, 2008. MMWR 2009;58:1232--5.
- John R, Cheney MK, Azad MR. Point-of-sale marketing of tobacco products: taking advantage of the socially disadvantaged? J Health Care Poor Underserved 2009;20:489--506.
* Additional information available at http://www.cdc.gov/nchs/nhis/quest_data_related_1997_forward.htm.
† Additional information available at http://www.naag.org/backpages/naag/tobacco/msa/msa-pdf.
§ Additional information available at http://tobaccofreekids.org/reports/settlements/2009/fullreport.pdf.
¶ Available at http://www.who.int/tobacco/mpower/mpower_report_full_2008.pdf.
|
What is already known on this topic? Approximately one in five U.S. adults smoke cigarettes, and certain subpopulations have disproportionately higher prevalences of smoking. What is added by this report? Although the percentage of adults who are current smokers trended downward during 1998--2008, the proportion did not change from 2007 to 2008; smoking cessation over a 10-year period for adults with low educational attainment did not change and has remained lowest among all education subgroups. What are the implications for public health practice? Because persons with lower educational attainment generally have higher rates of smoking and are less likely to quit, evidence-based programs known to reduce smoking should be intensified among these groups. Health-care providers should take education level into account when communicating about cessation and smoking hazards to these patients. |
FIGURE 1. Percentage of adults aged ≥18 years who were current smokers,* by age group --- National Health Interview Survey, United States, 1998--2008
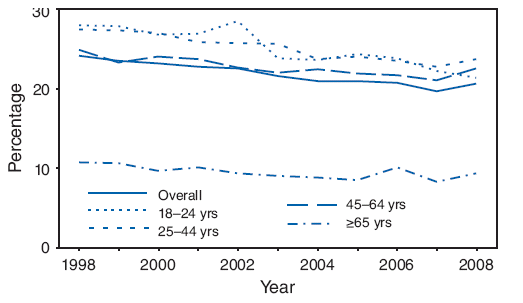
* Persons who reported smoking at least 100 cigarettes during their lifetimes and who, at the time of interview, reported smoking every day or some days. Excludes 256 respondents whose smoking status was unknown.
Alternate Text: The figure above shows the percentage of adults aged ≥18 years who were current smokers, by age group, in the United States from 1998 through 2008. Smoking prevalence was lowest among adults with a graduate degree (5.7%). Smoking prevalence did not vary significantly for adults aged 18-24 years (21.4%), 25-44 years (23.7%), and 45-64 years (22.6%); however, smoking prevalence was lower for adults aged ≥65 years (9.3%).
FIGURE 2. Quit ratios* among former smokers† aged ≥25 years, by education --- National Health Interview Survey, United States, 1998--2008
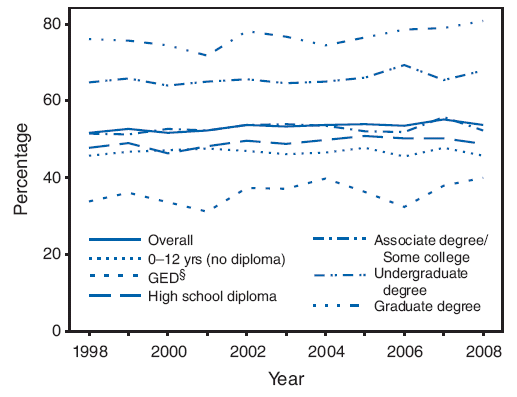
* Quit ratios were calculated as the ratio of former smokers to ever smokers for each survey year from 1998 to 2008.
† Persons who reported smoking at least 100 cigarettes during their lifetime but currently did not smoke.
§ General Educational Development certificate.
Alternate Text:The figure above shows quit ratios among former smokers aged ≥25 years, by education in the United States from 1998 through 2008. In 2008, quit ratios were lower for adults aged ≥25 years with a General Education Development certificate (GED) (39.9%), adults with no high school diploma (45.7%), and adults with a high school diploma (48.8%), compared with quit ratios observed overall for adults aged ≥5 years (53.8%). During 1998-2008, the overall quit ratio was stable (or varied little) and ranged from 48.7% (1998) to 51.1% (2008). Persons with an undergraduate degree and persons with a graduate degree had quit ratios consistently higher than 60.0%. The only group with a significant upward linear trend in cessation was persons with a graduate degree; in 2008, the quit ratio was 80.7%, compared with 76.0% in 1998. Adults with a GED had the lowest quit ratio; during 1998-2008, their quit ratios ranged from 31.2% (2001) to 39.9% (2008).
Use of trade names and commercial sources is for identification only and does not imply endorsement by the U.S. Department of
Health and Human Services. |
All MMWR HTML versions of articles are electronic conversions from typeset documents. This conversion might result in character translation or format errors in the HTML version. Users are referred to the electronic PDF version (http://www.cdc.gov/mmwr) and/or the original MMWR paper copy for printable versions of official text, figures, and tables. An original paper copy of this issue can be obtained from the Superintendent of Documents, U.S. Government Printing Office (GPO), Washington, DC 20402-9371; telephone: (202) 512-1800. Contact GPO for current prices.
**Questions or messages regarding errors in formatting should be addressed to mmwrq@cdc.gov.Date last reviewed: 11/12/2009