Persons using assistive technology might not be able to fully access information in this file. For assistance, please send e-mail to: mmwrq@cdc.gov. Type 508 Accommodation and the title of the report in the subject line of e-mail.
Current Tobacco Use Among Middle and High School Students — United States, 2011
Tobacco use continues to be the leading preventable cause of death and disease in the United States, with nearly 443,000 deaths occurring annually because of cigarette smoking and exposure to secondhand smoke (1). Moreover, nearly 90% of adult smokers begin smoking by age 18 years (2). To assess current tobacco use among youths, CDC analyzed data from the 2011 National Youth Tobacco Survey (NYTS). This report describes the results of that analysis, which indicated that, in 2011, the prevalence of current tobacco use among middle school and high school students was 7.1% and 23.2%, respectively, and the prevalence of current cigarette use was 4.3%, and 15.8%, respectively. During 2000–2011, among middle school students, a linear downward trend was observed in the prevalence of current tobacco use (14.9% to 7.1%), current combustible tobacco use (14.0% to 6.3%), and current cigarette use (10.7% to 4.3%). For high school students, a linear downward trend also was observed in these measures (current tobacco use [34.4% to 23.2%], current combustible tobacco use [33.1% to 21.0%], and current cigarette use [27.9% to 15.8%]). Interventions that are proven to prevent and reduce tobacco use among youths include media campaigns, limiting advertisements and other promotions, increasing the price of tobacco products, and reducing the availability of tobacco products for purchase by youths. These interventions should continue to be implemented as part of national comprehensive tobacco control programs and should be coordinated with Food and Drug Administration (FDA) regulations restricting the sale, distribution, and marketing of cigarettes and smokeless tobacco products to youths (2–4).
NYTS is a school-based, self-administered, pencil-and-paper questionnaire given to middle school (grades 6–8) and high school (grades 9–12) students to collect information on key tobacco control outcome indicators used to monitor the impact of comprehensive tobacco control policies and programs (e.g., prevalence of tobacco use and smoking cessation, tobacco-related knowledge and attitudes, access to tobacco, exposure to tobacco advertising and promotions, and secondhand smoke exposure).* The survey has been conducted approximately every 2 years since 2000. The 2011 NYTS used a three-stage cluster sampling procedure to generate a cross-sectional, nationally representative sample of students in grades 6–12 from all 50 states and the District of Columbia.
Out of the 214 schools selected, 178 (83.2%) participated; this resulted in a sample of 18,866 (87.4%) out of 21,584 students. In 2011, the overall response rate was 72.7%; from 2000 to 2011, response rates ranged from 72.7% to 84.8%. Respondents were asked about their use of cigarettes, cigars (e.g., premium cigars, cigarillos, and "little cigars"), smokeless tobacco, pipes, bidis (small brown cigarettes wrapped in a leaf), and kreteks (clove cigarettes)† within the last 30 days. For each product, current use was defined as use on at least 1 of the past 30 days. Current tobacco use was defined as current use of any of these tobacco products on at least 1 day during the past 30 days; current combustible tobacco use was defined as current use of any of these tobacco products, with the exception of smokeless tobacco, on at least 1 day during the past 30 days.
Data were adjusted for nonresponse and weighted to provide national prevalence estimates for current tobacco use, current combustible tobacco use, current cigarette smoking, as well as for use of specific tobacco products; 95% confidence intervals were calculated using statistical analysis software to account for the multistage probability sample design. Point estimate differences between the 2009 and 2011 NYTS were assessed for overall current use of tobacco products by school level (middle or high), sex, and race/ethnicity, using a two-tailed t-test for statistical significance (p<0.05). Logistic regression analysis was used to analyze temporal changes from 2000 to 2011 in current tobacco use, current combustible tobacco use, and current cigarette use, by school level, controlling for grade, race/ethnicity, and sex, and simultaneously assessed for linear and quadratic trends§; a p-value <0.05 was considered statistically significant. Statistical software was used for all calculations to account for the complex survey design.
In 2011, 7.1% of middle school students and 23.2% of high school students reported current use of any tobacco product, and 4.3% of middle school students and 15.8% of high school students reported current use of cigarettes (Table). Among middle school students, after cigarettes, the most commonly used forms of tobacco were cigars (3.5%), smokeless tobacco (2.2%), pipes (2.2%), bidis (1.7%), and kreteks (1.1%). Among high school students, after cigarettes, the most commonly used forms of tobacco were cigars (11.6%), smokeless tobacco (7.3%), pipes (4.0%), bidis (2.0%), and kreteks (1.7%).
From 2009 to 2011, among middle school students, no statistically significant declines were observed for any of the tobacco use measures. Among high school students, overall declines in current kretek use were observed (2.4% to 1.7%) (Table). Among high school students, current bidi use and current kretek use among females declined from 2.1% to 1.0% and from 1.9% to 0.8%, respectively; among non-Hispanic whites, current kretek use declined from 2.4% to 1.4%; among Hispanics, current cigarette use declined from 19.2% to 15.8%; and among non-Hispanic blacks, an increase in current cigar use (7.1% to 11.7%) was observed.
From 2000 to 2011, among middle school students, significant linear downward trends were observed for current tobacco use (14.9% to 7.1%), current combustible tobacco use (14.0% to 6.3%), and current cigarette use (10.7% to 4.3%) (Figure 1). Among high school students, significant linear downward trends were observed for current tobacco use (34.4% to 23.2%), current combustible tobacco use (33.1% to 21.0%), and current cigarette use (27.9% to 15.8%) (Figure 2).
Reported by
René A. Arrazola, MPH, Shanta R. Dube, PhD, Martha Engstrom, MS, Office on Smoking and Health, National Center for Chronic Disease Prevention and Health Promotion, CDC. Corresponding contributor: René A. Arrazola, rarrazola@cdc.gov, 770-488-2414.
Editorial Note
The findings in this report indicate that from 2000 to 2011, significant declines occurred in the use of current tobacco, combustible tobacco, and cigarettes among middle and high school students, suggesting that tobacco control policies and programs have an impact on tobacco use among U.S. youths (2). The rate of decline in youth cigarette smoking was slower during this period compared with 1997–2003, which followed years of increase in the prevalence of youth cigarette use during the 1990s (2).
Decreases were observed from 2009 to 2011 in bidi and kretek use among high school females, kretek use among non-Hispanic whites, and kretek use overall. However, notably from 2009 to 2011, among high school non-Hispanic black students, an increase in cigar use was observed. This finding is similar to prevalence trends found using other national data, with increases in cigar smoking observed among black, female high school students (2). Further, cigar use among high school males (15.7%) is more than twice as high as use among high school females (7.4%), and is comparable to use of cigarettes by high school males (17.7%). Smokeless tobacco use among high school males (12.9%) is approximately eight times higher than high school females (1.6%).
A recent report indicated that the total consumption of cigarettes decreased by 32.8% from 2000 to 2011, whereas noncigarette combustible tobacco, which includes cigars and loose tobacco, increased by 123%. Additionally, the percentage of combustible tobacco consumption composed of loose tobacco and cigars increased from 3.4% in 2000 to 10.4% in 2011 (5). These results are of importance because youths are known to have higher rates of cigar use than adults (2). Of note, cigars include traditional premium cigars, cigarillos, and "little cigars," which appear and are packaged and consumed in a manner similar to cigarettes but, depending on their weight, can be taxed at lower rates. No cigars, including cigarette-like cigars, are subject to FDA regulations.¶ In addition, cigars can be produced with flavorings and can be labeled with misleading descriptors such as "light" or "low tar." Although the use of smokeless tobacco and cigars declined during the late 1990s, little change in the use of these tobacco products has been observed during the past 5 years overall (2).
The findings in this report are subject to at least four limitations. First, the data were collected from youths who attended either public or private middle or high schools and might not be representative of all youths in the United States, especially those who were not enrolled. Second, recall bias might have been introduced because of the sensitivity of the questions or because some questions asked about past behaviors. Third, this analysis did not examine frequency and intensity of tobacco use; with the exception of cigarette use, these measures were not available. Therefore, the data do not distinguish between infrequent tobacco users, such as persons using tobacco once per month, and heavy users, such as those who use tobacco daily. Finally, these estimates might differ from estimates derived from other youth surveillance systems; these differences can be explained, in part, by differences in survey methodology used, type of survey administered, survey topic, and age and setting of the target population. However, the relative trends are similar across the various youth surveys (2).
Effective, population-based strategies for preventing tobacco use among youths are outlined in the World Health Organization's MPOWER package (6) and CDC's Best Practices for Comprehensive Tobacco Control Programs — 2007 (3). Despite partial bans on some forms of advertisement, pro-tobacco marketing continues to have an effect on youths' susceptibility to trying cigarettes (2,7). Continued efforts to reduce tobacco marketing and advertisement that affect youths might have further impacts on preventing tobacco use. In June 2010, FDA implemented regulations designed to curb access to and the appeal of cigarettes and smokeless tobacco products among youths.** These regulations, along with other tobacco use prevention activities, are expected to further reduce youth access to and use of tobacco products.
Although comprehensive tobacco control programs are effective in decreasing tobacco use in the United States, they remain underfunded (8). During 1998 to 2010 states have received a total of $243.8 billion in tobacco settlement and cigarette excise tax revenues (8); however, only $8.1 billion (2.8%) was dedicated to state tobacco control programs (8). Many states are facing drastic budgetary cuts, resulting in near elimination of their tobacco control programs (8). Evidence indicates that low levels of tobacco control funding lead to low levels of media campaigns focusing on tobacco use prevention among youths (4), which might be one reason why current declines are occurring much more slowly than those observed during the period 1997–2003, which saw a 40% decline (9). Fully funding and implementing comprehensive tobacco control programs might have further impact on preventing and reducing tobacco use among youths. A combination of sustained funding at CDC-recommended levels (3), effective population-based strategies (e.g., price increases and smoke-free policies) (2), and enforcement of the Family Smoking Prevention and Tobacco Control Act (10) are needed to influence changes in social norms around cigarette and any other tobacco use among youths.
References
- CDC. Smoking-attributable mortality, years of potential life lost, and productivity losses—United States, 2000–2004. MMWR 2008;57:1226–8.
- US Department of Health and Human Services. Preventing tobacco use among youth and young adults. Atlanta, GA: US Department of Health and Human Services, CDC; 2012. Available at http://www.cdc.gov/tobacco/data_statistics/sgr/2012/index.htm. Accessed August 1, 2012.
- CDC. Best practices for comprehensive tobacco control programs—2007. Atlanta, GA: US Department of Health and Human Services, CDC; 2007. Available at http://www.cdc.gov/tobacco/stateandcommunity/best_practices/index.htm. Accessed August 1, 2012.
- CDC. CDC grand rounds: current opportunities in tobacco control. MMWR 2010;59:487–92.
- CDC. Consumption of cigarettes and combustible tobacco—United States, 2000–2011. MMWR 2012;61:565–9.
- World Health Organization. WHO report on the global tobacco epidemic, 2008: The MPOWER package. Geneva, Switzerland: World Health Organization, 2008; Available at http://www.who.int/tobacco/mpower/mpower_report_full_2008.pdf. Accessed August 1, 2012.
- Dube SR, Arrazola R, Lee J, Engstrom M, Malarcher A. Pro-tobacco influences and susceptibility to smoking cigarettes among middle and high school students — United States, 2011. J Adolesc Health 2012;51. In press.
- CDC. State tobacco settlement and tax revenues and tobacco control funding appropriations after the Master Settlement Agreement—United States, 1998–2010. MMWR 2012;61:370–4.
- CDC. Cigarette use among high school students—United States, 1991–2009. MMWR 2010;59:797–801.
- Family Smoking Prevention and Tobacco Control Act. Public Law 111–31; June 22, 2009. Available at http://www.gpo.gov/fdsys/pkg/PLAW-111publ31/content-detail.html. Accessed August 1, 2012.
* Additional information available at http://www.cdc.gov/tobacco/tobacco_control_programs/surveillance_evaluation/key_outcome/pdfs/frontmaterial.pdf.
† Under the Family Smoking Prevention and Tobacco Control Act, kreteks (clove cigarettes) are banned.
§ Quadratic trends indicate a nonlinear but significant trend over time; a linear trend is depicted by a straight line, whereas a quadratic trend is depicted by a curve with one bend.
¶ FDA has expressed its intent to assert jurisdiction over all tobacco products, including cigars. Additional information available at http://www.gpo.gov/fdsys/pkg/FR-2011-07-07/pdf/2011-15487.pdf.
** Additional information available at http://www.fda.gov/tobaccoproducts/protectingkidsfromtobacco/regsrestrictingsale/ucm204589.htm.
What is already known on this topic?
Smoking continues to be the leading preventable cause of death and disability in the United States, and nearly 90% of adult smokers begin smoking by age 18 years.
What is added by this report?
During 2000–2011, prevalence of current tobacco use, current combustible tobacco use, and current cigarette smoking declined for middle school and high school students. Among middle school students, a linear downward trend was observed in current tobacco use (14.9% to 7.1%), current combustible tobacco use (14.0% to 6.3%), and current cigarette use (10.7% to 4.3%). Among high school students, a linear downward trend was observed in current tobacco use (34.4% to 23.2%), current combustible tobacco use (33.1% to 21.0%), and current cigarette use (27.9% to 15.8%).
What are the implications for public health practice?
Among middle and high school youths, current tobacco use has decreased. To continue decreasing tobacco use among youths, national and state tobacco control programs should continue to implement evidence-based strategies, including those that will work in conjunction with new Food and Drug Administration regulations restricting the sale, distribution, and marketing of cigarettes and other tobacco products to youths.
|
TABLE. (Continued) Prevalence of current use* of tobacco, by tobacco product, school level, sex, and race/ethnicity — National Youth Tobacco Survey, United States, 2009 and 2011 |
||||||||||||||||
|---|---|---|---|---|---|---|---|---|---|---|---|---|---|---|---|---|
|
Characteristic |
Smokeless tobacco |
Pipes |
Bidis |
Kreteks |
||||||||||||
|
2009 |
2011 |
2009 |
2011 |
2009 |
2011 |
2009 |
2011 |
|||||||||
|
% |
(95% CI¶) |
% |
(95% CI) |
% |
(95% CI) |
% |
(95% CI) |
% |
(95% CI) |
% |
(95% CI) |
% |
(95% CI) |
% |
(95% CI) |
|
|
Middle school |
||||||||||||||||
|
Sex |
||||||||||||||||
|
Female |
1.4 |
(1.0–1.9) |
1.4 |
(1.0–2.0) |
1.7 |
(1.2–2.5) |
1.8 |
(1.3–2.5) |
1.2 |
(0.8–1.8) |
1.4 |
(1.0–1.9) |
0.7 |
(0.4–1.1) |
0.9 |
(0.6–1.3) |
|
Male |
3.7 |
(2.8–4.9) |
3.0 |
(2.3–3.8) |
2.7 |
(2.1–3.6) |
2.7 |
(2.1–2.5) |
2.0 |
(1.5–2.6) |
1.9 |
(1.4–2.6) |
1.6 |
(1.2–2.2) |
1.3 |
(1.0–1.6) |
|
Race/Ethnicity |
||||||||||||||||
|
White, non-Hispanic |
2.5 |
(1.8–3.3) |
2.3 |
(1.8–2.9) |
1.5 |
(1.1–2.0) |
1.5 |
(1.1–2.2) |
1.1 |
(0.7–1.5) |
1.0 |
(0.7–1.5) |
0.8 |
(0.6–1.6) |
0.6 |
(0.4–0.6) |
|
Black, non-Hispanic |
1.7 |
(1.1–2.6) |
1.0 |
(0.5–2.1) |
1.9 |
(1.2–2.9) |
1.3 |
(0.8–2.1) |
1.9 |
(1.2–3.0) |
1.9 |
(1.1–3.2) |
1.4 |
(0.8–2.2) |
0.9 |
(0.5–1.6) |
|
Hispanic |
2.5 |
(1.9–3.3) |
2.9 |
(2.3–3.6) |
4.5 |
(3.4–6.1) |
5.0 |
(4.2–6.1) |
2.6 |
(1.9–3.7) |
3.5 |
(2.6–4.6) |
1.8 |
(1.2–2.7) |
2.5 |
(2.0–3.3) |
|
Asian, non-Hispanic |
1.7 |
(0.7–4.1) |
1.3 |
(0.4–4.2) |
1.4 |
(0.6–3.3) |
1.1 |
(0.3–3.7) |
1.6 |
(0.7–3.6) |
0.9 |
(0.3–2.9) |
0.9 |
(0.3–2.8) |
0.7 |
(0.2–2.8) |
|
Total |
2.6 |
(2.0–3.3) |
2.2 |
(1.8–2.7) |
2.3 |
(1.8–2.8) |
2.2 |
(1.7–2.9) |
1.6 |
(1.3–2.0) |
1.7 |
(1.3–2.2) |
1.2 |
(0.9–1.5) |
1.1 |
(0.9–1.4) |
|
High school |
||||||||||||||||
|
Sex |
||||||||||||||||
|
Female |
1.8 |
(1.3–2.4) |
1.6 |
(1.2–2.2) |
2.5 |
(1.9–3.3) |
2.8 |
(2.2–3.4) |
2.1 |
(1.6–2.6) |
1.0 |
(0.7–1.4)** |
1.9 |
(1.3–2.8) |
0.8 |
(0.6–1.2)** |
|
Male |
11.6 |
(8.3–15.9) |
12.9 |
(10.4–15.9) |
5.3 |
(4.5–6.3) |
5.1 |
(4.3–6.0) |
2.7 |
(2.1–3.5) |
2.9 |
(2.3–3.7) |
2.9 |
(2.3–3.7) |
2.4 |
(1.9–2.9) |
|
Race/Ethnicity |
||||||||||||||||
|
White, non-Hispanic |
8.5 |
(6.4–11.3) |
9.2 |
(7.4–11.5) |
3.3 |
(2.5–4.2) |
3.5 |
(2.9–4.4) |
1.7 |
(1.2–2.3) |
1.4 |
(1.0–2.0) |
2.4 |
(1.9–3.0) |
1.4 |
(1.0–2.0)** |
|
Black, non-Hispanic |
1.7 |
(0.7–4.1) |
3.0 |
(1.8–5.1) |
3.6 |
(2.5–5.0) |
2.4 |
(1.5–3.8) |
3.7 |
(2.2–6.3) |
2.0 |
(1.2–3.2) |
1.8 |
(1.0–3.0) |
1.3 |
(0.8–2.2) |
|
Hispanic |
4.8 |
(3.5–6.7) |
5.1 |
(3.8–6.8) |
6.8 |
(4.5–10.0) |
6.3 |
(5.2–7.7) |
3.7 |
(2.7–5.0) |
3.7 |
(2.9–4.8) |
2.9 |
(2.0–4.1) |
2.5 |
(1.9–3.3) |
|
Asian, non-Hispanic |
4.9 |
(1.8–12.8) |
2.8 |
(1.4–5.8) |
3.4 |
(1.6–7.2) |
2.9 |
(1.1–7.4) |
3.1 |
(0.8–11.7) |
1.8 |
(0.9–3.9) |
2.0 |
(0.7–5.9) |
2.2 |
(1.0–4.9) |
|
Total |
6.7 |
(4.8–9.2) |
7.3 |
(5.9–9.0) |
3.9 |
(3.4–4.6) |
4.0 |
(3.4–4.6) |
2.4 |
(1.9–2.9) |
2.0 |
(1.6–2.5) |
2.4 |
(2.0–2.9) |
1.7 |
(1.4–2.0)** |
|
* Current use of cigarettes was determined by asking, "During the past 30 days, on how many days did you smoke cigarettes?" Current use of cigars was determined by asking, "During the past 30 days, on how many days did you smoke cigars, cigarillos, or little cigars?" Current use of smokeless tobacco was determined by asking, "During the past 30 days, on how many days did you use chewing tobacco, snuff, or dip?" Current use of pipe was determined by asking, "During the past 30 days, on how many days did you smoke tobacco in a pipe?" Current use of bidis was determined by asking, "During the past 30 days, on how many days did you smoke bidis?" Current use of kreteks was determined by asking, "During the past 30 days, on how many days did you smoke kreteks?" Current use was use on ≥1 day. † Any tobacco is use of cigarettes or cigars or smokeless tobacco or tobacco pipes or bidis or kreteks on ≥1 day in the past 30 days. § Combustible tobacco is use of cigarettes or cigars or tobacco pipes or bidis or kreteks on ≥1 day in the past 30 days. ¶ Confidence interval. ** P-value of the t-test for difference between 2009 and 2011 prevalences is <0.05. |
||||||||||||||||
FIGURE 1. Current tobacco use,* current combustible tobacco use,† and current cigarette use§ among adolescents in middle school, by year — National Youth Tobacco Survey, United States, 2000–2011
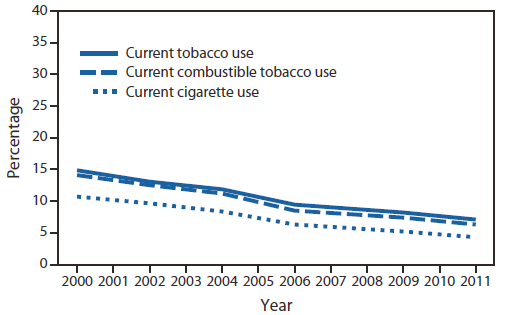
* Current tobacco use was defined as having used cigarettes, smokeless tobacco, cigars, pipes, bidis, or kreteks on at least 1 day during the past 30 days.
† Current combustible tobacco use was defined as having used cigarettes, cigars, pipes, bidis, or kreteks on at least 1 day during the past 30 days.
§ Current cigarette use was defined as having used cigarettes on at least 1 day during the past 30 days.
Alternate Text: The figure above shows current tobacco use, current combustible tobacco use, and current cigarette use among adolescents in middle school, by year, in the United States during 2000-2011, according to the National Youth Tobacco Survey. From 2000 to 2011, among middle school students, sig¬nificant linear downward trends were observed for current tobacco use (14.9% to 7.1%), current combustible tobacco use (14.0% to 6.3%), and current cigarette use (10.7% to 4.3%).
FIGURE 2. Current tobacco use,* current combustible tobacco use,† and current cigarette use§ among adolescents in high school, by year — National Youth Tobacco Survey, United States, 2000–2011
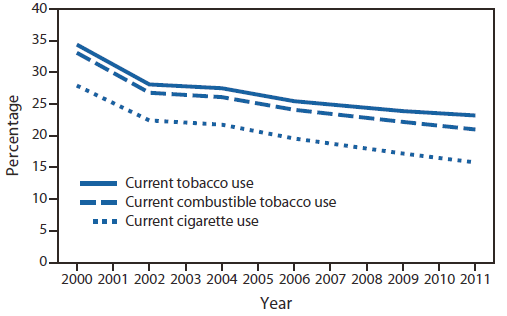
* Current tobacco use was defined as having used cigarettes, smokeless tobacco, cigars, pipes, bidis, or kreteks on at least 1 day during the past 30 days.
† Current combustible tobacco use was defined as having used cigarettes, cigars, pipes, bidis, or kreteks on at least 1 day during the past 30 days.
§ Current cigarette use was defined as having used cigarettes on at least 1 day during the past 30 days.
Alternate Text: The figure above shows current tobacco use, current combustible tobacco use, and current cigarette use among adolescents in high school, by year, in the United States during 2000-2011, according to the National Youth Tobacco Survey. Among high school students, significant linear downward trends were observed for current tobacco use (34.4% to 23.2%), current combustible tobacco use (33.1% to 21.0%), and current cigarette use (27.9% to 15.8%).
Use of trade names and commercial sources is for identification only and does not imply endorsement by the U.S. Department of
Health and Human Services.
References to non-CDC sites on the Internet are
provided as a service to MMWR readers and do not constitute or imply
endorsement of these organizations or their programs by CDC or the U.S.
Department of Health and Human Services. CDC is not responsible for the content
of pages found at these sites. URL addresses listed in MMWR were current as of
the date of publication.
All MMWR HTML versions of articles are electronic conversions from typeset documents.
This conversion might result in character translation or format errors in the HTML version.
Users are referred to the electronic PDF version (http://www.cdc.gov/mmwr)
and/or the original MMWR paper copy for printable versions of official text, figures, and tables.
An original paper copy of this issue can be obtained from the Superintendent of Documents, U.S.
Government Printing Office (GPO), Washington, DC 20402-9371;
telephone: (202) 512-1800. Contact GPO for current prices.
**Questions or messages regarding errors in formatting should be addressed to
mmwrq@cdc.gov.
