FIGURE. Prevalence of seasonal influenza and influenza A (H1N1)pdm09 (pH1N1) and vaccination coverage among women with a live birth — Pregnancy Risk Assessment Monitoring System (PRAMS), 29 states and New York City, 2009–10 influenza season
Persons using assistive technology might not be able to fully access information in this file. For assistance, please send e-mail to: mmwrq@cdc.gov. Type 508 Accommodation and the title of the report in the subject line of e-mail.
Influenza Vaccination Coverage Among Pregnant Women — 29 States and New York City, 2009–10 Season
Because influenza can be especially severe during pregnancy, the American College of Obstetricians and Gynecologists (ACOG) and the Advisory Committee on Immunization Practices (ACIP) recommend influenza vaccination for women who will be pregnant during the influenza season, regardless of trimester (1,2). During the 2009–10 influenza season, pregnant women were at increased risk for severe disease and mortality from influenza A (H1N1)pdm09 (pH1N1) pandemic virus infection (3). Anticipating this risk, both the inactivated trivalent seasonal and monovalent pH1N1 vaccinations were recommended for pregnant women (2,4). To estimate state-specific seasonal and pH1N1 influenza vaccination coverage among pregnant women, CDC analyzed data from the Pregnancy Risk Assessment Monitoring System (PRAMS). This report provides estimates from 29 states and New York City (NYC) for women who had live births during September 2009–May 2010. Median state coverage was 47.1% for seasonal and 40.4% for pH1N1 influenza vaccination. Overall, women who reported that a health-care provider offered them influenza vaccination or told them to get it during their pregnancy were more likely to be vaccinated than those without an offer or recommendation (prevalence ratio [PR] = 5.2 for seasonal, and PR = 14.4 for pH1N1). Substantial variation across areas was observed for prevalence of a provider offer or recommendation during pregnancy and for influenza vaccination. These findings highlight the need for state-specific strategies that optimize provider involvement to increase influenza vaccination of pregnant women.
CDC analyzed data from PRAMS,* an ongoing, population-based survey that collects data on a range of maternal behaviors and experiences before, during, and after pregnancy among women who recently delivered a live-born infant. PRAMS surveys currently are administered by 40 states and NYC. The monthly surveys take stratified random samples of 100–300 women with recent live births from each state birth certificate registry. The selected mothers are mailed a questionnaire after delivery; those who do not respond by mail within 2 months are contacted by telephone, and 15 attempts are made with viable telephone numbers to reach the respondents. During the 2009–10 influenza season, 29 states and NYC agreed to add a supplemental vaccination question module to their PRAMS survey. For this report, CDC analyzed data from women who had a live birth from September 1, 2009, through May 31, 2010 (27,153 women for seasonal vaccination and 27,372 women for pH1N1 vaccination). The state median response rate was 69.1% (range: 53.7%–85.0%).
CDC estimated† state-specific seasonal and pH1N1 vaccination coverage,§ overall and stratified by self-reported receipt of a health-care provider offer or recommendation for influenza vaccination during pregnancy. CDC also estimated the overall PR of vaccination coverage for women with and without a provider offer or recommendation and the population attributable risk¶ associated with provider offer or recommendation. To examine the context of observed variation in vaccination coverage among women with live births, CDC analyzed correlations between estimates for pregnant women using PRAMS data and estimates for women aged 18–49 years and adults aged ≥18 years from the same 29 states using data from the Behavioral Risk Factor Surveillance System (BRFSS).** The data were weighted to adjust for complex survey design and nonresponse. To account for the PRAMS sampling design, analyses were performed using statistical software.
Seasonal and pH1N1 influenza vaccination coverage among women with live births varied among the participating states (Figure). Among the 29 states and NYC, the estimated median percentage of women with live births reporting receipt of both seasonal and pH1N1 vaccinations was 28.5% (range: 15.0%–49.9%). The median percentage of women with live births reporting receipt of seasonal or pH1N1 vaccinations was 59.3% (range: 38.9%–80.2%). Overall correlation between PRAMS data and state coverage among adult women aged 18–49 years was high (r = 0.88 for seasonal and r = 0.80 for pH1N1); for all adults, the correlation also was high (r = 0.80 for seasonal and r = 0.88 for pH1N1).
The estimated median seasonal vaccination coverage among women with a live birth was 47.1% (range: 26.1% in Florida to 67.9% in Minnesota) (Table 1). Variation in coverage was observed for pH1N1 (Figure). Median prevalence of provider offer or recommendation for seasonal vaccination was 70.7% (range: 54.0% in Mississippi to 86.2% in Minnesota). Median pH1N1 coverage was 40.4% (range: 21.9% in Mississippi to 63.3% in Vermont) (Figure, Table 2). Median prevalence of provider offer or recommendation for pH1N1 vaccination was 73.3% (range: 53.6% in Mississippi to 88.7% in Vermont).
Vaccination coverage was higher in each state for those with a provider offer or recommendation (median: 62.1% for seasonal [Table 1] and 53.1% for pH1N1 [Table 2]), compared with those without an offer or recommendation (median: 14.3% for seasonal [Table 1] and 4.9% for pH1N1 [Table 2]). Overall, PRs of vaccination coverage for those with versus those without a provider offer or recommendation were 5.2 (95% confidence interval [CI] = 4.7–5.7) for seasonal and 14.4 (CI = 12.1–17.2) for pH1N1. The proportion of vaccination coverage that could be attributed to provider offer or recommendation was 74% for seasonal and 89% for pH1N1.
Reported by
Indu B. Ahluwalia, PhD, Leslie Harrison, MPH, Helen Ding, MD, Toyia Austin, MPA, Denise D'Angelo, MPH, Phil Hastings, PhD, Nan Ruffo, MPA, Mary Elizabeth O'Neil, MPH, Pregnancy Risk Assessment Monitoring Team, Denise Jamieson, MD, Div of Reproductive Health, National Center for Chronic Disease Prevention and Health Promotion; James A. Singleton, MS, Carolyn B. Bridges, MD, Immunization Services Div, National Center for Immunization and Respiratory Diseases, CDC. Corresponding contributor: Indu B. Ahluwalia, iahluwalia@cdc.gov, 770-488-5764.
Editorial Note
Results from PRAMS for the 2009–10 influenza season indicate that trivalent seasonal and monovalent pH1N1 vaccination coverage levels among women pregnant during the season were higher than previous seasonal rates (1–5), were highly associated with a health-care provider offer or recommendation for vaccination during pregnancy, and varied substantially among states (2,5,6). Influenza vaccination of pregnant women was a focus of public health efforts during the 2009–10 season, with extensive collaborations and mobilization of resources among local, state, federal, and private sector entities. These efforts might have contributed to higher coverage for seasonal vaccine than was observed for previous seasons.
The strong association of report of vaccination with a provider offer or recommendation for seasonal and pH1N1 vaccination reinforces findings that providers are key in vaccination acceptance (5,7). Overall, the data indicate that a high proportion of vaccination coverage can be attributed to provider offer or recommendation for both seasonal influenza and pH1N1. Health-care providers play an important role in increasing influenza vaccination coverage levels among pregnant women through their advice to be vaccinated during pregnancy. In the case of a novel strain of influenza, the role of providers in reassuring pregnant women perhaps was even more important. Sustained outreach to providers, widespread recognition of pregnant women as a group at high risk for severe influenza illness and having high priority for vaccination, extensive outreach to public and private entities to implement the pH1N1 vaccination campaign, and availability of pH1N1 vaccination without cost to patients or providers might have contributed to higher rates.
The ACOG recommendations for influenza vaccination of pregnant women and the updated ACIP guidelines, which recommend vaccinations for anyone aged ≥6 months, might lead to further increases. However, continued efforts are needed to encourage providers to recommend and offer influenza vaccination to pregnant women to sustain and improve on the gains in influenza vaccine coverage made during the 2009–10 and 2010–11 seasons (6,7).
The prevalence of a provider offer or recommendation for influenza vaccination for 2009–10 varied substantially across states. This variation might relate to state-specific approaches to implementing the pH1N1 vaccination campaign (e.g., extent that obstetricians and gynecologists were involved in administration of pH1N1 vaccination and extent and effectiveness of media campaigns) or variation in the proportion of pregnant women proactively seeking vaccination. State-specific coverage among women with live births correlated highly with coverage among adult women aged 18–49 years and among all adults. These findings suggest that other factors, such as differences in medical-care delivery infrastructure, population norms, and effectiveness of state and local influenza vaccination programs, contributed to state variation in vaccination of pregnant women during the 2009–10 season and other seasons.
The findings in this report are subject to at least three limitations. First, PRAMS data were available from 29 states and NYC and might not be generalizable to all women with live births in the United States. Second, influenza vaccination status and information on provider recommendations were reported by the mother and not verified by medical record and might be subject to recall bias because 1) those who received the vaccination might recall having received an offer or recommendation from a provider more often than those who did not, or 2) those who actively seek advice from their provider might misclassify the confirmation from their provider as "received an offer/recommendation." Finally, the cohort of women available for this analysis, with live births during September 2009–May 2010, might not represent all women who were pregnant during the 2009–10 influenza season.
Based on the findings in this report, influenza vaccination coverage among pregnant women was higher during the 2009–10 influenza season than in past influenza seasons (2,5–7). Although data from the 2010–11 season indicate continuation of these gains, continued education of physicians and pregnant women regarding the risk for severe illness and pregnancy-related complications from influenza illness and the benefits and safety of influenza vaccination is needed to improve vaccination coverage and reduce the burden of influenza among pregnant women and their infants (8). Partnerships between various stakeholders at the state, federal, and local levels will be necessary to promote increased implementation of evidence-based strategies (9) and ensure that the Healthy People 2020 objective (ID-12.10) of having 80% of pregnant women vaccinated annually for influenza is achieved.††
Acknowledgments
Members of the PRAMS working group: Izza Afgan, MPH, Kathy Perham-Hester, Mary McGehee, PhD, Alyson Shupe, PhD, George Yocher, MS, Cynthia Ulysee, MPH, Yan Li, MD, Emily Roberson, MPH, Theresa Sandidge, MA, Amy Zapata, MPH, Tom Patenaude, Diana Cheng, MD, Emily Lu, MPH, Violanda Grigorescu, MD, Judy Punyko, PhD, Brenda Hughes, MPPA, Venkata Garikapaty, PhD, Brenda Coufal, Lakota Kruse, MD, Eirian Coronado, MA, Anne Radigan-Garcia, Candace Mulready-Ward, MPH, Kathleen Jones-Vessey, MS, Connie Geidenberger, PhD, Alicia Lincoln, MSW, MSPH, Kenneth Rosenberg, MD, Tony Norwood, Sam Viner-Brown, PhD, Mike Smith, MSPH, Rochelle Kingsley, MPH, David Law, PhD, Laurie Baksh, MPH, Peggy Brozicevic, Marilyn Wenner, Linda Lohdefinck, Melissa Baker, MA, Katherine Kvale, PhD, Angi Crotsenberg, MA; members of the CDC PRAMS Team; Mary D. Brantley, MPH, Div of Reproductive Health, National Center for Chronic Disease Prevention and Health Promotion, CDC.
References
- ACOG Committee on Obstetric Practice. ACOG committee opinion number 468, October 2011. Influenza vaccination during pregnancy. Obstet Gynecol 2011;116:1006–7.
- CDC. Prevention and control of influenza with vaccines: recommendations of the Advisory Committee on Immunization Practices (ACIP), 2010. MMWR 2010;59(No. RR-8).
- Jamieson DJ, Honein MA, Rasmussen SA, et al. H1N1 2009 influenza virus infection during pregnancy in the USA. Lancet 2009;374:451–8.
- CDC. Use of influenza A (H1N1) 2009 monovalent vaccine: recommendations of the Advisory Committee on Immunization Practices (ACIP), 2009. MMWR 2009;58(No. RR-10).
- Ahluwalia IB, Jamieson DJ, Rasmussen SA, et al. Correlates of seasonal influenza vaccine among pregnant women in Georgia and Rhode Island. Obstet Gynecol 2010;116:949–55.
- CDC. Seasonal influenza and 2009 H1N1 vaccination coverage among pregnant women—10 states, 2009–10 season. MMWR 2010;59:1541–5.
- CDC. Influenza vaccination coverage among pregnant women—United States, 2010–11 influenza season. MMWR 2011;60:1078–82.
- Moro PL, Broder K, Zheteyeva Y, et al. Adverse events in pregnant women following administration of trivalent inactivated influenza vaccine and live attenuated influenza vaccine in the vaccine adverse event reporting system, 1990–2009. Am J Obstet Gynecol 2011;204:146.e1–7.
- CDC. Vaccinations to prevent diseases: universally recommended vaccinations. Community Guide systematic reviews. Atlanta, GA: US Department of Health and Human Services, CDC; 2011. Available at http://www.thecommunityguide.org/vaccines/universally/index.html. Accessed February 16, 2012.
* Additional information is available at http://www.cdc.gov/prams.
† Questions on the PRAMS supplement included the following: "At any time during your most recent pregnancy, did a doctor, nurse, or other health-care worker offer you a seasonal flu shot or tell you to get one?" and "At any time during your most recent pregnancy, did a doctor, nurse, or other health-care worker offer you an H1N1 flu shot or tell you to get one?"
§ Questions on the PRAMS supplement included the following: "During your most recent pregnancy, did you get an H1N1 flu shot?" and "Since September 2009, did you get a seasonal flu shot? This is different than the H1N1 flu shot."
¶ Population attributable risk is a measure to assess the potential contribution of provider offer or recommendation to the observed vaccination level and was calculated using the formula: P (PR-1) / [P (PR-1)+1], where P was the prevalence of receiving a provider offer or recommendation for influenza vaccination and PR was the prevalence ratio of vaccination by provider offer or recommendation.
** Information on the data sources and analytic methods used for women aged 18–49 years and adults aged ≥18 years is available at http://www.cdc.gov/flu/professionals/vaccination/coverage_1011estimates.htm.
†† Additional information available at http://www.healthypeople.gov/2020/topicsobjectives2020.
What is already known on this topic?
Since 2004, the American College of Obstetricians and Gynecologists (ACOG) and the Advisory Committee on Immunization Practices (ACIP) have recommended that all pregnant women be given seasonal influenza vaccine during any trimester of pregnancy. Before the 2009–10 influenza season, the prevalence of pregnant women who were vaccinated against seasonal influenza was low.
What is added by this report?
Among recently pregnant women from 29 states and New York City participating in the Pregnancy Risk Assessment Monitoring System (PRAMS), median state vaccination coverage was 47.1% for seasonal influenza and 40.4% for influenza A (H1N1)pdm09. Overall, women who reported that a health-care provider offered them influenza vaccination or told them to get it during their pregnancy were more likely to be vaccinated than those without an offer or recommendation. Substantial variation among states was observed for prevalence of a provider offer or recommendation during pregnancy and for influenza vaccination coverage.
What are the implications for public health practice?
Influenza vaccination of pregnant women was a focus of public health efforts during the 2009–10 influenza season, with extensive collaborations with obstetricians and gynecologists and mobilization of resources among local, state, federal, and private sector entities. These efforts likely resulted in increased vaccination coverage during the 2009–10 season but did not reach the Healthy People 2020 target of 80% vaccination. Further efforts are needed that recognize the substantial differences in vaccination rates among states and the importance of health-care providers recommending and offering vaccination.
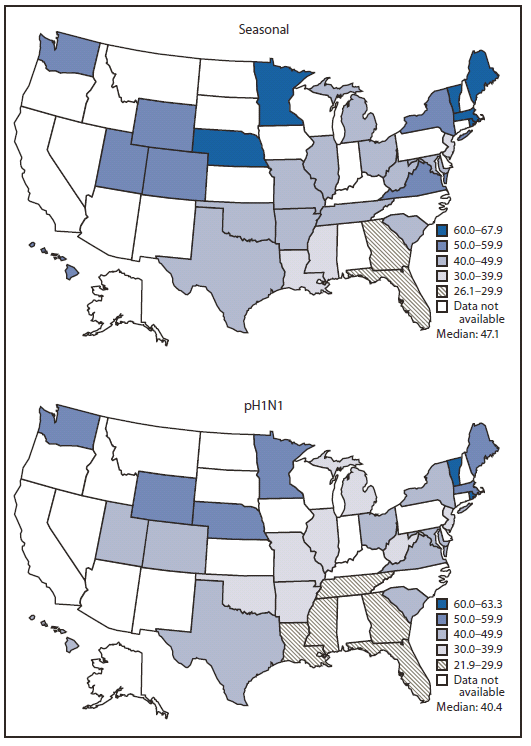
Alternate Text: The figure above shows the prevalence of seasonal and pH1N1 influenza vaccination coverage among women with a live birth in 29 states and New York City during the 2009-10 influenza season, based on data from the Pregnancy Risk Assessment Monitoring System (PRAMS). Seasonal and pH1N1 influenza vaccination coverage among women with live births varied among the participating states. Among the 29 states and NYC, the estimated median percentage of women with live births reporting receipt of both seasonal and pH1N1 vaccinations was 28.5% (range: 15.0%-49.9%). The median percentage of women with live births reporting receipt of seasonal or pH1N1 vaccinations was 59.3% (range: 38.9%-80.2%). Overall correlation between PRAMS data and state coverage among adult women aged 18-49 years was high (r = 0.88 for seasonal, and r = 0.80 for pH1N1); for all adults, the correlation also was high (r = 0.80 for seasonal, and r = 0.88 for pH1N1).
Use of trade names and commercial sources is for identification only and does not imply endorsement by the U.S. Department of
Health and Human Services.
References to non-CDC sites on the Internet are
provided as a service to MMWR readers and do not constitute or imply
endorsement of these organizations or their programs by CDC or the U.S.
Department of Health and Human Services. CDC is not responsible for the content
of pages found at these sites. URL addresses listed in MMWR were current as of
the date of publication.
All MMWR HTML versions of articles are electronic conversions from typeset documents.
This conversion might result in character translation or format errors in the HTML version.
Users are referred to the electronic PDF version (http://www.cdc.gov/mmwr)
and/or the original MMWR paper copy for printable versions of official text, figures, and tables.
An original paper copy of this issue can be obtained from the Superintendent of Documents, U.S.
Government Printing Office (GPO), Washington, DC 20402-9371;
telephone: (202) 512-1800. Contact GPO for current prices.
**Questions or messages regarding errors in formatting should be addressed to
mmwrq@cdc.gov.
