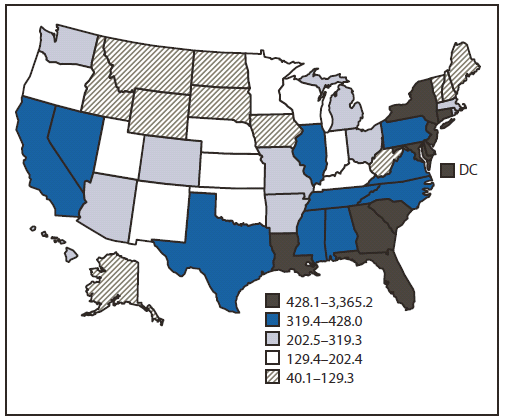
FIGURE 1. Rates of persons aged 18--64 years living with a diagnosis of HIV infection* --- National HIV Surveillance System, United States, year-end 2008
Vital Signs: HIV Prevention Through Care and Treatment — United States
Abstract
Background: An estimated 1.2 million persons in the United States were living with human immunodeficiency virus (HIV) infection in 2008. Improving survival of persons with HIV and reducing transmission involve a continuum of services that includes diagnosis (HIV testing), linkage to and retention in HIV medical care, and ongoing HIV prevention interventions, including appropriately timed antiretroviral therapy (ART).
Methods: CDC used three surveillance datasets to estimate recent HIV testing and HIV prevalence among U.S. adults by state, and the percentages of HIV-infected adults receiving HIV care for whom ART was prescribed, who achieved viral suppression, and who received prevention counseling from health-care providers. Published data were used to estimate the numbers of persons in the United States living with and diagnosed with HIV and, based on viral load and CD4 laboratory reports, linked to and retained in HIV care.
Results: In 2010, 9.6% of adults had been tested for HIV during the preceding 12 months (range by state: 4.9%--29.8%). Of the estimated 942,000 persons with HIV who were aware of their infection, approximately 77% were linked to care, and 51% remained in care. Among HIV-infected adults in care, 45% received prevention counseling, and 89% were prescribed ART, of whom 77% had viral suppression. Thus, an estimated 28% of all HIV-infected persons in the United States have a suppressed viral load.
Conclusions: Prevalence of HIV testing and linkage to care are high but warrant continued effort. Increasing the percentages of HIV-infected persons who remain in HIV care, achieve viral suppression, and receive prevention counseling requires additional effort.
Implications for Public Health Practice: Public health officials and HIV care providers should improve engagement at each step in the continuum of HIV care and monitor progress in every community using laboratory reports of viral load and CD4 test results.
Introduction
Human immunodeficiency virus (HIV) causes a chronic infection that leads to a progressive disease. Without treatment, most persons with HIV develop acquired immunodeficiency syndrome (AIDS) within 10 years of infection, which results in substantial morbidity and premature death (1). Approximately 50,000 persons in the United States were infected with HIV annually during 2006--2009 (2). Approximately 16,000 persons with AIDS die each year (3). A consistently suppressed HIV viral load is associated with reduced morbidity and mortality and a lower probability of transmitting HIV to sex partners (4). Testing identifies infected persons and is the entry point to a continuum of HIV health-care and social services that improve health outcomes, including survival. This continuum includes diagnosis (HIV testing), linkage to and retention in continuous medical care for HIV, prevention counseling and other services that reduce transmission, and appropriately timed and consistent antiretroviral therapy (ART) for viral suppression. This report estimates the number of HIV-infected persons who received selected services along the continuum of HIV care in the United States and the overall percentage of persons with HIV who had a suppressed viral load.
Methods
Data reported through June 2010 to the National HIV Surveillance System were used to calculate rates* by state per 100,000 population among persons aged 18--64 years living with diagnosed HIV infection (prevalence) at the end of 2008. Behavioral Risk Factor Surveillance System† data from 2010 were used to estimate percentages by state of persons aged 18--64 years who reported testing for HIV during the 12 months preceding the interview. Medical Monitoring Project (MMP)§ data were used to estimate numbers and nationally representative percentages of adults aged ≥18 years receiving medical care who reported receiving prevention counseling in a clinical setting¶ during the 12 months preceding the interview, and whose medical record documented that they 1) were prescribed ART during the 12 months preceding the interview and 2) had a suppressed viral load (defined as ≤200 copies/mL) at their most recent test.
Using these surveillance data and published information, CDC assessed the estimated number of persons with HIV infection (7) and the numbers and percentages of persons who were 1) aware of their infection (7), 2) linked to care (8,9), 3) retained in care (8--11), 4) prescribed ART, and 5) virally suppressed. From these analyses, CDC developed a national estimate of the percentage of all HIV-infected persons with viral suppression.
Results
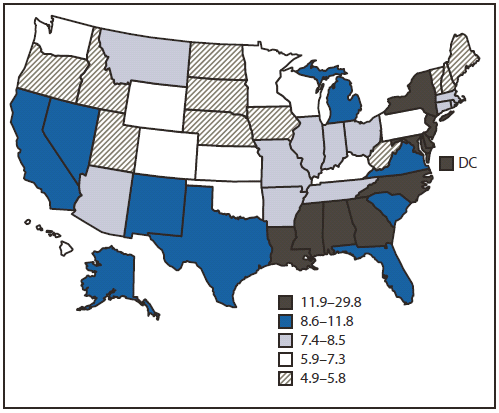
In 2008, an estimated 1.2 million persons were living with HIV in the United States, of whom 80% had been diagnosed (7). The prevalence rate for persons aged 18--64 years with an HIV diagnosis ranged by state from 40.1 to 3,365.2 per 100,000 population (Figure 1). In 2010, an estimated 9.6% of persons aged 18--64 years reported recent HIV testing (range by state: 4.9%--29.8%) (Figure 2). In general, recent HIV testing percentages were higher in states with higher HIV prevalence rates.
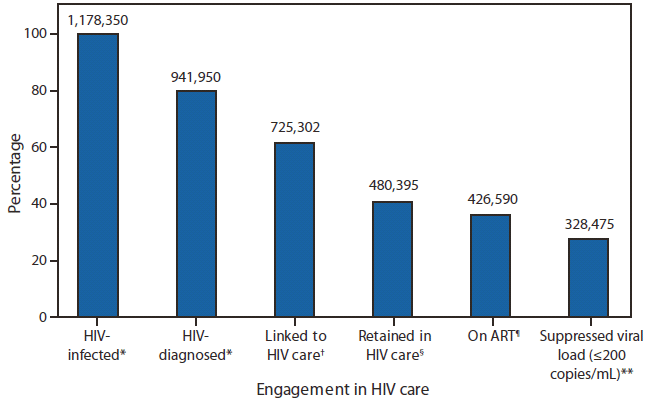
According to published studies, approximately 77% of persons diagnosed with HIV were linked to care within 3--4 months of diagnosis (8,9), and 51% were retained in ongoing care (8--11). Among adults aged ≥18 years in MMP representing persons receiving HIV medical care, 89% had been prescribed ART. Of these, 77% had a suppressed viral load at their most recent test (Table). CDC synthesized these findings to determine the number of persons in selected categories of the continuum of HIV care (Figure 3), and estimated that 328,475 (35%) of 941,950 persons diagnosed with HIV (or 28% of all 1,178,350 persons with HIV) in the United States are virally suppressed.
The percentages of patients in MMP who were prescribed ART, had documented viral suppression, and received prevention counseling from a health-care provider during the preceding 12 months varied by age group, race/ethnicity, and reported sexual behavior (Table). Prescription of ART ranged from 76% for patients aged 18--24 years to 92% for those aged ≥55 years; of those prescribed ART, viral suppression was lowest among patients aged 25--34 years (69%) and highest in those aged ≥55 years (85%). Among the 92% of whites, 89% of Hispanics or Latinos, and 86% of blacks or African Americans who were prescribed ART, 84% of whites and 79% of Hispanics or Latinos had documented viral suppression, compared with 70% of blacks or African Americans. ART prescriptions were documented for 91% of men who have sex with women only (MSW), 89% of men who have sex with men (MSM), and 86% of women who have sex with men (WSM). By sex, 79% of males (81% of MSM and 75% of MSW) had viral suppression, compared with 71% of females.
Among persons in MMP, 45% had received prevention counseling during the preceding year, ranging from 36% among persons aged ≥55 years to 73% among persons aged 18--24 years. By race/ethnicity, 54% of blacks or African Americans and 52% of Hispanics or Latinos received prevention counseling, compared with 29% of whites. Prevention counseling was received by 50% of MSW and WSM, but only 39% of MSM.
Conclusions and Comment
Among MMP participants (representing adults aged ≥18 years receiving medical care for HIV infection), 89% had been prescribed ART, of whom 77% had a suppressed viral load. However, only 28% of all persons living with HIV infection in the United States are estimated to be virally suppressed, in large part because only approximately 41% are both aware of their infection and receiving ongoing HIV care.
The observed higher percentages of persons who were recently tested in areas with higher HIV prevalence are encouraging. These findings are consistent with the recommendations of the 2010 National HIV/AIDS Strategy to intensify efforts in communities where HIV is concentrated most heavily, but continued effort is necessary to achieve the goal of increasing the proportion of persons aware of their infection from 80% to 90% (12). CDC's comprehensive HIV testing strategy includes 1) routine HIV screening in health-care settings with prevalence of undiagnosed infection ≥0.1%, 2) targeted testing of persons with risk factors associated with increased HIV prevalence, and 3) retesting at least annually for HIV-negative persons at increased risk for HIV (13).
Although the percentage of persons with HIV who are linked to care after diagnosis is 77%, more effort is needed to ensure that those patients remain in care and to eliminate disparities among subgroups who are prescribed ART and subsequently achieve viral suppression. In MMP, compared with whites, smaller percentages of blacks or African Americans and Hispanics or Latinos were prescribed ART and were virally suppressed. Differences in rates of ART prescription and viral suppression might reflect differences in insurance coverage, prescription drug costs, health-care providers' perceptions of patients' probability of adherence, or other factors associated with adherence.
Ongoing prevention interventions for persons with HIV infection are key components to reduce HIV transmission. Prevention counseling is recommended as an ongoing part of HIV care for all patients (14), but fewer than half of patients in MMP had received prevention counseling from their health-care provider during the preceding year. These low percentages, especially among MSM, who account for the most new HIV infections in the United States (2), indicate a need for health-care providers to deliver HIV prevention services more consistently.
The findings in this report are subject to at least two limitations. First, documentation of a recent suppressed viral load might not be indicative of consistent viral suppression. Second, the percentage of persons with viral suppression might be overestimated or underestimated and not representative of all persons with HIV in the United States because 1) not all states have implemented routine reporting of CD4 and viral load test results, so estimates of percentages of persons retained in care are based on a limited number of states; 2) MMP data might include persons more likely to be retained in care or adhere to ART; and 3) the estimate assumed no viral suppression among persons not in care, although a small percentage of persons demonstrate viral suppression without taking ART.
CDC's estimate that 28% of all HIV-infected persons are virally suppressed is higher than the 19% reported in a recent review (15). CDC used more recent data and different methods that did not depend on estimates of the proportion of persons in care who need ART. The previous estimate calculated that 80% of persons in care need ART, of whom 75% receive it (15).
The 2010 National HIV/AIDS Strategy goals of reducing HIV incidence, increasing access to care and improving health outcomes for persons living with HIV, and reducing HIV-related disparities and health inequities are interdependent. Reducing national HIV incidence and improving individual health outcomes require increased access to care and elimination of disparities in the quality of care received. To meet these goals and break the cycle of HIV transmission in the United States, achieving high levels of engagement at every stage in the continuum of care is essential. Currently, a substantial proportion of HIV-infected persons have been tested and initially linked to care, and of those retained in care, 89% are prescribed ART, and 77% achieve viral suppression. However, only an estimated 28% of all HIV-infected persons in the United States are virally suppressed, largely because even among those with diagnosed infection, only 51% are receiving regular HIV care (8--11). Without substantial improvement in these percentages, 1.2 million new HIV infections would be expected to occur in the United States over the next 20 years (16). Based on estimated lifetime HIV treatment costs of $367,000 per person (2009 dollars) (17) caring for persons who become infected could cost as much as $450 billion in health-care expenditures (16).
CDC supports state and local health department programs to expand and monitor HIV testing and linkage to medical care, especially in high prevalence areas. Because ensuring that persons with HIV infection receive continuous medical care is important, CDC is working with health departments throughout the nation to expand their efforts to collect laboratory reports on all CD4 and viral load test results for persons diagnosed with HIV. Local programs can use these data (in accordance with privacy and confidentiality policies, laws, and regulations) to identify persons not in care and to facilitate efforts to ensure they receive appropriate care. CDC will continue using MMP to monitor receipt of ART and prevention services among persons in care and identify opportunities for improvement. CDC will share this information with grantees, partners, health-care providers, and other federal agencies (e.g., the Health Resources and Services Administration) to improve the delivery of care, treatment, and prevention services for all persons with HIV infection.
The results in this report indicate that progress has been made; however, continued and intensified efforts are needed. Only with success at each step in the continuum of HIV care (i.e., identifying those with HIV, linking them to and retaining them in care, and ensuring they receive optimal treatment and prevention services) can the ultimate goals of improving health, extending lives, and preventing further HIV transmission be achieved.
Reported by
Stacy M. Cohen, MPH, Michelle M. Van Handel, MPH, Bernard M. Branson, MD, Janet M. Blair, PhD, H. Irene Hall, PhD, Xiaohong Hu, MS, Linda J. Koenig, PhD, Jacek Skarbinski, MD, Angie Tracey, Jonathan Mermin, MD, Linda A. Valleroy, PhD, Div of HIV/AIDS Prevention, National Center for HIV/AIDS, Viral Hepatitis, STD, and TB Prevention, CDC. Corresponding contributor: Stacy M. Cohen, scohen@cdc.gov, 404-639-4493.
References
- Hall HI, McDavid K, Ling Q, Sloggett A. Determinants of progression to AIDS or death after HIV diagnosis, United States, 1996 to 2001. Ann Epidemiol 2006;16:824--33.
- Prejean J, Song R, Hernandez A, et al. Estimated HIV incidence in the United States, 2006--2009. PLoS One 2011;6:e17502.
- CDC. Diagnoses of HIV infection and AIDS in the United States and dependent areas, 2009. HIV surveillance report, Volume 21. Atlanta, GA: US Department of Health and Human Services, CDC; 2011. Available at http://www.cdc.gov/hiv/surveillance/resources/reports/2009report/index.htm. Accessed October 25, 2011.
- Cohen MS, Chen YQ, McCauley M, et al. Prevention of HIV-1 infection with early antiretroviral therapy. N Engl J Med 2011;365:493--505.
- CDC. Behavioral Risk Factor Surveillance System Survey. Atlanta, GA: US Department of Health and Human Services, CDC; 2010. Available at http://www.cdc.gov/brfss. Accessed October 25, 2011.
- CDC. Clinical and behavioral characteristics of adults receiving medical care for HIV infection: Medical Monitoring Project, United States, 2007. MMWR 2011;60(No. SS-11).
- CDC. HIV surveillance---United States, 1981--2008. MMWR 2011;60:689--93.
- Marks G, Gardner LI, Craw J, Crepaz N. Entry and retention in medical care among HIV-diagnosed persons: a meta-analysis. AIDS 2010;24:2665--78.
- Torian LV, Wiewel EW. Continuity of HIV-related medical care, New York City, 2005--2009: do patients who initiate care stay in care? AIDS Patient Care STDS 2011;25:79--88.
- Hall IH, Mahle KC, Tang T, Li J, Johnson AS, Shouse L. Retention in care of HIV-infected adults and adolescents in 13 U.S. areas. Presented at the National HIV Prevention Conference, Atlanta, GA, August 14--17, 2011.
- Tripathi A, Youmans E, Gibson JJ, Duffus WA. The impact of retention in early HIV medical care on viro-immunological parameters and survival: a statewide study. AIDS Res Hum Retroviruses 2011;27:751--8.
- White House Office of National AIDS Policy. National HIV/AIDS Strategy for the United States. Washington, DC: White House Office of National AIDS Policy; 2010. Available at http://www.aids.gov/federal-resources/policies/national-hiv-aids-strategy/nhas.pdf. Accessed October 25, 2011.
- CDC. Revised recommendations for HIV testing of adults, adolescents, and pregnant women in health-care settings. MMWR 2006;55(No. RR-14).
- CDC. Incorporating HIV prevention into the medical care of persons living with HIV: recommendations of CDC, the Health Resources and Services Administration, the National Institutes of Health, and the HIV Medicine Association of the Infectious Diseases Society of America. MMWR 2003;52(No. RR-12).
- Gardner EM, McLees MP, Steiner JF, Del Rio C, Burman WJ. The spectrum of engagement in HIV care and its relevance to test-and-treat strategies for prevention of HIV infection. Clin Infect Dis 2011;52: 793--800.
- Long EF, Brandeau ML, Owens DK. The cost-effectiveness and population outcomes of expanded HIV screening and antiretroviral treatment in the United States. Ann Intern Med 2010;153:778--89.
- Schackman BR, Gebo KA, Walensky RP, et al. The lifetime cost of current human immunodeficiency virus care in the United States. Med Care 2006;44:990--7.
* Diagnosed HIV prevalence rates were not adjusted for reporting delays to allow inclusion of all 50 states and the District of Columbia. By June 2010, only 40 states had implemented confidential name-based HIV infection reporting for long enough (since at least January 2006) to allow for stabilization of data collection and adjustment for reporting delays.
† The Behavioral Risk Factor Surveillance System is a state-based, random-digit-dialed telephone survey of the civilian, noninstitutionalized adult population that collects information on preventive health practices and risk behaviors in the United States (5).
§ MMP collects behavioral and clinical information from a nationally representative sample of adults receiving medical care for HIV infection in outpatient facilities in the United States and Puerto Rico (6). A total of 23 project areas were funded to conduct data collection activities for the 2009--2010 MMP data collection cycle: California; Chicago, Illinois; Delaware; Florida; Georgia; Houston, Texas; Illinois; Indiana; Los Angeles County, California; Michigan; Mississippi; New Jersey; the state of New York; New York City, New York; North Carolina; Oregon; Pennsylvania; Philadelphia, Pennsylvania; Puerto Rico; San Francisco, California; Texas; Virginia; and Washington. Patients who received medical care during January--April 2009 at an MMP participating facility were interviewed once during June 2009--April 2010 regarding all medical visits during the 12 months preceding the interview. In addition, patients' medical records were abstracted for documentation of medical care (including prescription of ART and HIV viral load) for the 12 months preceding the interview. All percentages were weighted for the probability of selection and adjusted for nonresponse bias.
¶ Based on self-reported information from the patient interview about discussions with a physician, nurse, or other health-care worker. Topics might have included condom negotiation, how to practice safer sexual behavior or injection use, or how to talk with partners about safe sex. Discussion occurring during sessions that were part of HIV testing and counseling encounters were not included.
|
Key Points |
|
Abbreviation: HIV = human immunodeficiency virus.
* Rates are per 100,000 population and are not adjusted for reporting delays. Rates are categorized into quintiles. Overall rate: 417.5 per 100,000 population.
Alternate Text: The figure above shows rates of persons aged 18–64 years living with a diagnosis of HIV infection in the United States at the end of 2008, according to the National HIV Surveillance System. The prevalence rate for persons aged 18–64 years with an HIV diagnosis ranged by state from 40.1 to 3,365.2 per 100,000 population.
FIGURE 2. Percentages of persons aged 18--64 years tested for HIV infection during the preceding 12 months --- Behavioral Risk Factor Surveillance System, United States, 2010
Abbreviation: HIV = human immunodeficiency virus.
* Percentages are categorized into quintiles. Overall percentage: 9.6%.
Alternate Text: The figure above shows the percentages of persons aged 18–64 years tested for HIV infection during the preceding 12 months in the United States, during 2010, according to the Behavioral Risk Factor Surveillance System. In 2010, an estimated 9.6% of persons aged 18–64 years reported recent HIV testing (range by state: 4.9%–29.8%).
FIGURE 3. Number and percentage of HIV-infected persons engaged in selected stages of the continuum of HIV care --- United States
Abbreviations: HIV = human immunodeficiency virus; ART = antiretroviral therapy.
* HIV-infected, N = 1,178,350; HIV-diagnosed, n=941,950. Source: CDC. HIV surveillance---United States, 1981--2008. MMWR 2011;60:689--93.
† Calculated as estimated number diagnosed (941,950) × estimated percentage linked to care (77%); n = 725,302. Sources: Marks G, Gardner LI, Craw J, Crepaz N. Entry and retention in medical care among HIV-diagnosed persons: a meta-analysis. AIDS 2010;24:2665--78; Torian LV, Wiewel EW. Continuity of HIV-related medical care, New York City, 2005--2009: do patients who initiate care stay in care? AIDS Patient Care STDS 2011;25:79--88.
§ Calculated as estimated number diagnosed (941,950) × estimated percentage retained in care (51%); n = 480,395. Sources: Marks G, Gardner LI, Craw J, Crepaz N. Entry and retention in medical care among HIV-diagnosed persons: a meta-analysis. AIDS 2010;24:2665--78; Torian LV, Wiewel EW. Continuity of HIV-related medical care, New York City, 2005--2009: do patients who initiate care stay in care? AIDS Patient Care STDS 2011;25:79--88; Hall IH, Mahle KC, Tang T, Li J, Johnson AS, Shouse L. Retention in care of HIV-infected adults and adolescents in 13 U.S. areas. Presented at the National HIV Prevention Conference, Atlanta, GA, August 14--17, 2011; Tripathi A, Youmans E, Gibson JJ, Duffus WA. The impact of retention in early HIV medical care on viro-immunological parameters and survival: a statewide study. AIDS Res Hum Retroviruses 2011;27:751--8.
¶ Calculated as estimated number retained in HIV care (480,395) × percentage prescribed ART in MMP (88.8%); n = 426,590. Source: Data from the Medical Monitoring Project.
** Calculated as estimated number on ART (426,590) × percentage with suppressed viral load in MMP (77.0%); n = 328,475 (28% of the estimated 1,178,350 persons in the United States who are infected with HIV). Source: Data from the Medical Monitoring Project.
Alternate Text: The figure above shows the number and percentage of HIV-infected persons engaged in selected stages of the continuum of HIV care in the United States. CDC synthesized these findings to determine the number of persons in selected categories of the continuum of HIV care, and estimated that 328,475 (35%) of 941,950 persons diagnosed with HIV (or 28% of all 1,178,350 persons with HIV) in the United States are virally suppressed.
Use of trade names and commercial sources is for identification only and does not imply endorsement by the U.S. Department of
Health and Human Services.
References to non-CDC sites on the Internet are
provided as a service to MMWR readers and do not constitute or imply
endorsement of these organizations or their programs by CDC or the U.S.
Department of Health and Human Services. CDC is not responsible for the content
of pages found at these sites. URL addresses listed in MMWR were current as of
the date of publication.
All MMWR HTML versions of articles are electronic conversions from typeset documents.
This conversion might result in character translation or format errors in the HTML version.
Users are referred to the electronic PDF version (http://www.cdc.gov/mmwr)
and/or the original MMWR paper copy for printable versions of official text, figures, and tables.
An original paper copy of this issue can be obtained from the Superintendent of Documents, U.S.
Government Printing Office (GPO), Washington, DC 20402-9371;
telephone: (202) 512-1800. Contact GPO for current prices.
**Questions or messages regarding errors in formatting should be addressed to
mmwrq@cdc.gov.
