Corresponding author: Janet M. Blair, National Center for HIV/AIDS, Viral Hepatitis, STD, and TB Prevention, CDC, 1600 Clifton Rd., NE, MS E-46, Atlanta GA 30333. Telephone: 404-639-6298; Fax: 404-639-8640; E-mail: JBlair@cdc.gov
Persons using assistive technology might not be able to fully access information in this file. For assistance, please send e-mail to: mmwrq@cdc.gov. Type 508 Accommodation and the title of the report in the subject line of e-mail.
Clinical and Behavioral Characteristics of Adults Receiving Medical Care for HIV Infection --- Medical Monitoring Project, United States, 2007
Abstract
Problem: As of December 31, 2008, an estimated 663,084 persons were living with a diagnosis of human immunodeficiency virus (HIV) infection in the 40 U.S. states that have had confidential name-based HIV infection reporting since at least January 2006. Although HIV surveillance programs in the United States collect information about persons who have received a diagnosis of HIV infection and acquired immunodeficiency syndrome (AIDS), supplemental surveillance projects are needed to collect information about care-seeking behaviors, health-care use, and other behaviors among persons living with HIV. Data on the clinical and behavioral characteristics of persons receiving medical care for HIV infection are critical to reduce HIV-related morbidity and mortality and for program planning to allocate services and resources, guide prevention planning, assess unmet medical and ancillary service needs, and help develop intervention programs and health policies at the local, state, and national levels.
Reporting Period Covered: Data were collected during June 2007-September 2008 for patients who received medical care in 2007 (sampled from January 1-April 30).
Description of the System: The Medical Monitoring Project (MMP) is an ongoing, multisite supplemental surveillance project that assesses behaviors, clinical characteristics, and quality of care of HIV-infected persons who are receiving medical care. Participants must be aged ≥18 years and have received medical care at sampled facilities that provide HIV medical care within participating MMP project areas. Self-reported behavioral and selected clinical data are collected using an in-person interview. A total of 26 project areas in 19 states and Puerto Rico were funded to collect data during the 2007 MMP data collection cycle.
Results: The results from the 2007 MMP cycle indicated that among 3,643 participants, a total of 3,040 (84%) had some form of health insurance or coverage during the 12 months before the interview; of these, 45% reported having Medicaid, 37% reported having private health insurance or coverage through a health maintenance organization, and 30% reported having Medicare. A total of 3,091 (85%) of the participants were currently taking antiretroviral medications. Among 3,609 participants who reported ever having a CD4 T-lymphocyte test, 2,996 (83%) reported having three or more CD4 T-lymphocyte tests in the 12 months before the interview. Among 3,567 participants who reported ever having an HIV viral load test, 2,946 (83%) reported having three or more HIV viral load tests in the 12 months before the interview. Among 3,643 participants, 45% needed HIV case management, 33% needed mental health counseling, and 32% needed assistance finding dental services during the 12 months before the interview; 8%, 13%, and 25% of these participants who needed the services, respectively, had not received these services by the time of the interview.
Noninjection drugs were used for nonmedical purposes by 1,117 (31%) participants during the 12 months before the interview, and 122 (3%) participants had used injection drugs for nonmedical purposes. Unprotected anal intercourse was reported by 527 (54%) of 970 men who reported having anal sex with a man during the 12 months before the interview. Unprotected anal or vaginal intercourse was reported by 176 (32%) of the 553 men who reported having anal or vaginal intercourse with a woman during the 12 months before the interview. Unprotected anal or vaginal intercourse was reported by 216 (42%) of the 516 women who reported having anal or vaginal intercourse with a man during the 12 months before the interview.
Interpretation: The findings in this report indicate that in 2007, most persons with HIV infection who were receiving medical care were taking antiretroviral therapy and had some form of health insurance or coverage; however, some persons were not receiving needed critical ancillary services, such as HIV case management or help finding dental services. In addition, some persons living with HIV infection engaged in behaviors, such as unprotected sex, that increase the risk for transmitting HIV to sexual partners, and some used noninjection or injection drugs for nonmedical purposes, which might decrease adherence to antiretroviral therapy and increase health-risk behaviors.
Public Health Actions: MMP data can be used to monitor the national HIV/AIDS strategy goal of increasing access to care and optimizing health outcomes among persons living with HIV. Persons infected with HIV who are not receiving needed ancillary services highlight missed opportunities for access to care and other supportive services, information that can be used to advocate for additional resources. Drug use among persons with HIV infection underscores the continued need for substance abuse treatment services for this population. In addition, prevention services and programs are needed to decrease the number of HIV-infected persons engaging in unprotected sex. The data in this report can be included in local, state, and national HIV/AIDS epidemiologic profiles and shared with community stakeholders. Although data from the 2007 MMP cycle might not be representative of all persons receiving medical care for HIV infection in the United States or in the individual project areas, future MMP cycles are expected to yield weighted national estimates representing all HIV-infected persons receiving medical care in the United States.
Introduction
As of December 31, 2008, an estimated 663,084 persons were living with a diagnosis of human immunodeficiency virus (HIV) infection in the 40 U.S. states that have had confidential name-based HIV infection reporting since at least January 2006 (1). Although HIV surveillance programs in the United States collect information about persons with HIV infection and acquired immunodeficiency syndrome (AIDS) (2), provide an overview of the epidemic, and characterize the effects of HIV infection, supplemental surveillance projects provide additional information about care-seeking behaviors, health-care use, and other behaviors (3).
In 2005, in response to an Institute of Medicine report outlining the need for representative data on persons living with HIV infection (4), CDC implemented the Medical Monitoring Project (MMP). MMP was designed to be a nationally representative, population-based surveillance system to assess clinical outcomes (e.g., quality of medical care, access to and use of HIV medical care, antiretroviral therapy regimens, and virologic status) and behavioral outcomes (e.g., use of prevention services, medication adherence, and levels of ongoing risk behaviors) among persons with HIV infection who are receiving medical care in the United States (5). Unweighted data from the interview component of the 2007 MMP data collection cycle among 26 funded project areas are presented in this report.
Methods
Participating Project Areas
Data on patients who received medical care in 2007 (sampled from January 1-April 30) were collected during June 2007-September 2008. A previous report described findings from the 2005 MMP pilot cycle, which included 10 project areas (3). A total of 26 project areas were funded to conduct data collection activities for the 2007 MMP data collection cycle (Figure 1): California; Chicago, Illinois; Delaware; Florida; Georgia; Houston, Texas; Illinois; Indiana; Los Angeles County, California; Maryland; Massachusetts; Michigan; Mississippi; New Jersey; the state of New York; New York City, New York; North Carolina; Oregon; Pennsylvania; Philadelphia, Pennsylvania; Puerto Rico; San Francisco, California; South Carolina; Texas; Virginia; and Washington. All 26 project areas conducted interviews and medical record abstractions. Medical record abstraction data were not available for inclusion in this report.
Sampling Method
Detailed methods for MMP have been described previously (3,5). MMP collects behavioral and clinical information from a representative sample of patients receiving clinical services from outpatient HIV medical care facilities in the United States and Puerto Rico. MMP uses a probability proportional to size (PPS) sampling design to obtain cross-sectional probability samples of HIV-infected adults receiving medical care in the United States and Puerto Rico. The MMP 2007 sample was selected in the following three stages:
1. Selection of states. States were selected first. All 50 states, the District of Columbia, and Puerto Rico (defined as primary sampling units [PSUs]) were eligible for selection. From these 52 PSUs, 20 were selected using PPS sampling based on AIDS prevalence at the end of 2002. States with a higher AIDS prevalence had a higher probability of selection, and those with a lower AIDS prevalence had a lower probability of selection. Six municipal jurisdictions receive separate funding for HIV/AIDS surveillance (Chicago, Illinois; Houston, Texas; Los Angeles County, California; New York City, New York; Philadelphia, Pennsylvania; and San Francisco, California); these areas were included with the state for first stage sampling and comprised a city-state pair unit. If a state included a city with independent HIV surveillance authority (e.g., Texas, which includes Houston, an independently funded HIV surveillance authority), selection of the state included selection of the city (i.e., city-state pairs were selected as one unit). Nineteen states (which include the six separately funded areas within those states) and Puerto Rico were selected from the 52 PSUs, resulting in 26 MMP project areas.
2. Selection of facilities providing HIV medical care. HIV medical care facilities were selected after state selection. Facilities were defined as providing HIV medical care if they provided at least one of the following: 1) prescriptions for antiretroviral medications or 2) CD4 T-lymphocyte or HIV viral loaded testing. This definition was developed to identify providers of ongoing HIV medical care who managed HIV infection rather than referred patients to another provider. Within each participating area, MMP staff members compiled comprehensive lists of facilities providing HIV medical care by using various available data sources. The lists were developed using a listing of facilities that had reported patients to the HIV/AIDS Reporting System (HARS) or Enhanced HIV/AIDS Reporting System (eHARS), depending on which system was operational in a project area. (Additional information on HARS is available at http://www.cdc.gov/hiv/stats/hasrlink.htm.) Other additional available data sources were used, including state or local laboratory reporting databases (which include information on providers who order laboratory tests), or prescription drug lists that include information on prescribers of antiretroviral medications.
The size of each facility was determined by using the estimated patient load for the population definition period, defined as the 4-month period during January 1-April 30, 2007. This information was collected based on direct contact with the facility. Estimated patient loads that could not be obtained from facilities were obtained from HARS, eHARS, or other sources, such as state or local laboratory databases or prescription drug lists. From these lists, HIV medical care facilities were sampled with a likelihood of selection proportional to their estimated patient load. Facilities with higher patient loads had a higher probability of selection; those with lower patient loads had a lower probability of selection. Only outpatient facilities were eligible to participate in MMP. Outpatient facilities were defined as hospital-affiliated clinics, free-standing clinics, or private physicians' offices. Facilities that did not provide medical care (e.g., HIV counseling and testing sites) were excluded from the list of facilities, as were emergency departments, facilities located outside of the MMP areas, federal prisons, facilities in military installations, and facilities that provided HIV medical care exclusively to persons aged <18 years. All sampled facilities were recruited to participate. If a facility declined to participate or was found to be ineligible, that facility was not replaced with another facility (i.e., substitution of facilities was not allowed).
3. Selection of patients receiving medical care. Individual patients were sampled after facility selection. Each participating facility compiled comprehensive lists of eligible patients seen during the population definition period. The sample of patients was selected from the compilation of all patient lists within each area. Project areas attempted to recruit all sampled patients to participate.
Participant Recruitment
Patients selected in the third stage of sampling were then recruited to participate through one of two strategies: enrollment by MMP staff or by health-care providers. The strategy used depended on clinic needs, project area needs, Institutional Review Board (IRB) requirements, and the number of patients sampled from a given facility. For enrollment by MMP staff members, facilities provided local MMP staff members with contact details for patients. For enrollment by health-care providers, patients selected to participate were initially contacted by their health-care provider either in person, by telephone, or by mail, and then were contacted by MMP staff members. The same participant eligibility criteria were used in all participating project areas: diagnosis of HIV infection, age ≥18 years, no previous participation in MMP during the current data collection cycle, receipt of medical care at the sampled facility during the population definition period, and ability to provide informed consent.
Data Collection
MMP consists of two components: 1) an in-person interview and 2) medical record abstraction. Medical record abstraction data were not available for inclusion in this report. The questionnaire is administered by a trained interviewer using computer-assisted personal interview (CAPI) software on a laptop or handheld computer. Three versions of the interview questionnaire (in both English and Spanish) were developed: a standard questionnaire, a short questionnaire, and a proxy questionnaire. The short questionnaire is administered when a patient is unable to complete the longer standard interview or when translation to a language other than Spanish is required. The proxy questionnaire responses are obtained from a respondent who serves as a substitute for a patient who is too incapacitated to provide responses or who is deceased. Data from interviews completed using the short and proxy questionnaires are not included in this report because the data are from abridged versions of the standard questionnaire, are obtained under circumstances that vary from those for which the standard interview is administered, and require different interpretation.
Persons who agreed to participate were interviewed in a private location (e.g., at home or in a clinic). The standard interview contained seven modules and took approximately 45 minutes to complete. (Additional information on MMP, including copies of questionnaires, is available at http://www.cdc.gov/hiv/topics/treatment/MMP/data.htm.) The modules included questions on demographics, access to and use of health care (including antiretroviral medications), unmet needs for services, sexual behavior, drug and alcohol use, use of prevention services, and health and well-being.
Statistical Analyses
Data were encrypted and transmitted to CDC through a secure data network; statistical software was used for cleaning, for analysis, and to create frequency tables. Data are not reported for questions with fewer than five responses. This report presents the results of a descriptive analysis from the 26 participating project areas. No statistical tests were performed.
Measures
Interview Reference Periods
The time frames for behaviors and services accessed include 1) ever (in the participant's lifetime), 2) at any point since HIV diagnosis, 3) during the past 12 months (i.e., the 12 months before the interview), and 4) most recent (the most recent occurrence during the 12 months before the interview). Alcohol use during the past 12 months and past 30 days, noninjection and injection drug use for nonmedical purposes during the past 12 months, and injection drug use for nonmedical purposes during the participant's lifetime are reported. The time frame used for receipt of pneumococcal vaccine is during the 5 years before the interview.
Characteristics of Participants
Characteristics of participants included gender, self-reported sexual orientation, race/ethnicity, age at interview, education level, country or territory of birth, time since HIV diagnosis, health insurance or coverage, and type of coverage. The gender categories were male, female, and transgender. Participants were classified as transgender if reported sex at birth and current gender as reported by the participant were not the same or if they answered "transgender" to the interview question regarding self-identified gender. Sexual orientation categories were heterosexual or straight; homosexual, gay, or lesbian; and bisexual. Race/ethnicity categories were non-Hispanic black, non-Hispanic white, Hispanic or Latino, American Indian/Alaska Native, Asian, Native Hawaiian/Pacific Islander, multiracial, and other. Age groups included 18-24 years, 25-29 years, 30-34 years, 35-39 years, 40-44 years, 45-49 years, 50-54 years, 55-59 years, 60-64 years, and ≥65 years. Educational attainment was categorized as less than high school, high school diploma or GED (general educational development) credential, and more than high school. Time since HIV diagnosis was categorized as ≥5 years and <5 years. Health insurance or coverage was categorized as Medicaid, Medicare, private health insurance or health maintenance organization, and other (including Tricare/CHAMPUS and Veterans Administration coverage). Participants could select more than one response for insurance or coverage.
Participants also were asked if they had been homeless at any time during the 12 months before the interview. MMP uses the McKinney-Vento definition of homelessness, which categorizes persons as homeless if they lack a fixed, regular, adequate night-time residence or if they have a steady night-time residence that is 1) a supervised publicly or privately operated shelter designed to provide temporary living accommodation, 2) an institution that provides a temporary residence for persons intended to be institutionalized, or 3) a public or private place not designed for or ordinarily used as a regular sleeping accommodation for human beings (e.g., an automobile or under a bridge).*
Participants were also asked about their primary payment method for prescription medications for HIV and related illnesses, whether they had applied for public assistance, whether they received any form of public assistance (including Social Security Supplemental Income [SSI] or Social Security Disability Insurance [SSDI]), and their primary source of money or financial support. All payment questions referred to the 12 months before the interview.
Delays in Seeking Medical Care and Use of Health-Care Services
Participants were asked whether they delayed their first visit to a doctor, nurse, or other health-care worker for HIV medical care for >3 months after receiving a diagnosis of HIV infection and if so, the primary reason for the delay. Participants also were asked if they had a usual source of HIV medical care during the 12 months before the interview and whether they had been admitted to a mental health facility or received HIV care at an obstetrics and gynecology clinic (women only). Additional measures of health-care use included the number of participants who reported emergency department visits, urgent care center visits, and hospitalizations (including length of stay), as well as visits to sexually transmitted disease (STD) clinics and testing for syphilis, gonorrhea, chlamydia, herpes, genital warts, nongonococcal urethritis (men only), and other STDs during the 12 months before the interview.
Antiretroviral Medications and Adherence, CD4 T-Lymphocyte and HIV Viral Load Testing, and Vaccinations
Participants were asked whether they had taken antiretroviral medications, as well as their reasons for never taking antiretrovirals, for not currently taking antiretrovirals, and for not taking the last missed antiretroviral dose. Participants also were asked about the frequency of CD4 T-lymphocyte count and HIV viral load testing and their most recent CD4 T-lymphocyte count and HIV viral load test results during the 12 months before the interview. The CD4 T-lymphocyte count categories were as follows: 0-49 cells/mm3, 50-99 cells/mm3, 100-199 cells/mm3, 200-349 cells/mm3, 350-499 cells/mm3, ≥500 cells/mm3, and "don't know." The HIV viral load categories were as follows: undetectable, detectable but <5,000 copies/mL, 5,000-100,000 copies/mL, >100,000 copies/mL, and "don't know." Receipt of seasonal influenza vaccine and pneumococcal pneumonia vaccine are also reported.
Unmet Need for Services
Participants were asked whether they needed and received ancillary services. For each service, the participant's need was self-perceived and determined by the participant. Ancillary services needed during the past 12 months but not received by participants before the interview were HIV case management, mental health counseling, assistance finding dental services, social services (e.g., insurance assistance or financial counseling), transportation assistance, assistance finding meals or food, assistance finding shelter or housing, assistance finding a doctor for ongoing medical services, obtaining education or information about HIV risk reduction, chore or homemaker services, home health services (e.g., home nursing care or assistance), adherence support services (i.e., professional help remembering to take HIV medications on time or correctly), and child care services.
Alcohol and Drug Use
Participants were asked about alcohol use during the 12 months and 30 days before the interview. A drink was defined as one can of beer, a glass of wine, or a shot of liquor. Excessive drinking was defined as five or more drinks per day for men and four or more drinks per day for women.
Participants were asked about the use of noninjection and injection drugs. Noninjection and injection drugs were defined as all drugs, including legal drugs, that were not used for medical purposes. Participants were asked about lifetime (ever) use of injection drugs (i.e., whether they had ever used them). Participants also were asked about use of noninjection and injection drugs for nonmedical purposes during the 12 months before the interview. Participants could report the use of multiple types of drugs. Admission to an inpatient drug or alcohol treatment center during the past 12 months also was reported.
Sexual Behavior
Participants who identified themselves as male or female were asked about the number of sex partners they had during the 12 months before the interview, the sex of their partners, and the following behaviors: sexual activity (i.e., anal, vaginal, or oral sex) and unprotected sexual intercourse (anal or vaginal intercourse without a condom) with at least one partner. Participants were also asked about their most recent sex partner, including sex of their partner and knowledge of their partner's HIV status.
Prevention Activities
Participants were asked about participation in group-level interventions consisting of at least one organized session with a small group of persons to discuss ways to prevent HIV infection. They also were asked about receipt of free condoms from various organizations.
Results
Facility and Participant Response Rates
The median facility participation rate for the 2007 cycle was 91%, ranging from 65% to 100% by project area. A total of 15 project areas had overall facility participation rates of ≥90%.
From the 26 participating project areas (Table 1), a sample of 10,503 persons was selected from 582 participating facilities. Of these sampled persons, 311 were ineligible: 29 were duplicates, 18 were aged <18 years, 63 were HIV-negative, 114 had not received care during the population definition period, and 87 were ineligible for other reasons, resulting in a total of 10,192 persons who were eligible for participation in MMP. The median patient participation rate for the 2007 cycle was 40% among eligible patients, with a range of 3% to 76% by project area.
A total of 3,944 participants were interviewed. Data for 43 participants were excluded because the interviewer questioned the validity of the responses. Because behaviors might change after HIV diagnosis and the MMP interview primarily focuses on behaviors during the past year, interview data also were excluded for 24 participants who had received their diagnosis <12 months before interview and 234 participants for whom date of HIV diagnosis was missing or could not be determined to have been at least 12 months before the interview. Therefore, this report includes data from 3,643 interviews using the standard questionnaire.
Characteristics of Participants
Among the 3,643 participants, 72% were male, 26% were female, and 1% were transgender (Table 2). Forty-nine percent of participants reported their sexual orientation as heterosexual, 42% as homosexual, and 8% as bisexual. Most participants were non-Hispanic black (40%) or non-Hispanic white (35%). The age groups with the greatest proportion of participants were 40-44 years (20%) and 45-49 years (22%). Approximately half of participants had more than a high school education (51%), and most were born in the United States (82%). The majority of participants (78%) had been diagnosed with HIV infection ≥5 years previously. A total of 8% of participants reported that they had been homeless at some time during the 12 months before the interview.
Of the 3,040 (84%) participants who reported having any or multiple types of health insurance or coverage during the past 12 months, 45% reported having Medicaid, 37% reported having private health insurance or coverage through a health maintenance organization, and 30% reported having Medicare. (Participants could select more than one type of medical insurance or coverage response.) Participants primarily paid for prescription medications for HIV and related illnesses through Medicaid, Medicare, or both (41%); private health-care coverage (25%); or the AIDS Drug Assistance Program (25%) (information available at http://hab.hrsa.gov/abouthab/partbdrug.html). A total of 19% of participants reported applying for public assistance during the past 12 months. Forty-nine percent of participants had received public assistance, including SSI or SSDI, during the past 12 months, and 40% reported that SSI or SSDI was their primary source of money or financial support during the past 12 months (Table 2).
Delays in Seeking Medical Care and Use of Health-Care Services
Among 3,095 participants for whom the time from receipt of HIV diagnosis and first visit to a physician, nurse, or other health-care worker for HIV medical care could be calculated, 2,400 (77%) made their first visit ≤3 months after receiving the diagnosis, 242 (8%) >3 to <12 months after receiving the diagnosis, and 453 (15%) ≥12 months after receiving the diagnosis. Respondents who delayed their first visit for >3 months cited various reasons for the delay (Table 3), including not wanting to think about being HIV-positive (21%), feeling good and that they did not need to go (18%), and not believing the test result (8%).
Among 3,643 persons interviewed, 3,626 reported having one place in particular, such as a physician's office or clinic, where they usually went for most of their HIV medical care, including CD4 T-lymphocyte and HIV viral load testing or to receive HIV-related medications, during the past 12 months. Of 3,599 persons for whom the date of last visit for medical care was available, 2,982 (83%) reported that they had visited a health-care provider within the past 3 months. Among 959 women, 244 (25%) reported receiving HIV care at an obstetrics and gynecology clinic during the past 12 months.
A total of 113 (3%) participants reported having been admitted to a mental health facility during the past 12 months. In addition, 329 (9%) participants reported that they had been to an emergency department, 105 (3%) reported going to an urgent care center, and 252 (7%) reported having been admitted to the hospital during the past 12 months. The mean reported length of stay was 12 days (range: 1-76 days) among the 247 participants who were admitted to a hospital and reported a length of stay.
Among the 3,643 participants, 1,545 (42%) reported being tested for an STD during the past 12 months; the most common STD tests received were for syphilis (37%), gonorrhea (32%), chlamydia (30%), and herpes (28%) (Table 4). A total of 158 (4%) of the 3,643 participants reported having gone specifically to an STD clinic for STD testing, diagnosis, or treatment during the past 12 months.
Antiretroviral Medications and Adherence
Among all participants, 3,359 (92%) reported ever taking antiretroviral medications for HIV infection, and 3,091 (85%) reported currently taking antiretrovirals. Among the 542 participants who reported not currently taking antiretrovirals, 283 (52%) reported never having taken them. The most common reasons for never taking antiretroviral medications were that a physician advised delaying treatment (47%), the participant's CD4 count or viral load or both were good (35%), and the participant felt good and thought the medications were not needed (5%) (Table 5). Among 257 participants with a history of antiretroviral use, the most common reasons for not currently taking these medications were that a physician advised delaying treatment (25%), the participant's CD4 count or viral load or both were good (23%), the participant felt good and thought the medications were not needed (7%), and the participant worried about side effects (6%) (Table 6).
Among 3,091 participants who were currently taking antiretroviral medications, 1,071 (35%) did not take all antiretroviral doses during the month before the interview. The most common reasons given for not taking the last missed dose during the past month were forgetting to take it (38%), a change in daily routine (12%), being busy with other things (11%), and wanting to avoid side effects (7%) (Table 7).
Vaccinations
Among all 3,643 participants, 2,888 (79%) reported that they had received a seasonal influenza vaccination during the past 12 months. A total of 2,148 (59%) reported receiving a pneumococcal pneumonia vaccination during the past 5 years.
CD4 T-Lymphocyte and HIV Viral Load Testing
The most recent CD4 count among 3,592 participants who reported having a CD4 T-lymphocyte test during the past 12 months was <200 cells/mm3 for 325 (9%) participants, 200-349 cells/mm3 for 508 (14%), 350-499 cells/mm3 for 700 (20%), ≥500 cells/mm3 for 1,305 (36%), and unknown for 754 (21%) participants (Figure 2). Among 3,609 participants who reported ever having a CD4 T-lymphocyte count test, 2,996 (83%) reported having three or more tests in the past 12 months. Among 3,546 participants who reported having an HIV viral load test during the past 12 months, the most recent viral load was undetectable for 2,064 (58%) participants; however, the viral load was unknown for 720 (20%) (Figure 3). Among 3,567 participants who reported ever having an HIV viral load test, 2,946 (83%) reported having three or more tests during the past 12 months.
Unmet Need for Services
The most frequently reported ancillary services needed among the 3,643 participants were HIV case management (1,650 [45%] participants), mental health counseling (1,200 [33%]), assistance finding dental services (1,157 [32%]), social services (1,124 [31%]), and transportation assistance (899 [25%]). Participants who needed but had not received these services by the time of the interview included 139 (8%) of those who needed HIV case management, 157 (13%) of those who needed mental health counseling, 294 (25%) of those who needed assistance with finding dental services, 210 (19%) of those who needed assistance with social services, and 144 (16%) of those who needed transportation assistance (Table 8).
Alcohol and Drug Use
A total of 1,858 (51%) participants reported drinking alcohol during the past 12 months, and 1,518 (42%) reported drinking alcohol and the number of drinks they consumed on a typical day during the past 30 days. Among those who drank alcohol during the past 30 days and who also reported the number of drinks they consumed, the typical average daily consumption was 3.0 drinks. Excessive drinking (five or more drinks per day for men, four or more for women) during the past 30 days was reported by 500 (14%) participants (408 men and 92 women). Among these participants, the average number of days of excessive drinking in the past month was 5.1 for men and 4.1 for women.
Overall, 1,117 (31%) participants reported using noninjection drugs for nonmedical purposes during the past 12 months. Of these, 841 (75%) reported using marijuana, 243 (22%) amyl nitrate ("poppers"), 240 (21%) cocaine that is smoked or snorted, and 201 (18%) crack cocaine (Table 9).
A total of 748 (21%) participants reported having ever used injection drugs for nonmedical purposes, and 122 (3%) had injected drugs during the past 12 months. Among the 122 participants who injected drugs during the past 12 months, the drugs most frequently injected were crystal methamphetamine by 65 (53%) participants, cocaine (only) by 48 (39%), heroin and cocaine together by 46 (38%), and heroin (only) by 44 (36%) (Table 10). A total of 139 (4%) MMP participants had been admitted to an inpatient drug or alcohol treatment center during the past year.
Sexual Behavior
Among 970 men who reported having anal intercourse with at least one man during the past 12 months, 527 (54%) reported having unprotected anal intercourse (Table 11). Of 1,196 men who had anal or oral sex with men, 960 (80%) reported knowing the HIV status of their most recent male sex partner (Table 12).
Of 553 men who reported having anal or vaginal intercourse with at least one woman during the past 12 months, 176 (32%) reported having unprotected anal or vaginal intercourse (Table 11). Among 569 men who had anal, vaginal, or oral sex with women, 446 (78%) reported knowing the HIV status of their most recent female partner (Table 12).
Among 516 women who reported having had anal or vaginal intercourse with at least one man during the past 12 months, 216 (42%) reported having unprotected anal or vaginal intercourse (Table 11), and 428 (83%) reported knowing the HIV status of their most recent male partner (Table 12).
Assessment of Prevention Activities
During the 12 months before the interview, 631 (17%) respondents participated in at least one organized session involving a small group of persons (excluding discussions with friends) to discuss ways to prevent HIV. Of these, 544 (86%) discussed ways to talk to a partner about safe sex, 471 (75%) practiced ways to talk with a partner about safe sex, and 532 (84%) discussed ways to use condoms effectively.
A total of 2,148 (59%) participants reported receiving free condoms from various organizations during the past 12 months; of these, 809 (38%) received condoms from HIV/AIDS-focused community-based organizations, 654 (30%) from an adult HIV/AIDS specialty clinic, and 342 (16%) from a community health center or public health clinic. Among the participants who reported receiving free condoms, 1,405 (65%) stated that they had used the free condoms they received, and 1,549 (72%) stated that receiving these free condoms made them more likely to use condoms during sex.
Discussion
Access to Health Care
The benefits of treatment provided early in the course of HIV infection are well documented and include increased survival, reduced morbidity, and reduced HIV transmission (6,7). One goal outlined in the U.S. national HIV/AIDS strategy is to increase access to care and optimize health outcomes for persons living with HIV infection in the United States. A step toward establishing this goal is creating a seamless system to immediately link patients to continuous and coordinated quality care when they receive a diagnosis of HIV infection. One benchmark measure of the national HIV/AIDS strategy is to increase from 65% to 85% by 2015 the percentage of HIV-infected persons who are linked to clinical care within 3 months of receiving an HIV infection diagnosis (8). In this survey, approximately three fourths of respondents with valid self-reported dates of HIV diagnosis and subsequent initiation of medical care reported going to a health-care provider within 3 months of receiving the diagnosis. Delayed medical care after HIV diagnosis has been well documented in the literature (9-15). Current HIV care guidelines recommend HIV care visits every 3-6 months (16,17). Monitoring patterns of care, as well as entry into medical care, among persons with HIV is critical and will continue to be an important use of MMP data to help measure progress on objectives set forth by the national HIV/AIDS strategy.
STD Testing
STD infection might suggest recent or ongoing sexual behaviors that could result in HIV transmission (18), and many STDs can increase the risk for acquisition and transmission of HIV (19). Identifying and treating STDs can reduce the potential for spread of these diseases among groups at high risk for infection (i.e., sexual networks) (18). Current primary care guidelines for persons infected with HIV recommend that those at risk for STDs be screened annually for syphilis, gonorrhea, and chlamydia (17). Among the 3,643 participants, 1,545 (42%) reported being tested for an STD during the past 12 months; most were tested for syphilis, gonorrhea, and chlamydia. These findings suggest that too few HIV-infected persons in care are being tested annually. Screening HIV-infected persons for STDs is critical to identify those at risk for transmitting HIV and other STDs (18). Health-care providers should be encouraged to test sexually active HIV-infected patients for STDs annually.
Antiretroviral Medications and Adherence
Adherence to therapy is necessary for HIV viral suppression and to prevent the emergence of resistance mutations (16). Understanding the reasons for nonadherence to antiretroviral therapy is critical for developing strategies to increase adherence. MMP provides data to measure adherence to antiretroviral medication regimens and specific reasons for nonadherence among HIV-infected persons. The 35% of participants who were not completely adherent gave various reasons for not taking the last antiretroviral dose they missed, including forgetting to do so, a change in daily routine, and being busy with other things. As recommended in the current HIV treatment guidelines, strategies to improve adherence include prescribing less complex regimens (e.g., fewer pills, fewer doses, or both), using a multidisciplinary team approach to care (e.g., nurses, social workers, pharmacists, and medication managers), and using clinician encounters as an opportunity to assess adherence and, if needed, to provide counseling (16). Other strategies include providing resources such as pill boxes (16) and medication alarms to remind patients to take medication (20). Data from MMP can increase clinician awareness about the extent of and reasons for nonadherence to antiretroviral medications and be used in the development of new interventions to improve adherence.
CD4 T-Lymphocyte and HIV Viral Load Testing
HIV CD4 T-lymphocyte testing is used to assess immune function, and HIV viral load testing is used to monitor the amount of HIV in the blood (16); both can be used to monitor access to and use of care. HIV viral load is the most important indicator of response to therapy (16). Thirty-six percent of participants reported that their most recent CD4 count during the past year was ≥500 cells/mm3, and 58% reported that their most recent viral load in the past year was undetectable. Guidelines for the treatment and management of HIV infection include monitoring CD4 T-lymphocyte and viral load results every 3-4 months after diagnosis (16,17). However, some health-care providers perform HIV viral load testing every 6 months for patients who are adherent to antiretroviral therapy, who have had their HIV viral load suppressed for more than 2-3 years, and whose clinical and immunologic status is considered stable (16). Eighty-three percent of MMP participants who had ever had a CD4 test reported having three or more CD4 tests during the past 12 months, and 83% of participants who had ever had a viral load test reported having three or more viral load tests during the past 12 months, suggesting that most MMP participants received CD4 T-lymphocyte and HIV viral load testing at regular intervals as recommended in the antiretroviral treatment guidelines.
Vaccinations
Public health recommendations for persons with HIV infection include vaccination every year to prevent influenza and consideration of vaccination every 5 years to prevent Streptococcus pneumoniae infection (21). MMP data indicate that approximately 79% of participants received seasonal influenza vaccine during the past 12 months, and 59% received pneumococcal vaccine during the past 5 years. A study of a cohort of HIV-infected women in the United States enrolled in the Women's Interagency Health Study found self-reported influenza vaccination status obtained during interview to be 55% for the 2006-2007 influenza season and 57% for the 2007-2008 influenza season (22). The Adult and Adolescent Spectrum of HIV Disease Project, a medical record abstraction project conducted among HIV-infected persons, found that influenza vaccination coverage increased from 28.5% in the 1990-1991 influenza season to 41.6% in the 2002-2003 influenza season (23). The HIV Outpatient Study, also a medical records abstraction project conducted among HIV-infected persons, reported influenza rates during eight influenza seasons (1999-2008) and found that vaccination rates ranged from 25.8% to 43.3% (24). The data in this report were obtained by self-report rather than from medical record abstraction, which might explain, in part, the high proportion of participants who had been vaccinated in the past year.
Unmet Need for Services
MMP data underscore the continued need for ancillary HIV services and can be used to help determine how resources should be allocated. Use of HIV case management has been shown to increase use of antiretroviral medications (25), and overall use of ancillary services has been associated with retention in medical care (26,27) and improved quality of life (28). In this report, the services needed during the past 12 months by the largest proportions of MMP respondents were HIV case management, mental health counseling, and assistance finding dental services. Failure to receive these services might adversely affect health behaviors (e.g., result in decreased adherence to medication regimens and the ability to stay engaged in care) (29).
Alcohol and Drug Use
Injection drug use can result in direct transmission of HIV; in addition, the use of alcohol (30,31), noninjection drugs (31,32), and injection drugs (33) are associated with risky sexual behaviors and might complicate the medical management of HIV infection (34-36). Persons who use drugs for nonmedical purposes might also have other conditions that increase morbidity and mortality (16). MMP data on the use of alcohol, noninjection drugs, and injection drugs can be used by persons developing measures to prevent alcohol and substance abuse among those infected with HIV. Fifty-one percent of MMP participants reported drinking alcohol during the past 12 months, 42% reported drinking alcohol in the past 30 days, and 14% reported excessive drinking during the past 30 days. In addition, 31% of participants reported using noninjection drugs, and 3% reported injecting drugs during the past 12 months. Clinicians who provide medical care to HIV-infected persons can play a critical role in helping them reduce drug use behaviors that increase risk of HIV transmission by screening for these behaviors, delivering prevention messages, positively reinforcing changes to safer behavior, and referring patients for substance abuse treatment (18).
Sexual Behavior
Studies have found that the prevalence of high-risk sexual behaviors decreases after persons become aware that they are infected with HIV (37,38). Risky sexual behaviors were reported by a high proportion of MMP participants. The proportion of MMP participants who had unprotected anal or vaginal intercourse with at least one partner during the past 12 months varied by the sex of the participants and their partners: 32% for males with female sex partners, 42% for females with male sex partners, and 54% for males with male sex partners. However, the proportion of males and females who reported that they knew the HIV status of their most recent sex partner was similar: 80% for males who had male partners, 78% for males who had female partners, and 83% for females who had male partners.
Assessment of Prevention Activities
Measuring exposure to and use of prevention services can identify missed opportunities for prevention counseling or the need for additional services. Seventeen percent of respondents reported participating in organized group sessions to discuss HIV prevention; however, 86% of these reported discussing ways to talk to a partner about safe sex, 75% practiced ways to talk with a partner about safe sex, and 84% discussed ways to use condoms effectively. Male latex condoms, when used correctly and consistently, are effective in preventing HIV and other STDs (39-41). MMP monitors receipt and use of free condoms and access to and use of other prevention services. Fifty-nine percent of participants reported receiving free condoms during the past 12 months; of these, 65% reported using the free condoms they received, and 72% reported that receiving these free condoms made them more likely to use them. MMP data can be used to monitor exposure to HIV prevention programs and for efforts to develop and improve local, state, and national HIV prevention interventions.
Limitations
The findings presented in this report are subject to at least four limitations. First, overall patient participation was low for the 2007 MMP data collection cycle and the data are unweighted; therefore, the results might not be nationally or locally representative and are not generalizable to all HIV-infected persons in care in the United States. Second, because the survey was administered via in-person interviews, certain responses might be subject to social response bias (e.g., underreporting of socially undesirable behaviors such as drug use or certain sexual behaviors and overreporting of socially desirable behaviors such as adherence to antiretrovirals and condom use). Third, clinical information (i.e., laboratory values, vaccinations, and other medical information) obtained from the MMP interview is self-reported. Because medical record abstraction data were not available for inclusion in this report, information reported by participants during the interview could not be compared with information collected by medical record abstraction. Analyses of MMP medical record abstraction data are planned to describe fully the clinical characteristics of adults receiving medical care for HIV infection. Finally, in certain instances, stratification by certain characteristics produced numbers that were too small for reliable interpretation.
Conclusion
Through ongoing data collection, MMP will continue to provide important and useful information on behavioral and clinical characteristics of persons with HIV infection who are receiving HIV medical care, including characteristics related to prevention, seeking medical care, treatment, receipt of needed ancillary services, and risk behaviors. Certain limitations of MMP have been addressed in subsequent data collection cycles. Beginning with the 2009 MMP data collection cycle, several steps were taken to improve participation rates. The length of time from selection of patients receiving medical care to recruitment of participants (contacting patients for interview) was shortened to find patients more quickly after receipt of care at the MMP participating facilities. Contacting patients more quickly after receipt of care during the population definition period might increase the likelihood they have up-to-date contact information and facilitate the ability to locate persons for recruitment and participation in MMP. Efforts to engage HIV care facilities that are selected for participation in MMP have also become more focused on and tailored to the type of health-care facility involved. Future MMP data are anticipated to provide nationally representative estimates of clinical and behavioral indicators among HIV-infected persons receiving medical care in the United States and will be used to describe comorbidities of persons infected with HIV, disease management, and the quality of care received. The data also will be used to identify gaps in services and allocate local HIV services and resources.
Acknowledgments
This report is based, in part, on contributions by MMP participants, facilities, community and provider advisory boards, and interviewers and abstractors. The MMP principal investigators and project coordinators include Karen Mark, MD, Tyler Arguello, PhD, California Department of Public Health, Sacramento, California; Nanette Benbow, MAS, Alexandra Gagner, MPH, Chicago Department of Public Health, Chicago, Illinois; Robert Vella, MPH, James Dowling, MPH, Delaware Health and Social Services, Dover, Delaware; Rebecca Grigg, PhD, Pam Fillmore, Florida Department of Health, Tallahassee, Florida; Jianglan White, MD Sarah Loch, MPH, Jennifer Taussig, MPH, Georgia Department of Public Health, Atlanta, Georgia; Adebowale Awosika-Olumo, MD, Salma Khuwaja, MD, DrPH, Houston Department of Health and Human Services, Houston, Texas; Cheryl Ward, MS, Marti Merritt, Illinois Department of Public Health, Chicago, Illinois; Daniel Hillman, MPH, Jodi Tobias, MPA, Indiana Department of Public Health, Indianapolis, Indiana; Amy Rock Wohl, PhD, Judy Tejero, MPH, Los Angeles County Department of Public Health, Los Angeles, California; Colin Flynn, ScM, Susan Russell Walters, DrPH, Maryland Department of Health & Mental Hygiene, Baltimore, Maryland; James Murphy, MPH, Laura Smock, MPH, Massachusetts Department of Public Health, Boston, Massachusetts; Eve D. Mokotoff, MPH, Meosia Lee-Turner; Michigan Department of Community Health, Detroit, Michigan; Leandro Mena, MD, Mauda Monger, MPH, Mississippi State Department of Health, Jackson, Mississippi; Barbara Bolden, PhD, Kidane Meshesha, MPH, New Jersey Department of Health and Senior Services, Trenton, New Jersey; Bridget J. Anderson, PhD, Lou Smith, MD, Michael D. Miele, New York State Department of Health, Albany, New York; Alan Neaigus, PhD, Christopher S. Murrill, PhD, Julie Lulek, MPH, New York City Department of Health and Mental Hygiene, New York City, New York; Delbert Williams, PhD, North Carolina Department of Health, Raleigh, North Carolina; Sean Schafer, MD, and Kari Greene, MPH, Oregon Public Health Division, Portland, Oregon; Benjamin Muthambi, DrPH, Leequan Ray, PhD, Pennsylvania Department of Health, Harrisburg, Pennsylvania; Kathleen A. Brady, MD, Michael G. Eberhart, MPH, Philadelphia Department of Public Health, Philadelphia, Pennsylvania; Sandra Miranda De León, MPH, Gladys Girona Lozada, MSc, Puerto Rico Department of Health, San Juan, Puerto Rico; Susan Scheer, PhD, Maree Kay Parisi, San Francisco Department of Public Health, San Francisco, California; Wayne Duffus, MD, PhD, Anand Nagarajan, MBBS, MPH, South Carolina Department of Health & Environmental Control, Columbia, South Carolina; Sharon K. Melville, MD, Sylvia Odem, MPH, Texas Department of State Health Services, Austin, Texas; Dena Bensen, MPH, Carmen Roman, Virginia Department of Health, Richmond, Virginia; Maria Courogen, MPH, Washington State Department of Health; and Elizabeth Barash, MPH, Public Health Seattle & King County, Seattle, Washington; and members of the MMP team, Division of HIV/AIDS Prevention, National Center for HIV/AIDS, Viral Hepatitis, STD and TB Prevention.
References
- CDC. Diagnoses of HIV infection and AIDS in the United States and dependent areas, 2009. HIV Surveillance Report, 2009: vol. 21. Atlanta, GA: CDC; 2011. Available at http://www.cdc.gov/hiv/surveillance/resources/reports/2009report/index.htm. Accessed June 10, 2011.
- Nakashima AK, Fleming PL. HIV/AIDS surveillance in the United States, 1981-2001. J Acquir Immune Defic Syndr 2003;32(Suppl 1): S68-S85.
- CDC. Clinical and behavioral characteristics of adults receiving medical care for HIV infection: Medical Monitoring Project, 2005 pilot data collection cycle. HIV Special Surveillance Report: no. 6. Atlanta, GA: CDC; 2010. Available at http://www.cdc.gov/hiv/topics/surveillance/resources/reports. Accessed June 10, 2011.
- Institute of Medicine. Measuring what matters: allocation, planning and quality assessment for the Ryan White CARE Act. Washington, DC: National Academies Press; 2004. Available at https://download.nap.edu/catalog.php?record_id=10855. Accessed June 10, 2011.
- McNaghten AD, Wolfe MI, Onorato I, et al. Improving the representativeness of behavioral and clinical surveillance for persons with HIV in the United States: the rationale for developing a population-based approach. PloS ONE 2007;2:e550.
- Palella FJ Jr, Delaney KM, Moorman AC, et al. Declining morbidity and mortality among patients with advanced human immunodeficiency virus infection. HIV Outpatient Study Investigators. N Engl J Med 1998;338:853-60.
- Donnell D, Baeten J, Kiarie J, et al. Heterosexual HIV-1 transmission after initiation of antiretroviral therapy: a prospective cohort analysis. Lancet 2010; 375:2092-8.
- White House Office of National AIDS Policy. National HIV/AIDS strategy for the United States. Washington, DC: The White House; 2010. Available at http://www.whitehouse.gov/sites/default/files/uploads/NHAS.pdf. Accessed June 10, 2011.
- Althoff KN, Gange SJ, Klein MB, et al. Late Presentation for human immunodeficiency virus care in the United States and Canada. Clin Infect Dis 2010;50:1512-20.
- Reed JB, Hanson D, McNaghten AD, et al. HIV testing factors associated with delayed entry into HIV medical care among HIV-infected persons from eighteen states, United States, 2000-2004. AIDS Patient Care STDs 2009;23:765-73.
- Turner BJ, Cunningham WE, Duan N, et al. Delayed medical care after diagnosis in a U.S. national probability sample of persons infected with human immunodeficiency virus. Arch Intern Med 2000;160:2614-22.
- Torian LV, Wiewel EW, Liu K, Sackoff JE, Frieden TR. Risk factors for delayed initiation of medical care after diagnosis of human immunodeficiency virus. Arch Intern Med 2008;168:1181-7.
- Fleming PL, Byers RH, Sweeney PA, Daniels D, Karon JM, Janssen RS. HIV prevalence in the United States [Abstract 11]. 9th Conference on Retroviruses and Opportunistic Infections. February 24-28, 2002; Seattle, WA.
- Samet JH, Freedberg KA, Savetsky JB, Sullivan LM, Stein MD. Understanding delay to medical care for HIV infection: the long-term non-presenter. AIDS 2001;15:77-85.
- Samet JH, Freedberg KA, Stein MD, et al. Trillion virion delay time from testing positive for HIV to presentation for primary care. Arch Intern Med 1998;158:734-40.
- Panel on Antiretroviral Guidelines for Adults and Adolescents. Guidelines for the use of antiretroviral agents in HIV-1-infected adults and adolescents. Washington, DC: US Department of Health and Human Services; 2011 Available at http://www.aidsinfo.nih.gov/contentfiles/adultandadolescentgl.pdf. Accessed June 10, 2011.
- Aberg JA, Kaplan JE, Libman H, et al. Primary care guidelines for the management of persons infected with human immunodeficiency virus: 2009 update by the HIV Medicine Association of the Infectious Diseases Society of America. Clin Infect Dis 2009;49:651-81.
- CDC. Incorporating HIV prevention into the medical care of persons living with HIV: recommendations of CDC, the Health Resources and Services Administration, the National Institutes of Health, and the HIV Medicine Association of the Infectious Diseases Society of America. MMWR 2003;52(No. RR-12).
- Fleming DT, Wasserheit JN. From epidemiological synergy to public health policy and practice: the contribution of other sexually transmitted diseases to sexual transmission of HIV infection. Sex Transm Infect 1999;75:3-17.
- Mannheimer SB, Morse E, Matts JP, et al. Sustained benefit from a long-term antiretroviral adherence intervention. Results of a large randomized clinical trial. J Acquir Immune Defic Syndr 2006;43(Suppl 1):S41-7.
- CDC. Guidelines for prevention and treatment of opportunistic infections in HIV-infected adults and adolescents. Recommendations from CDC, the National Institutes of Health, and the HIV Medicine Association of the Infectious Diseases Society of America. MMWR 2009;58(No. RR-4).
- Althoff KN, Anastos K, Nelson KE, et al. Predictors of reported influenza vaccination in HIV-infected women in the United States, 2006-2007 and 2007-2008 seasons. Prev Med 2010;50:223-9.
- Gallagher KM, Juhasz M, Harris NS, Teshale EH for the Adult and Adolescent Spectrum of HIV Disease Group. Predictors of influenza vaccination in HIV-infected patients in the United States, 1990-2002. J Infect Dis 2007;196:339-46.
- Durham MD, Buchacz K, Armon C, et al; the HOPS Investigators. Rates and correlates of influenza vaccination among HIV-infected adults in the HIV Outpatient Study (HOPS), USA, 1999-2008. Prev Med 2011. Epub May 4, 2011. Available at http://www.sciencedirect.com/science/article/pii/S009174351100168X. Accessed July 19, 2011.
- Katz MH, Cunningham WE, Fleishman JA, et al. Effect of case management on unmet needs and utilization of medical care and medications among HIV-infected persons. Ann Intern Med 135(8 Pt 1):557-65.
- Lo W, MacGovern T, Bradford J. Association of ancillary services with primary care utilization and retention for patients with HIV/AIDS. AIDS Care 2002;14(Suppl 1):S45-S57.
- Sherer R, Stieglitz K, Narra J, et al. HIV multidisciplinary teams work: Support services improve access to and retention in HIV primary care. AIDS Care 2002;14 (Suppl 1):S31-S44.
- Chin JJ, Botsko M, Behar E, Finkelstein R. More than ancillary: HIV social services, intermediate outcomes and quality of life. AIDS Care 2002;21:1289-97.
- Fisher JD, Smith LR, Lenz EM. Secondary prevention of HIV in the United States: past, current, and future perspectives. J Acquir Immune Defic Syndr 2010;55:S106-S15.
- Stein M, Herman DS, Trisvan E, Pirraglia P, Engler P, Anderson BJ. Alcohol use and sexual risk behavior among human immunodeficiency virus-positive persons. Alcohol Clin Exp Res 2005;29:837-43.
- Purcell DW, Parsons JT, Halkitis PN, Mizuno Y, Woods WJ. Substance use and sexual transmission risk behavior of HIV-positive men who have sex with men. J Subst Abuse 2001;13:185-200.
- Campsmith, ML, Nakashima AK, Jones JL. Association between crack cocaine use and high-risk sexual behaviors after HIV diagnosis. J Acquir Immune Defic Syndr 2000;25:192-8.
- Rondinelli AJ, Ouellet LJ, Strathdee SA, et al. Young adult injection drug users in the United States continue to practice HIV risk behaviors. Drug Alcohol Depend 2009;104:167-74.
- Celentano DD, Lucas G. Optimizing treatment outcomes in HIV-infected patients with substance abuse issues. Clin Infect Dis 2007;45(Suppl 4):S318-S323.
- Bruce RD, Altice FL. Clinical care of the HIV-infected drug user. Infect Dis Clin North Am 2007;21:149-79, ix.
- Nijhawan A, Kim S, Rich JD. Management of HIV infection in patients with substance use problems. Curr Infect Dis Rep 2008;10:432-8.
- Voluntary HIV-1 Counseling and Testing Efficacy Study Group. Efficacy of voluntary HIV-1 counselling and testing in individuals and couples in Kenya, Tanzania and Trinidad: a randomised trial. Lancet 2000;256:103-112.
- Marks G, Crepaz N, Senterfitt JW, Janssen RS. Meta-analysis of high-risk sexual behavior in persons aware and unaware they are infected with HIV in the United States: implications for HIV prevention programs. J Acquir Immune Defic Syndr 2005;39:446-53.
- CDC. Update: barrier protection against HIV infection and other sexually transmitted diseases. MMWR 1993;42:589-91.
- Weller S, Davis K. Condom effectiveness in reducing heterosexual HIV transmission. Cochrane Database Syst Rev 2002;1:CD003255.
- Varghese B, Maher JE, Peterman TA, Branson BM, Steketee RW. Reducing the risk of sexual HIV transmission: quantifying the per-act risk for HIV on the basis of choice of partner, sex act, and condom use. Sex Transm Dis 2002;29:38-43.
*Stewart B. McKinney Homeless Assistance Act, 42 U.S.C. §11301, et seq. 1987.
|
TABLE 2. (Continued) Number and percentage of participants, by selected characteristics --- Medical Monitoring Project, United States, 2007 |
||
|---|---|---|
|
Characteristic |
No.* |
(%)† |
|
Primary method of paying for prescription medications for HIV and related illnesses during past 12 mos¶¶ |
||
|
Medicaid/Medicare |
1,509 |
(41) |
|
Private health care coverage |
896 |
(25) |
|
AIDS Drug Assistance Program |
915 |
(25) |
|
Not taking any prescription medications for HIV or related illnesses |
187 |
(5) |
|
Paid for medications themselves (i.e., out of pocket) |
194 |
(5) |
|
Received medications from a public clinic |
88 |
(2) |
|
Received medications from an AIDS service organization |
50 |
(1) |
|
Participated in a clinical trial or research study that provided medications |
12 |
(<1) |
|
Applied for public assistance during past 12 mos |
||
|
Yes |
708 |
(19) |
|
No |
2,932 |
(81) |
|
Received any form of public assistance including SSI or SSDI during past 12 mos |
||
|
Yes |
1,798 |
(49) |
|
No |
1,843 |
(51) |
|
Primary source of money or financial support during |
||
|
SSI or SSDI |
1,463 |
(40) |
|
Salary or wages |
1,403 |
(39) |
|
Spouse, partner, or family |
244 |
(7) |
|
Public assistance |
211 |
(6) |
|
Pension or retirement fund |
81 |
(2) |
|
No income or financial support |
43 |
(1) |
|
Friends |
35 |
(1) |
|
Savings/investments |
28 |
(<1) |
|
Total |
3,643 |
(100) |
|
Abbreviations: AIDS = acquired immunodeficiency syndrome; HIV = human immunodeficiency virus; HMO = health maintenance organization; GED = general educational development; SSDI = Social Security Disability Insurance; SSI = Social Security Supplemental Income. * Numbers might not add to total because of missing data. Analyses limited to persons with diagnosis of HIV infection for at least 12 months before the interview. Values exclude categories with fewer than five responses, responses of "don't know," and skipped (missing) responses. † Percentages might not add to 100% because of rounding. § Participants were classified as transgender if sex at birth and gender reported by the participant were different or if the participant chose transgender in response to the question about self-identified gender. ¶ Hispanics or Latinos might be of any race. ** McKinney-Vento definition of homelessness: living on the street, in a shelter, a single-room-occupancy hotel, temporarily staying with friends or family, or living in a car. A person is categorized as homeless if that person lacks a fixed, regular, adequate night-time residence or has a steady night-time residence that is 1) a supervised publicly or privately operated shelter designed to provide temporary living accommodation, 2) an institution that provides a temporary residence for persons intended to be institutionalized, or 3) a public or private place not designed for or ordinarily used as a regular sleeping accommodation for human beings (e.g., in an automobile or under a bridge) (Stewart B. McKinney Homeless Assistance Act, 42 U.S.C. §11301, et seq; 1987). †† Among 3,040 participants who reported having health insurance or coverage during the past 12 months. Participants could select more than one response. §§ Includes Tricare/CHAMPUS, Veterans Administration coverage, and insurance classified as "other" health insurance. ¶¶ Participants could select more than one response. |
||
Alternate Text: This figure is a map of the United States showing the 26 project areas that were funded to conduct data collection activities for the 2007 Medical Monitoring Project data collection cycle: California; Chicago, Illinois; Delaware; Florida; Georgia; Houston, Texas; Illinois; Indiana; Los Angeles County, California; Maryland; Massachusetts; Michigan; Mississippi; New Jersey; the state of New York; New York City, New York; North Carolina; Oregon; Pennsylvania; Philadelphia, Pennsylvania; Puerto Rico; San Francisco, California; South Carolina; Texas; Virginia; and Washington.
FIGURE 2. Most recent self-reported CD4 T-lymphocyte count* among persons with HIV infection --- Medical Monitoring Project, United States, 2007
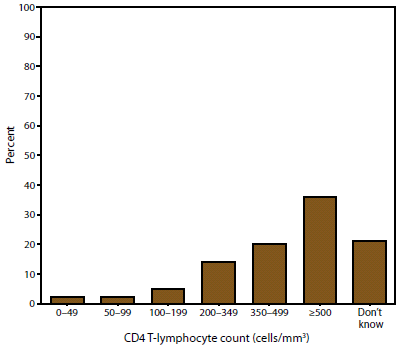
* N = 3,592. Among participants who reported having a CD4 T-lymphocyte test during the past 12 months; excludes refused, skipped, and missing responses.
Alternate Text: This figure is a bar chart showing the most recent self-reported CD4 T-lymphocyte count among persons with HIV infection according to the 2007 Medical Monitoring Project data collection cycle. The most recent CD4 count among 3,592 participants who reported having a CD4 T-lymphocyte test during the past 12 months was <200 cells/mm3 for 325 (9%) participants, 200-349 cells/mm3 for 508 (14%), 350-499 cells/mm3 for 700 (20%), ≥500 cells/mm3 for 1,305 (36%), and unknown for 754 (21%) participants Excludes refused, skipped, and missing responses.
FIGURE 3. Most recent self-reported HIV viral load* among persons with HIV infection --- Medical Monitoring Project, United States, 2007
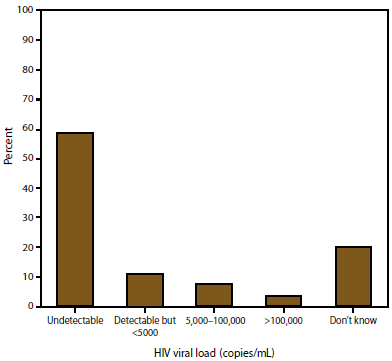
* N = 3,546. Among participants who reported having an HIV viral load test during the past 12 months; excludes refused, skipped, and missing responses.
Alternate Text: This figure is a bar chart showing the most recent self-reported HIV viral load among persons with HIV infection according to the 2007 Medical Monitoring Project data collection cycle. Among 3,546 participants who reported having an HIV viral load test during the past 12 months, the most recent viral load was undetectable for 2,064 (58%) participants; however, the viral load was unknown for 720 (20%). Excludes refused, skipped, and missing responses.
Use of trade names and commercial sources is for identification only and does not imply endorsement by the U.S. Department of Health and Human Services.
References to non-CDC sites on the Internet are provided as a service to MMWR readers and do not constitute or imply endorsement of these organizations or their programs by CDC or the U.S. Department of Health and Human Services. CDC is not responsible for the content of pages found at these sites. URL addresses listed in MMWR were current as of the date of publication.
All MMWR HTML versions of articles are electronic conversions from typeset documents. This conversion might result in character translation or format errors in the HTML version. Users are referred to the electronic PDF version (http://www.cdc.gov/mmwr)
and/or the original MMWR paper copy for printable versions of official text, figures, and tables. An original paper copy of this issue can be obtained from the Superintendent of Documents, U.S. Government Printing Office (GPO), Washington, DC 20402-9371;
telephone: (202) 512-1800. Contact GPO for current prices.
**Questions or messages regarding errors in formatting should be addressed to mmwrq@cdc.gov.
