Persons using assistive technology might not be able to fully access information in this file. For assistance, please send e-mail to: mmwrq@cdc.gov. Type 508 Accommodation and the title of the report in the subject line of e-mail.
Disparities in Diagnoses of HIV Infection Between Blacks/African Americans and Other Racial/Ethnic Populations --- 37 States, 2005--2008
Blacks/African Americans have been affected disproportionately by human immunodeficiency virus (HIV) infection since early in the epidemic (1). Despite representing a smaller proportion (13.6%) of the U.S. population, blacks/African Americans accounted for half of the HIV diagnoses in adolescents and adults in 37 states during 2005--2008 (2). Data from the National HIV Surveillance System were used to estimate numbers, percentages, and rates of HIV diagnoses in blacks/African Americans during 2005--2008. Those data were reported to CDC through June 2009 from 37 states with mature (in operation since at least January 2005) HIV surveillance systems. This report describes the results of those analyses, which indicated that during 2005--2008, blacks/African Americans were diagnosed with HIV infection more frequently than any other racial/ethnic population. During 2008, black/African American males and females were diagnosed with HIV infection at eight and 19 times the rates for white males and females and two and four times the rates for Hispanic/Latino males and females, respectively. In addition, the number of HIV diagnoses made each year among black/African American males increased during 2005--2008. The reduction of HIV-related health disparities has been identified as one of the three goals in the National HIV/AIDS Strategy (3). Reducing HIV risk behaviors and increasing access to testing and referral to health care can help eliminate disparities between blacks/African Americans and other racial/ethnic populations in the rates at which HIV infection is diagnosed.
HIV infection is notifiable in all 50 states, the District of Columbia, and six U.S. dependent areas. However, nationwide HIV surveillance with uniform reporting was not implemented fully until 2008.* For this analysis, data representing HIV diagnoses made during 2005--2008 (the latest data available) were drawn from 37 states† that have long-term, confidential HIV infection reporting. The numbers and percentages of HIV diagnoses during 2005--2008 among adults and adolescents were calculated by year of diagnosis, race/ethnicity,§ sex, age group, transmission category, and U.S Census region of residence.¶ To calculate annual rates of HIV diagnoses per 100,000 adults and adolescents in each racial/ethnic group, yearly population estimates were obtained for the 37 states from the U.S. Census Bureau. Trends in annual rates of HIV diagnoses were assessed by race/ethnicity and sex. Surveillance data were statistically adjusted for reporting delays and missing risk-factor information, but not for incomplete reporting (2).
During 2005--2008, blacks/African Americans accounted for 13.6% of the population in the 37 states and 50.3% of the 156,812 diagnoses of HIV infection during that period. Whites accounted for 67.9% of the population and 29.4% of diagnoses. Hispanics/Latinos accounted for 13.4% of the population and 17.8% of diagnoses (Table 1). Blacks/African Americans accounted for the largest percentage of HIV diagnoses in each age group. During 2005--2008, most (56.1%) HIV diagnoses were among persons aged 25--44 years; in this age group, blacks/African Americans accounted for 46.4% of HIV diagnoses. By region of residence, blacks/African Americans accounted for the majority of diagnoses in the South (55.7%).
Among adolescent and adult males, blacks/African Americans accounted for the largest percentage of diagnoses of HIV infection (44.8%) during 2005--2008 (Table 1). HIV transmissions in black/African American males were classified most frequently as male-to-male sexual contact (61.1%), followed by heterosexual contact (23.1%), injection drug use (IDU) (11.9%), and both male-to-male sexual contact and IDU (3.6%) (Table 2). Males aged 13--24 years accounted for the largest percentage (30.9%) of HIV diagnoses among black/African American males with infection attributed to male-to-male sexual contact, followed by males aged 25--34 years (28.7%) and 35--44 years (23.7%) (Table 2). Among adolescent and adult males, blacks/African Americans accounted for 50.1% of HIV diagnoses in the South and for the largest percentage (42.1%) of diagnoses in the Northeast (Table 1).
Among females, blacks/African Americans accounted for the largest percentage of diagnoses of HIV infection (65.9%) during 2005--2008 (Table 1). Most black/African American females diagnosed with HIV were exposed through heterosexual contact (85.2%), and the next greatest percentage by IDU (14.0%) (Table 2). Among black/African American females with infection attributed to heterosexual contact or to IDU, the largest percentages of diagnoses were in those aged 35--44 years (Table 2). Among females, blacks/African Americans accounted for the majority of HIV diagnoses in the South (70.9%), Midwest (60.9%), and Northeast (60.0%) (Table 1).
In 2008, among males and females of all racial/ethnic populations, black males had the highest HIV diagnosis rate (131.9 per 100,000). Trend analyses for 2005--2008 indicated that rates of HIV diagnoses increased among black/African American males (Figure). Trends in other race/ethnicity and sex groups were relatively stable (Figure).
Reported by
B Laffoon, A Satcher Johnson, MPH, S Cohen, MPH, X Hu, MS, RL Shouse, MD, Div of HIV/AIDS Prevention, National Center for HIV/AIDS, Viral Hepatitis, STD, and TB Prevention, CDC.
Editorial Note
During 2005--2008, HIV infection was diagnosed more often among black/African American men and women than among men and women of any other racial/ethnic population, with rates increasing among black/African American men. In nearly every demographic and transmission category, the largest percentages of HIV diagnoses were among blacks/African Americans, with the disparity most pronounced among persons aged 13--24 years, women, and persons with infection attributed to heterosexual contact. A recent study of estimated lifetime risk for diagnosis of HIV infection found that blacks/African Americans had the highest lifetime risk for receiving an HIV diagnosis (one in 22), compared with whites (one in 170) and Hispanics/Latinos (one in 52) (4). Correlations have been found between higher rates of HIV infection among blacks/African Americans and social and contextual factors such as disproportionately higher prevalence rates of other sexually transmitted infections and poverty. In addition, environmental factors such as housing conditions and social support are key drivers for infection. Comprehensive approaches to address disparities should take into account patient-specific behavioral risk factors, such as having multiple sex partners and unprotected sex, in addition to underlying factors, such as poverty, unequal access to health care, incarceration, lack of education, stigma, homophobia, sexism, and racism (5,6).
HIV testing is a key pillar of a comprehensive approach to reduce disparities in rates of HIV diagnoses. CDC recommends routine HIV screening in all health-care settings for persons aged 13--64 years (7). The higher rates of diagnoses among blacks/African Americans suggest that adolescents and adults from this population who are at higher risk for HIV infection might benefit from more frequent testing to facilitate earlier diagnosis. Persons infected with HIV who know their status can be referred to medical care and treatment that can improve the quality and length of their lives and to prevention services that can reduce the risk for further transmission (8).
Men who have sex with men (MSM) comprise the largest group of blacks/African Americans living with HIV in the United States (2). In a recent study of gay, bisexual, and other MSM who resided in 21 cities, 59% of black/African American MSM infected with HIV were unaware of their infection (9). Among MSM aged 18--29 years, HIV prevalence was highest among black/African American MSM (9). Black/African American gay, bisexual, and other MSM should be tested at least annually. Efforts to ensure annual HIV testing for black/African American MSM should be strengthened, and HIV testing and prevention programs should develop novel strategies to ensure routine and ongoing testing among young black/African American MSM. Strategies to reduce HIV infection and decrease the racial/ethnic disparities must include MSM as a high-priority population.
The findings in this report are subject to at least two limitations. First, the estimates of HIV diagnoses are from 37 states and thus do not represent all HIV diagnoses in the United States. HIV surveillance data from several high-morbidity areas (e.g., California, the District of Columbia, and Illinois) are not yet available; however, the racial/ethnic disparities described in this report are consistent with disparities observed among persons diagnosed with acquired immunodeficiency syndrome (AIDS) from all 50 states (2). Finally, the statistical adjustment procedures applied to HIV surveillance data to account for reporting delay are subject to a degree of uncertainty that might result in overestimation or underestimation of the rates (2). However, this uncertainty would be applied similarly across the various racial/ethnic categories and would not affect data for blacks/African Americans disproportionately.
The National HIV/AIDS Strategy emphasizes the importance of improving the effectiveness of HIV prevention efforts in the black/African American community and recommends that prevention efforts be aligned with the morbidity and disparity of HIV among blacks/African Americans and resources targeted appropriately (3). To address disparities in the prevalence and incidence of HIV infection, CDC conducts research and supports programs for HIV prevention among blacks/African Americans in the United States. These efforts include the Act Against AIDS communications campaign,** which addresses complacency, lack of knowledge, and misperceptions about HIV in the United States. In addition, in 2010, CDC announced a second 3-year expanded HIV testing program that supplements an initiative started in 2007 to increase HIV testing among blacks/African Americans.†† Ongoing and increased HIV testing and efforts to ensure referral and access to HIV-related primary medical care are warranted. Lack of knowledge of HIV status and missed opportunities to diagnose HIV in routine clinical settings (7) are contributing factors to the HIV epidemic among blacks/African Americans.
References
- CDC. Acquired immune deficiency syndrome (AIDS) among blacks and Hispanics---United States. MMWR 1986;35:655--66.
- CDC. Diagnoses of HIV infection and AIDS in the United States and dependent areas, 2008: HIV surveillance report, volume 20. Atlanta, GA: US Department of Health and Human Services, CDC; 2010. Available at http://www.cdc.gov/hiv/surveillance/resources/reports/2008report/index.htm. Accessed November 1, 2010.
- Office of National AIDS Policy. National HIV/AIDS strategy. Washington, DC: Office of National AIDS Policy; 2010. Available at http://www.whitehouse.gov/administration/eop/onap/nhas. Accessed November 1, 2010.
- CDC. Estimated lifetime risk for diagnosis of HIV Infection among Hispanics/Latinos---37 states and Puerto Rico, 2007. MMWR 2010;59:1297--301.
- Aral SO, Adimora AA, Fenton KA. Understanding and responding to HIV and other sexually transmitted infections in African Americans. Lancet 2008;372:337--40.
- CDC. Establishing a holistic framework to reduce inequities in HIV, viral hepatitis, STDs, and tuberculosis in the United States. External consultation meeting report. Atlanta, GA: US Department of Health and Human Services, CDC; 2009. Available at http://www.cdc.gov/socialdeterminants/docs/sdh-white-paper-2010.pdf. Accessed January 27, 2011.
- CDC. Vital Signs: HIV testing and diagnosis among adults---United States, 2001--2009. MMWR 2010;59:1550--5.
- Marks G, Crepaz N, Janssen RS. Estimating sexual transmission of HIV from persons who are unaware and aware that they are infected with the virus in the USA. AIDS 2006;20:1447--50.
- CDC. Prevalence and awareness of HIV infection among men who have sex with men---21 cities, United States, 2008. MMWR 2010;59:1201--7.
* Additional information is available at http://www.cdc.gov/hiv/surveillance/resources/reports/2008report/technicalnotes.htm.
† Alabama, Alaska, Arizona, Arkansas, Colorado, Connecticut, Florida, Georgia, Idaho, Indiana, Iowa, Kansas, Kentucky, Louisiana, Michigan, Minnesota, Mississippi, Missouri, Nebraska, New Hampshire, New Jersey, New Mexico, New York, Nevada, North Carolina, North Dakota, Ohio, Oklahoma, South Carolina, South Dakota, Tennessee, Texas, Utah, Virginia, West Virginia, Wisconsin, and Wyoming.
§ For ethnicity, persons are categorized as "Hispanic or Latino" or "not Hispanic or Latino." Persons categorized as Hispanic/Latino might be of any race and are referred to in this report as Hispanic/Latino. For race, persons are categorized as "American Indian/Alaska Native," "black/African American," "Asian," "Native Hawaiian or other Pacific Islander," "white," or "multiple races." Persons categorized by race are all non-Hispanic/Latino.
¶ Northeast: Connecticut, Maine, Massachusetts, New Hampshire, New Jersey, New York, Pennsylvania, Rhode Island, and Vermont; Midwest: Illinois, Indiana, Iowa, Kansas, Michigan, Minnesota, Missouri, Nebraska, North Dakota, Ohio, South Dakota, and Wisconsin; South: Alabama, Arkansas, Delaware, District of Columbia, Florida, Georgia, Kentucky, Louisiana, Maryland, Mississippi, North Carolina, Oklahoma, South Carolina, Tennessee, Texas, Virginia, and West Virginia; West: Alaska, Arizona, California, Colorado, Hawaii, Idaho, Montana, Nevada, New Mexico, Oregon, Utah, Washington, and Wyoming.
** Additional information is available at http://www.cdc.gov/hiv/aaa.
†† Additional information is available at http://www.nineandahalfminutes.org.
What is already known on this topic?
Blacks/African Americans have been affected disproportionately with human immunodeficiency virus (HIV) infection since early in the epidemic.
What is added by this report?
Disparities persist, with blacks/African Americans accounting for half of HIV diagnoses in adolescents and adults in 37 states during 2005--2008, despite representing a smaller proportion (13.6%) of the population.
What are the implications for public health practice?
Efforts to ensure annual HIV testing for black/African American gay, bisexual, and other men who have sex with men (MSM) and persons at high risk (e.g., multiple partners or unprotected sex) for infection should be strengthened. HIV testing and prevention programs should develop novel strategies to ensure routine and ongoing testing among young black/African American MSM.
FIGURE. Rates of diagnosis of human immunodeficiency virus (HIV) infection among persons aged ≥13 years, by year of diagnosis, race/ethnicity, and sex --- National HIV Surveillance System, 37 states, 2005--2008*
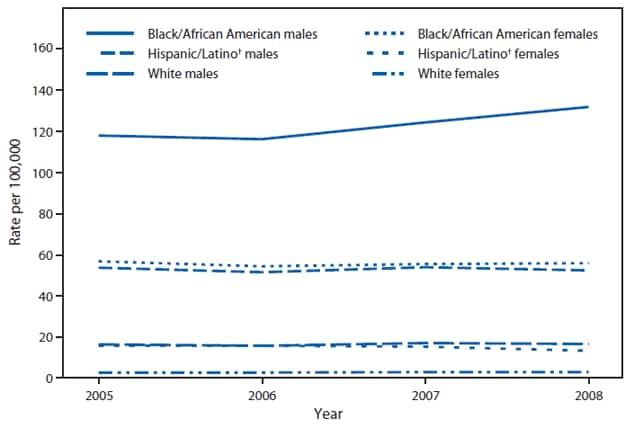
* Estimated numbers resulted from statistical adjustment that accounted for reporting delays, but not for incomplete reporting.
† Hispanics/Latinos might be of any race.
Alternate Text: The figure above shows rates of diagnosis of human immunodeficiency virus (HIV) infection among persons aged ≥13 years, by year of diagnosis, race/ethnicity, and sex in 37 states from 2005-2008. In 2008, among males and females of all racial/ethnic populations, black males had the highest HIV diagnosis rate (131.9 per 100,000). Trend analyses for 2005-2008 indicated that rates of HIV diagnoses increased among black/African American males.
Use of trade names and commercial sources is for identification only and does not imply endorsement by the U.S. Department of
Health and Human Services.
References to non-CDC sites on the Internet are
provided as a service to MMWR readers and do not constitute or imply
endorsement of these organizations or their programs by CDC or the U.S.
Department of Health and Human Services. CDC is not responsible for the content
of pages found at these sites. URL addresses listed in MMWR were current as of
the date of publication.
All MMWR HTML versions of articles are electronic conversions from typeset documents.
This conversion might result in character translation or format errors in the HTML version.
Users are referred to the electronic PDF version (http://www.cdc.gov/mmwr)
and/or the original MMWR paper copy for printable versions of official text, figures, and tables.
An original paper copy of this issue can be obtained from the Superintendent of Documents, U.S.
Government Printing Office (GPO), Washington, DC 20402-9371;
telephone: (202) 512-1800. Contact GPO for current prices.
**Questions or messages regarding errors in formatting should be addressed to
mmwrq@cdc.gov.
