|
TABLE 1. Incidence* of laboratory-confirmed bacterial and parasitic infections in 2009 and postdiarrheal hemolytic uremic syndrome (HUS) in 2008, by surveillance site and pathogen, compared with national health targets§ --- Foodborne Diseases Active Surveillance Network (FoodNet), United States, 2009† |
||||||||||||
|---|---|---|---|---|---|---|---|---|---|---|---|---|
|
Pathogen |
California |
Colorado |
Connecticut |
Georgia |
Maryland |
Minnesota |
New Mexico |
New York |
Oregon |
Tennessee |
Overall 2009 |
National health target§ |
|
Bacteria |
||||||||||||
|
Campylobacter |
29.37 |
14.09 |
15.25 |
7.58 |
8.34 |
17.24 |
16.88 |
11.33 |
18.63 |
8.22 |
13.02 |
12.30 |
|
Listeria |
0.45 |
0.25 |
0.74 |
0.31 |
0.25 |
0.06 |
0.15 |
0.61 |
0.50 |
0.24 |
0.34 |
0.24 |
|
Salmonella |
17.87 |
11.76 |
12.34 |
24.57 |
13.56 |
11.05 |
16.88 |
9.97 |
10.95 |
12.81 |
15.19 |
6.80 |
|
Shigella |
5.49 |
2.37 |
1.23 |
6.71 |
4.90 |
1.51 |
4.64 |
1.08 |
1.13 |
6.00 |
3.99 |
N/A¶ |
|
STEC** O157 |
1.15 |
2.29 |
1.26 |
0.20 |
0.43 |
2.49 |
0.45 |
0.66 |
1.74 |
0.61 |
0.99 |
1.00 |
|
STEC non-O157 |
0.12 |
1.46 |
0.63 |
0.31 |
0.57 |
1.21 |
1.21 |
0.38 |
0.29 |
0.35 |
0.57 |
N/A |
|
Vibrio |
0.60 |
0.33 |
0.77 |
0.28 |
0.53 |
0.17 |
0.05 |
0.26 |
0.47 |
0.13 |
0.35 |
N/A |
|
Yersinia |
0.33 |
0.15 |
0.63 |
0.36 |
0.18 |
0.25 |
0.10 |
0.30 |
0.45 |
0.37 |
0.32 |
N/A |
|
Parasites |
||||||||||||
|
Cryptosporidium |
1.66 |
1.64 |
1.11 |
3.26 |
0.71 |
6.65 |
7.36 |
1.62 |
5.01 |
1.26 |
2.86 |
N/A |
|
Cyclospora |
0.00 |
0.00 |
0.51 |
0.06 |
0.04 |
0.02 |
0.05 |
0.02 |
0.00 |
0.03 |
0.07 |
N/A |
|
HUS†† |
0.47 |
0.48 |
0.95 |
0.95 |
0.00 |
1.39 |
-- |
1.31 |
3.29 |
3.60 |
1.40 |
0.90 |
|
Surveillance population (millions) |
3.13 |
2.75 |
3.50 |
9.69 |
5.63 |
5.22 |
1.98 |
4.26 |
3.79 |
6.21 |
46.35 |
|
|
* Per 100,000 population. † Data for 2009 are preliminary. § Current Healthy People 2010 objective 10-1 targets for incidence of Campylobacter, Salmonella, Shiga toxin-producing Escherichia coli O157, and Listeria infections, and HUS. Available at http://www.healthypeople.gov/document/html/volume1/10food.htm. ¶ No national health objective exists for these pathogens. ** Shiga toxin-producing Escherichia coli. †† Incidence of postdiarrheal HUS in children aged <5 years; denominator is surveillance population aged <5 years in sites that conduct hospital discharge data review (New Mexico excluded). |
||||||||||||
Persons using assistive technology might not be able to fully access information in this file. For assistance, please send e-mail to: mmwrq@cdc.gov. Type 508 Accommodation and the title of the report in the subject line of e-mail.
Preliminary FoodNet Data on the Incidence of Infection with Pathogens Transmitted Commonly Through Food --- 10 States, 2009
The Foodborne Diseases Active Surveillance Network (FoodNet) of CDC's Emerging Infections Program conducts active, population-based surveillance in 10 U.S. states for all laboratory-confirmed infections with select enteric pathogens transmitted commonly through food (1). This report describes preliminary surveillance data for 2009 and trends in incidence since 1996. In 2009, a total of 17,468 laboratory-confirmed cases of infection were identified. In comparison with the first 3 years of surveillance (1996--1998), sustained declines in the reported incidence of infections caused by Campylobacter, Listeria, Salmonella, Shiga toxin-producing Escherichia coli (STEC) O157, Shigella, and Yersinia were observed. The incidence of Vibrio infection continued to increase. Compared with the preceding 3 years (2006--2008), significant decreases in the reported incidence of Shigella and STEC O157 infections were observed. For most infections, reported incidence was highest among children aged <4 years; the percentage of persons hospitalized and the case fatality rate (CFR) were highest among persons aged ≥50 years. In 2009, the Healthy People 2010 target of ≤1.0 case per 100,000 population for STEC O157 infection (objective 10-1b) was met (2). Further collaborative efforts with regulatory agencies and industry are needed to sustain and extend recent declines and to improve prevention of foodborne infections.
Surveillance Methods
FoodNet* is a collaborative program among CDC, 10 state health departments,† the U.S. Department of Agriculture's Food Safety and Inspection Service, and the Food and Drug Administration (FDA). It has conducted active, population-based surveillance for laboratory-confirmed cases of infection caused by Campylobacter, Listeria, Salmonella, STEC O157, Shigella, Vibrio, and Yersinia since 1996; Cryptosporidium and Cyclospora since 1997; and STEC non-O157 since 2000. FoodNet personnel regularly contact clinical laboratories to ascertain laboratory-confirmed cases of infection occurring within the surveillance sites (1). Hospitalizations occurring within 7 days of specimen collection date are recorded, as is the patient's status at hospital discharge or at 7 days after the specimen collection date if not hospitalized. Deaths and hospitalizations are attributed to the pathogen if they occur within 7 days of the specimen collection date, regardless of actual cause.
FoodNet also conducts surveillance for hemolytic uremic syndrome (HUS), a complication of STEC infection characterized by renal failure and microangiopathic hemolytic anemia, through a network of pediatric nephrologists and infection-control practitioners. Hospital discharge data are reviewed to validate HUS diagnoses and verify the presence of diarrhea in the 21 days before HUS onset. This report contains preliminary postdiarrheal HUS data for 2008, rather than for 2009, because additional time is needed to review hospital records (1).
Incidence rates for 2009 were calculated by dividing the number of laboratory-confirmed infections by U.S. Census Bureau population estimates for 2008. Final incidence rates will be reported when population estimates for 2009 are available. Case fatality rates (CFRs) were calculated by dividing the number of deaths by the number of laboratory-confirmed infections and multiplying by 100.
Surveillance Results
In 2009, a total of 17,468 laboratory-confirmed cases of infection were identified. The number of reported infections and incidence per 100,000 population, by pathogen, were as follows: Salmonella (7,039; 15.19), Campylobacter (6,033; 13.02), Shigella (1,849; 3.99), Cryptosporidium (1,325; 2.86), STEC O157 (459; 0.99), STEC non-O157 (264; 0.57), Vibrio (160; 0.35), Listeria (158; 0.34), Yersinia (150; 0.32), and Cyclospora (31; 0.07). Incidence varied among FoodNet sites (Table 1). Incidence was highest in children aged <4 years for Salmonella (72.93), Campylobacter (28.70), Shigella (16.61), Cryptosporidium (5.36), STEC O157 (3.84), STEC non-O157 (2.72), and Yersinia (2.36) infections, and in persons aged ≥50 years for Listeria (0.82), Vibrio (0.62), and Cyclospora (0.11) infections (Table 2).
The percentage of patients hospitalized ranged from 12.9% for Cyclospora infections to 89.2% for Listeria infections. The percentage hospitalized was highest among those aged ≥50 years for STEC O157 (59.4%), Salmonella (45.2%), Yersinia (43.2%), Vibrio (40.7%), STEC non-O157 (34.2%), Shigella (29.4%), Cyclospora (26.7%), Cryptosporidium (24.7%), and Campylobacter (21.3%) infections, and in children aged <4 years for Listeria (94.1%) infections. CFRs ranged from 0.05% for Shigella infections to 12.7% for Listeria infections. The CFR was highest in persons aged ≥50 years for Listeria (17.5%), Vibrio (8.1%), Yersinia (5.4%), STEC non-O157 (2.6%), STEC O157 (1.5%), Salmonella (1.2%), Cryptosporidium (1.1%), and Campylobacter (0.5%) infections. No deaths were reported for Cyclospora infections.
Among 6,371 (90.5%) Salmonella isolates serotyped, 10 serotypes accounted for 73.1% of infections: Enteritidis, 1,226 (19.2%); Typhimurium, 1,024 (16.1%); Newport, 772 (12.1%); Javiana, 544 (8.5%); Heidelberg, 230 (3.6%); Montevideo, 206 (3.2%); I 4,[5],12:i:-, 197 (3.1%); Muenchen, 170 (2.7%); Saintpaul, 157 (2.5%); and Oranienburg, 132 (2.1%).§ Among 154 (96.3%) Vibrio isolates with species information, 80 (52.0%) were parahaemolyticus, 22 (14.3%) were vulnificus, and 22 (14.3%) were alginolyticus . Among 264 STEC non-O157 isolates tested for O antigen, 235 (89.0%) had O antigen identified; the most common were O26 (28.9%), O103 (20.0%), and O111 (14.9%).
In 2008, FoodNet identified 64 cases of postdiarrheal HUS in persons aged <18 years (0.60 cases per 100,000). Among those, 42 (65.6%) occurred in children aged <5 years (1.40 cases per 100,000).
Comparison with Previous Years
A main effects, log-linear Poisson regression model (negative binomial) was used to estimate changes in incidence of infections in 2009 compared with previous years. This model accounts for site-to-site variation and changes in the size of the population under surveillance in FoodNet over time (1). The average annual incidence during 1) the first 3 years of surveillance (1996--1998) and 2) the preceding 3 years (2006--2008) were used for comparison. The estimated change in incidence between 2009 and the comparison periods was calculated with 95% confidence intervals (CI). For HUS surveillance, the average annual incidence for 2005--2007 was used as the comparison period. Changes over time were not evaluated for STEC non-O157 and Cyclospora.
In comparison with 1996--1998, rates of infection in 2009 were lower for Shigella (55% decrease, CI = 37%--68%), Yersinia (53% decrease, CI = 41%--63%), STEC O157 (41% decrease, CI = 27%--52%), Campylobacter (30% decrease, CI = 24%--35%), Listeria (26% decrease, CI = 8%--40%), and Salmonella (10% decrease CI = 3%--16%); rates were higher for Vibrio (85% increase, CI = 36%--150%). The incidence of infection with Cryptosporidium did not change significantly. The incidence of Vibrio infection has been increasing since approximately 2001 and the most marked decreases in Campylobacter, Listeria, and Salmonella infections occurred before 2004. The incidence of STEC O157 infection in 2009 was similar to that in 2004 (Figure 1). In comparison with 2006--2008, the rates of Shigella (27% decrease, CI = 4%--44%) and STEC O157 (25% decrease, CI = 10%--37%) infection were significantly lower (Figure 2).
The incidence of infections with specific Salmonella serotypes in 2009, compared with 1996--1998, was lower for Typhimurium (51% decrease, CI = 44%--56%), Agona (48% decrease, CI = 26%--63%), Heidelberg (33% decrease, CI = 13%--48%), and Thompson (33% decrease, CI = 2%--55%), and higher for Javiana (120% increase, CI = 44%--235%), Newport (64% increase, CI = 27%--113%), Oranienburg (39% increase, CI = 2%--90%), and Enteritidis (32% increase, CI = 8%--61%). Compared with 2006--2008, only Oranienburg (35% increase, CI = 6%--73%) and I 4,[5],12,i:- (42% decrease, CI = 18%--59%) were significantly different. The incidence of postdiarrheal HUS in children aged <5 years and in persons aged <18 years did not change significantly in 2008 compared with 2005--2007.
Reported by
B Matyas, MD, California Dept of Public Health. A Cronquist, MPH, Colorado Dept of Public Health and Environment. M Cartter, MD, Connecticut Dept of Public Health. M Tobin-D'Angelo, MD, Div of Public Health, Georgia Dept of Human Resources. D Blythe, MD, Maryland Dept of Health and Mental Hygiene. K Smith, DVM, Minnesota Dept of Health. S Lathrop, PhD, New Mexico Dept of Health. D Morse, MD, New York State Dept of Health. P Cieslak, MD, Oregon Public Health Div. J Dunn, DVM, Tennessee Dept of Health. KG Holt, DVM, Food Safety and Inspection Svc, US Dept of Agriculture. Center for Food Safety and Applied Nutrition, Food and Drug Admin. OL Henao, PhD, KE Fullerton, MPH, BE Mahon, MD, RM Hoekstra, PhD, PM Griffin, MD, RV Tauxe, MD, Div of Foodborne, Bacterial and Mycotic Diseases, National Center for Zoonotic, Vector-Borne and Enteric Diseases; Achuyt Bhattarai, MD, EIS Officer, CDC.
Editorial Note
FoodNet surveillance data for 2009 show reductions in the incidence of STEC O157 and Shigella infections, but little or no recent progress for other pathogens. Of the four infections with Healthy People 2010 targets (Campylobacter, Listeria, Salmonella, and STEC O157), only the target for STEC O157 was met in 2009. Salmonella infections declined slightly in 2009. A modest increase in the incidence of Listeria infection is a concern; however, the incidence of Listeria infection continues to be substantially lower than at the start of FoodNet surveillance in 1996. Continued increase in the incidence of Vibrio infection points to a need for improved prevention measures. Shigella is often transmitted directly from person-to-person, so food safety measures might not relate to the decrease in shigellosis.¶
To optimally prevent foodborne illness, the routes of exposure to these pathogens must be understood better so that additional targeted control measures can be developed, even as U.S. food consumption patterns and food industry processes evolve. FoodNet studies have demonstrated associations between illness and consumption of foods such as undercooked ground beef, chicken, and eggs (1). Recent outbreak investigations have identified novel food and nonfood vehicles, including jalapeno peppers (3), peanut butter--containing products (4), raw cookie dough (5), and direct contact with baby chicks, turtles, and African dwarf frogs (6--8).
Efforts to reduce contamination of meat, poultry, produce, and other foods are ongoing. Data from the U.S. Department of Agriculture's Food Safety and Inspection Service (FSIS) initiative to reduce Salmonella contamination of meat and poultry during processing show that fewer cultures of raw broiler chicken samples yielded Salmonella in 2009 (7.2%) than in 2006 (11.4%).** In addition, the percentage of broiler chicken slaughter establishments meeting FSIS's rigorous category 1 Salmonella contamination criteria increased from 49% in 2006 to 82% in 2009. Similarly, the recent decrease in STEC O157 infection might reflect, in part, control efforts in ground beef processing and produce growing practices. In 2009, the Food and Drug Administration issued a final regulation on egg safety†† and draft commodity-specific guidance for leafy greens, tomatoes, and melons§§ to help identify and implement measures to minimize the risk for microbial contamination throughout the supply chain.
FoodNet surveillance relies on isolation of the pathogen by culture of clinical specimens; therefore, changes in laboratory practices, such as increasing use of nonculture tests for STEC (9) and Campylobacter, might affect the reported incidence of infection. Monitoring of the use of such tests for STEC suggests that in 2009, the total number of STEC (O157 and non-O157) cases would not have been substantially greater than that reported (CDC, unpublished data, 2010). No data exist regarding the effect of nonculture-based Campylobacter testing.
The findings in this report are subject to at least two limitations. First, differences in health-care seeking behaviors among age groups, rather than true differences in the actual incidence of illness, can contribute to the observed differences between age groups (10). In addition, although the FoodNet population is similar demographically to the U.S. population, findings within FoodNet might not be representative of the entire U.S. population (1).
To reduce the incidence of foodborne infections further, multifaceted approaches involving public health, regulatory agencies, industry, and consumers are required. More detailed information on food safety issues and practices, including steps consumers can take to protect themselves, is available at http://www.foodsafetyworkinggroup.gov, http://www.foodsafety.gov, and http://www.fightbac.org.
References
- Scallan E. Activities, achievements, and lessons learned during the first 10 years of the Foodborne Diseases Active Surveillance Network: 1996--2005. Clin Infect Dis 2007;44:718--25.
- US Department of Health and Human Services. Food safety. Objective 10-1: reduce infections caused by key foodborne pathogens. Healthy People 2010 (conference ed, in 2 vols). Washington, DC: US Department of Health and Human Services; 2000. Available at http://www.healthypeople.gov/document/pdf/volume1/10food.pdf. Accessed April 8, 2010.
- CDC. Outbreak of Salmonella serotype Saintpaul infections associated with multiple raw produce items---United States, 2008. MMWR 2008;57:929--34.
- CDC. Multistate outbreak of Salmonella infections associated with peanut butter and peanut butter--containing products---United States, 2008--2009. MMWR 2009;58:85--90.
- CDC. Multistate outbreak of E. coli O157:H7 infections linked to eating raw refrigerated, prepackaged cookie dough. 2009 Available at http://www.cdc.gov/ecoli/2009/0807.html. Accessed April 8, 2010.
- CDC. Compendium of measures to prevent disease associated with animals in public settings, 2009: National Association of State Public Health Veterinarians, Inc. (NASPHV). MMWR 2009;58(No. RR-5).
- Harris JR, Bergmire-Sweat D, Schlegel JH, et al. Multistate outbreak of Salmonella infections associated with small turtle exposure, 2007--2008. Pediatrics 2009;124:1388--94.
- CDC. Multistate outbreak of human Salmonella Typhimurium infections associated with aquatic frogs---United States, 2009. MMWR 2010;58:1433--6.
- CDC. Recommendations for diagnosis of shiga toxin--producing Escherichia coli infections by clinical laboratories. MMWR 2009;58(No. RR-12).
- Scallan E, Jones TF, Cronquist A, et al. Factors associated with seeking medical care and submitting a stool sample in estimating the burden of foodborne illness. Foodborne Pathog Dis 2006;3:432--8.
* Additional information about FoodNet is available at http://www.cdc.gov/foodnet.
† In Connecticut, Georgia, Maryland, Minnesota, New Mexico, Oregon, Tennessee, and in selected counties in California, Colorado, and New York.
§ Additional data about hospitalizations, case-fatality rates for different age groups and Salmonella serotype trends are available at http://www.cdc.gov/foodnet/factsandfigures.htm.
¶ Additional information on causes of infection with these pathogens and recommended prevention measures, is available at http://www.cdc.gov/foodnet/mmwr/2010.
** Additional information about the Salmonella verification testing program for raw meat and poultry is available at http://www.fsis.usda.gov/science/microbiology/index.asp.
†† Additional information about the FDA egg safety regulation (Prevention of Salmonella Enteritidis in shell eggs during production, storage, and transportation; final rule -- July 9, 2009) is available at http://edocket.access.gpo.gov/2009/pdf/e9-16119.pdf.
§§ The 2009 FDA guides for industry to minimize microbial food safety hazards for leafy greens, tomatoes, and melons are available at http://www.fda.gov/food/guidancecomplianceregulatoryinformation/guidancedocuments/default.htm.
What is already known on this topic?
The incidence of foodborne illnesses has changed little in recent years; foodborne illness continues to be an important public health problem in the United States.
What is added by this report?
Preliminary surveillance data show that the Healthy People 2010 target for reduction of Shiga toxin--producing Escherichia coli O157 infection (≤1.0 case per 100,000 population) was met in 2009; for many pathogens under surveillance, reductions in incidence have occurred since the start of surveillance in 1996, but little or no additional progress has occurred in recent years.
What are the implications for public health practice?
To reduce the incidence of foodborne infections further, multifaceted approaches involving public health, regulatory agencies, industry, and consumers are required.
FIGURE 1. Relative rates of laboratory-confirmed infections with Campylobacter, STEC* O157, Listeria, Salmonella, and Vibrio compared with 1996--1998 rates, by year --- Foodborne Diseases Active Surveillance Network (FoodNet), United States, 1996--2009†
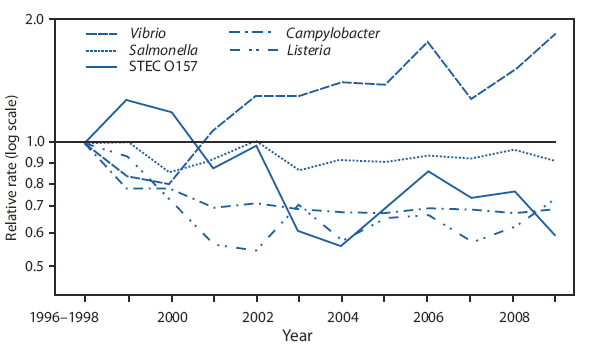
* Shiga toxin-producing Escherichia coli.
† The position of each line indicates the relative change in the incidence of that pathogen compared with 1996--1998. The absolute incidences of these infections cannot be determined from this graph. Data from 2009 are preliminary.
Alternate Text: The figure above shows relative rates of laboratory-confirmed infections with Campylobacter, STEC* O157, Listeria, Salmonella, and Vibrio compared with 1996-1998 rates, by year from the Foodborne Diseases Active Surveillance Network (FoodNet), for the United States during 1996-2009. In comparison with 1996-1998, rates of infection in 2009 were lower for Shigella (55% decrease, CI = 37%-68%), Yersinia (53% decrease, CI = 41%-63%), STEC O157 (41% decrease, CI = 27%-52%), Campylobacter (30% decrease, CI = 24%-35%), Listeria (26% decrease, CI = 8%-40%), and Salmonella (10% decrease CI = 3%-16%); rates were higher for Vibrio (85% increase, CI = 36%-150%). The incidence of infection with Cryptosporidium did not change significantly. The incidence of Vibrio infection has been increasing since approximately 2001 and the most marked decreases in Campylobacter, Listeria, and Salmonella infections occurred before 2004. The incidence of STEC O157 infection in 2009 was similar to that in 2004.
FIGURE 2. Percent change in incidence of laboratory-confirmed bacterial and parasitic infections in 2009* compared with average annual incidence during 2006--2008, by pathogen --- Foodborne Diseases Active Surveillance Network (FoodNet), United States
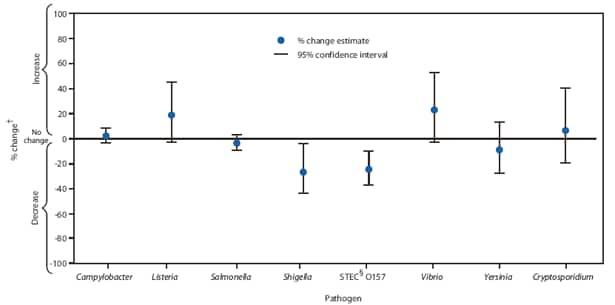
* Data for 2009 are preliminary.
† No significant change = 95% confidence interval is both above and below the no change line; significant increase = estimate and entire 95% confidence interval are above the no change line; significant decrease = estimate and entire 95% confidence interval are below the no change line.
§ Shiga toxin-producing Escherichia coli.
Alternate Text: The figure above shows the percent change in incidence of laboratory-confirmed bacterial and parasitic infections in 2009 compared with average annual incidence during 2006-2008, by pathogen in the United States, from Foodborne Diseases Active Surveillance Network (FoodNet) data. In comparison with 2006-2008, the rates of Shigella (27% decrease, CI = 4%-44%) and STEC O157 (25% decrease, CI = 10%-37%) infection were significantly lower.
Use of trade names and commercial sources is for identification only and does not imply endorsement by the U.S. Department of
Health and Human Services.
References to non-CDC sites on the Internet are
provided as a service to MMWR readers and do not constitute or imply
endorsement of these organizations or their programs by CDC or the U.S.
Department of Health and Human Services. CDC is not responsible for the content
of pages found at these sites. URL addresses listed in MMWR were current as of
the date of publication.
All MMWR HTML versions of articles are electronic conversions from typeset documents.
This conversion might result in character translation or format errors in the HTML version.
Users are referred to the electronic PDF version (http://www.cdc.gov/mmwr)
and/or the original MMWR paper copy for printable versions of official text, figures, and tables.
An original paper copy of this issue can be obtained from the Superintendent of Documents, U.S.
Government Printing Office (GPO), Washington, DC 20402-9371;
telephone: (202) 512-1800. Contact GPO for current prices.
**Questions or messages regarding errors in formatting should be addressed to
mmwrq@cdc.gov.
