ABCs 2020 Data and Impacts of COVID-19
Use Bact Facts Interactive Data Dashboard to view final data from 2020 and years prior.
Each year CDC releases Active Bacterial Core surveillance (ABCs) data describing the burden and epidemiology of invasive disease due to group A Streptococcus, group B Streptococcus, Haemophilus influenzae, Neisseria meningitidis, and Streptococcus pneumoniae. This year CDC is releasing 2020 ABCs data along with summary statistics comparing ABCs pathogen-specific incidence rates during the pandemic period of March to December 2020 to the rates during the pre-pandemic period from January 2014 to February 2020*, along with interpretations of how pandemic-related factors may have impacted ABCs pathogen disease burden.
*Neisseria meningitidis was not included in this commentary due to small numbers of reported cases.
Key findings from 2020 ABCs surveillance data
In 2020, CDC observed historic decreases in the invasive bacterial disease burden caused by pathogens monitored by ABCs.
The COVID-19 pandemic and the associated mitigation measures implemented early in the pandemic, likely played a role in these decreases.
| Changes in overall incidence of invasive bacterial infections during 10-month pandemic period (March–December 2020) ** | ||
|---|---|---|
| Pathogen | % | 95% credible interval |
| Group A Streptococcus | -28% | (-11% to -40%) |
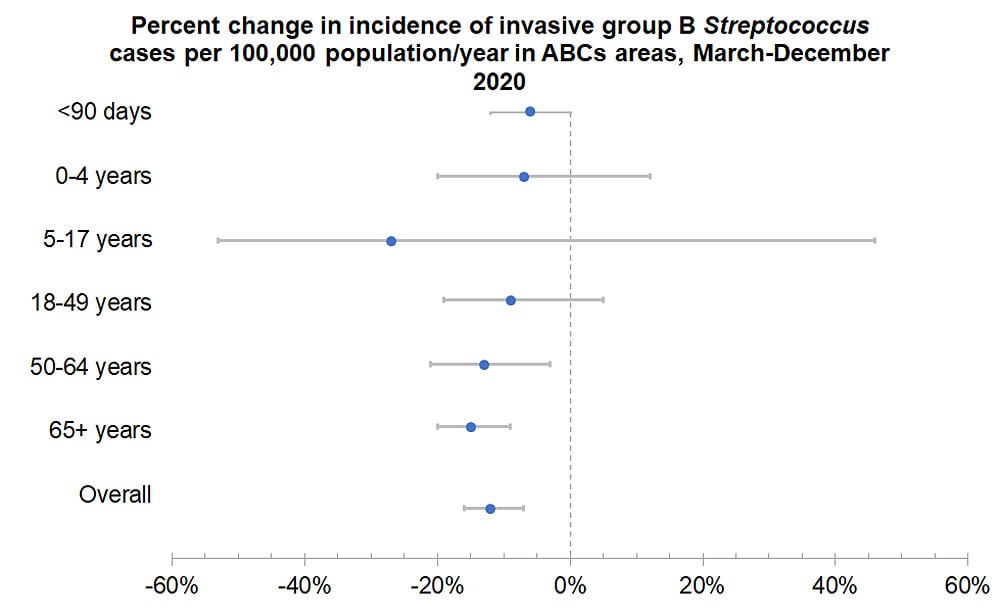
| Group B Streptococcus | -12% | (-7% to -16%) |
| Haemophilus influenzae | -60% | (-50% to -67%) |
| Streptococcus pneumoniae | -58% | (-52% to -62%) |
**All ages
Methods for estimating changes during the pandemic period
CDC defined the COVID-19 pandemic period of 2020 as March–December, based on when SARS-CoV-2 was recognized to have widespread circulation in the United States, and non-pharmaceutical interventions (e.g., social distancing resulting from remote work and school arrangements, mask wearing) were put in place. CDC used interrupted time series analysis through Autoregressive Integrated Moving Average models fit to monthly incidence rates between January 2014–February 2020 to generate predicted pathogen-specific monthly incidence rates for March–December 2020. The predicted rates were compared to observed rates using incidence rate ratios (IRR) and 95% credible intervals (CIs) for the pandemic period. IRRs and CIs are reported as percentage change (1-IRR).
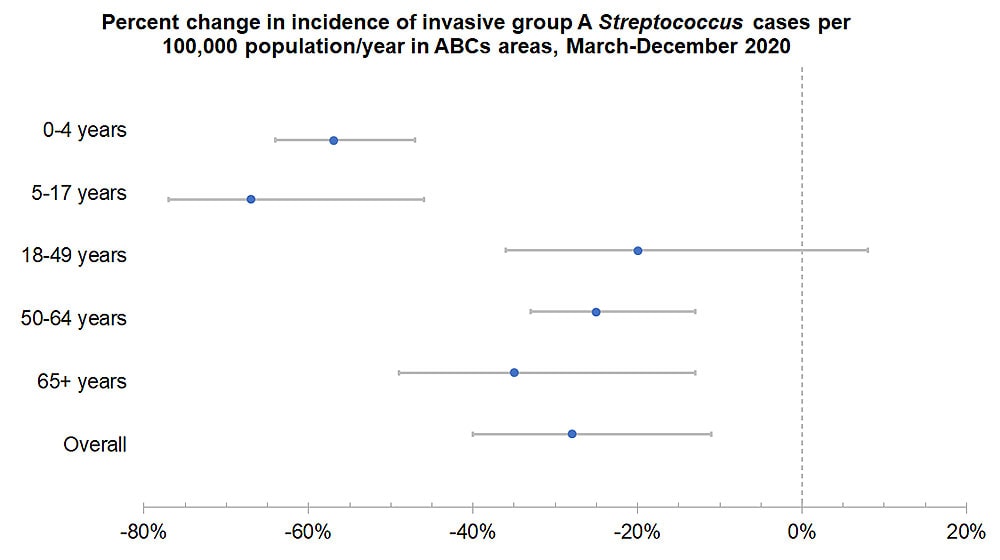
- After increasing each year since 2012, overall invasive GAS annual incidence decreased from 7.6 cases per 100,000 population in 2019 () to 6.1 in 2020 (); the lowest annual rate since 2016.
- Monthly invasive GAS rates were 28% lower than predicted during the pandemic period (IRR 0.72, 95% CI 0.60–0.89). The percentage change was greatest for children ages 5–17 years (65% lower than predicted, 95% CI 50–74%). Among adults, the greatest declines were in those aged ≥65 years (37% lower, 95% CI 12–51%).
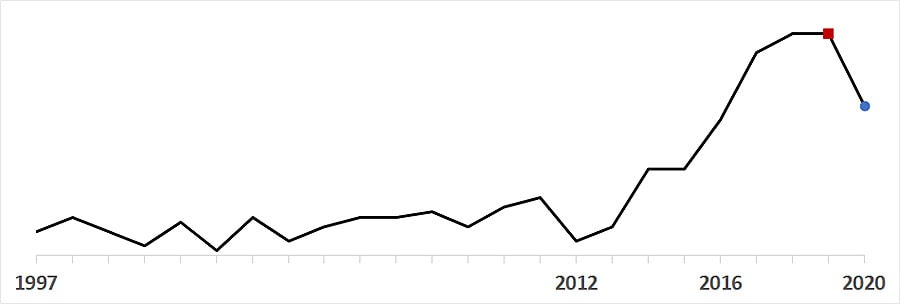
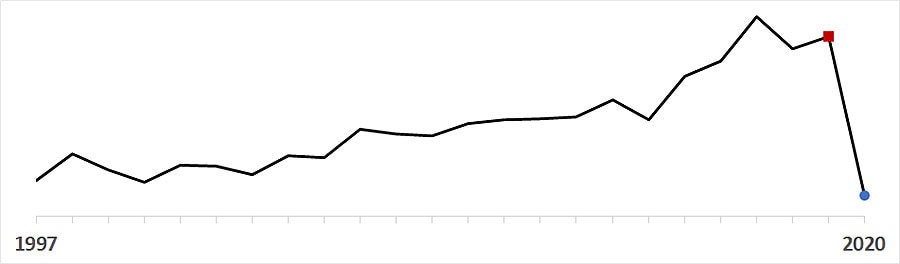
- After increasing each year since 2014, overall invasive GBS annual incidence decreased from 9.9 cases per 100,000 population in 2019 () to 9.0 in 2020 (); the lowest annual rate since 2015.
- Monthly invasive GBS rates were 12% lower than predicted during the pandemic period (IRR 0.88, 95% CI 0.84–0.93). No significant changes were observed for persons <50 years old, including invasive GBS disease among infants <90 days old.
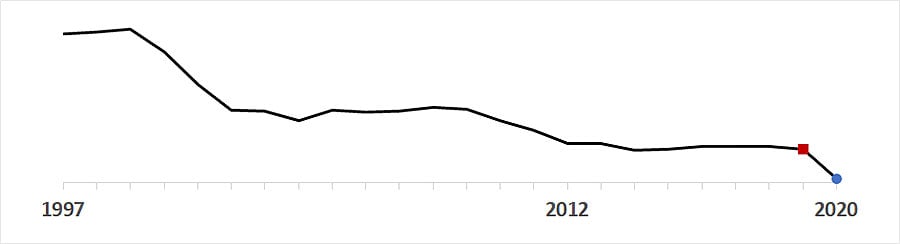
- Overall invasive HFlu annual incidence dropped from 2.2 cases per 100,000 population in 2019 () to 1.1 in 2020 (); the lowest annual incidence recorded since ABCs began in 1997.
- Monthly invasive HFlu rates were 60% lower than predicted during the pandemic period (IRR 0.40, 95% CI 0.33–0.50). The percentage change was greatest for children aged 0–4 years (76% lower, 95% CI 70–80%).

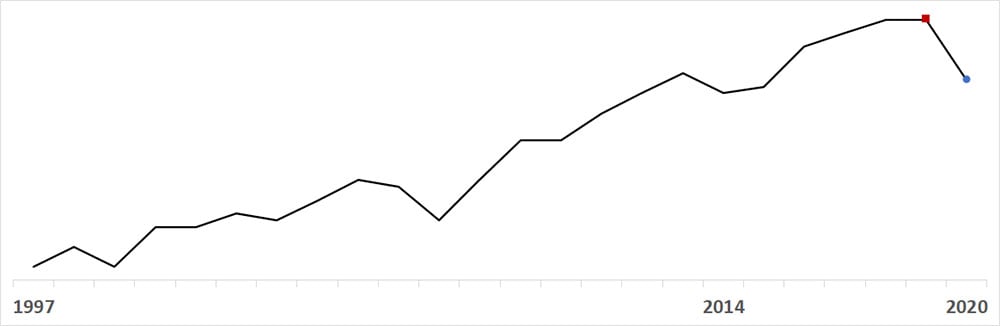
- After fluctuating between 9.1 and 9.9 from 2012 through 2018, overall invasive SPN annual incidence dropped from 9.2 cases per 100,000 population in 2019 () to 5.4 in 2020 ().
- Monthly SPN rates were 58% lower than predicted during the pandemic period (IRR 0.42, 95% CI 0.38–0.48). The percentage change was greatest for children ages 5–17 years (83% lower than predicted, 95% CI 77–86%). Among adults, the greatest declines were in those aged ≥65 years (68% lower, 95% CI 63–71%).