Data Visualization: Rabies – A Forgotten Killer
Data Visualization: Common carriers of rabies by location in the US.
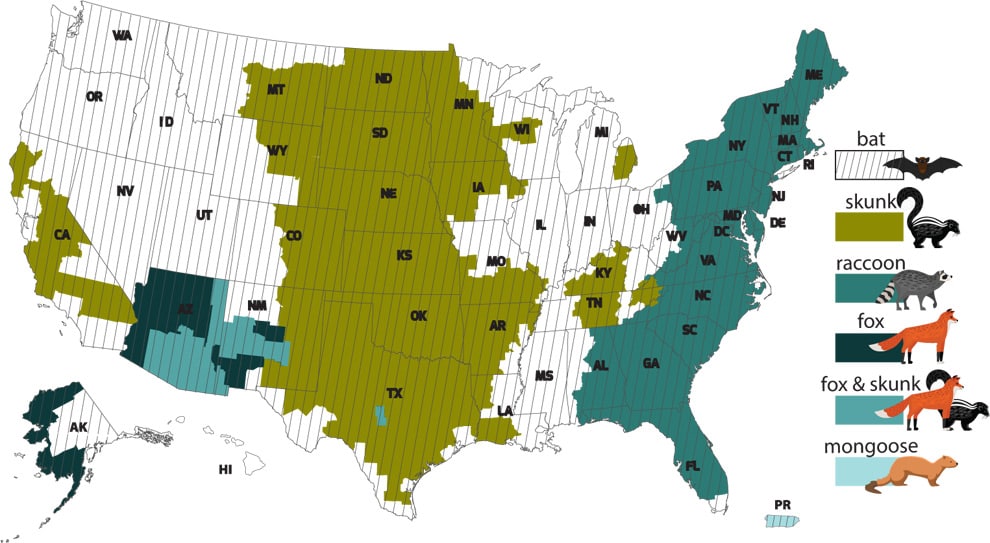
SOURCE: US National Rabies Surveillance System.
Bats with rabies have been found in every state except for Hawaii. Skunks with rabies have been found in parts of California, the Midwest, Texas, Kentucky, Virginia, North Carolina, and Tennessee. Raccoons with rabies have been found in the South and Eastern states. Foxes with rabies have been found in Alaska, Arizona, and New Mexico. Foxes and skunks with rabies have been found in Arizona, New Mexico, and Texas. Mongoose with rabies have been found in Puerto Rico.
Data Visualization: Then & Now: Changes in Rabid Animals Reported
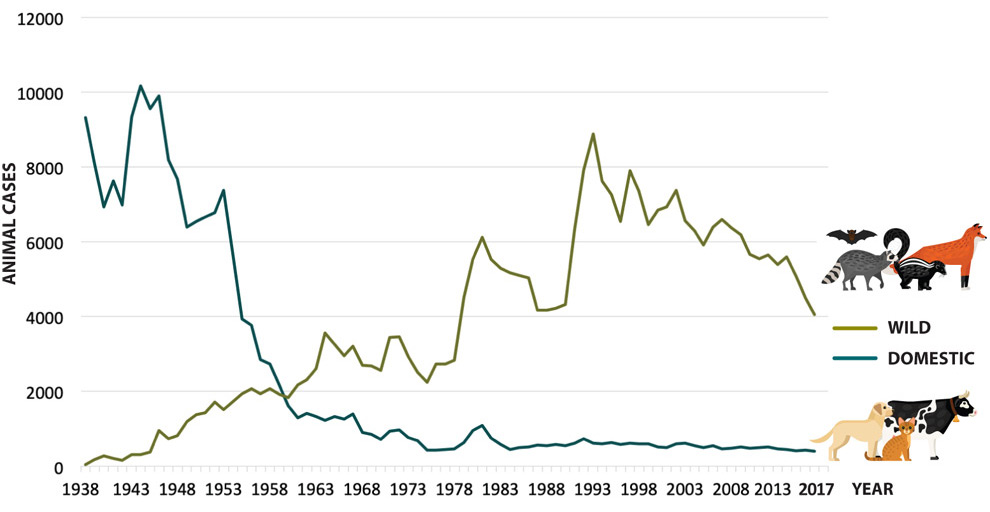
In 1938, most cases of rabid animals reported were domestic (9,321) and some were wild (44). Since then, the numbers have reversed. In 2017, 399 cases of rabid animals reported were domestic and 4,055 were wild.
| Year | Domestic (No.) | Wild (No.) |
|---|---|---|
| 1938 | 9,321 | 44 |
| 1939 | 8,117 | 167 |
| 1940 | 6,938 | 272 |
| 1941 | 7,636 | 211 |
| 1942 | 6,984 | 153 |
| 1943 | 9,339 | 310 |
| 1944 | 10,177 | 310 |
| 1945 | 9,557 | 371 |
| 1946 | 9,896 | 954 |
| 1947 | 8,192 | 728 |
| 1948 | 7,676 | 819 |
| 1949 | 6,395 | 1,192 |
| 1950 | 6,547 | 1,383 |
| 1951 | 6,656 | 1,428 |
| 1952 | 6,785 | 1,717 |
| 1953 | 7,373 | 1,511 |
| 1954 | 5,614 | 1,725 |
| 1955 | 3,938 | 1,932 |
| 1956 | 3,757 | 2,079 |
| 1957 | 2,854 | 1,942 |
| 1958 | 2,733 | 2,075 |
| 1959 | 2,162 | 1,919 |
| 1960 | 1,619 | 1,836 |
| 1961 | 1,293 | 2,174 |
| 1962 | 1,411 | 2,315 |
| 1963 | 1,318 | 2,614 |
| 1964 | 1,223 | 3,560 |
| 1965 | 1,326 | 3,257 |
| 1966 | 1,251 | 2,946 |
| 1967 | 1,396 | 3,210 |
| 1968 | 910 | 2,702 |
| 1969 | 849 | 2,673 |
| 1970 | 719 | 2,554 |
| 1971 | 939 | 3,451 |
| 1972 | 963 | 3,462 |
| 1973 | 767 | 2,930 |
| 1974 | 683 | 2,517 |
| 1975 | 433 | 2,241 |
| 1976 | 420 | 2,724 |
| 1977 | 445 | 2,736 |
| 1978 | 469 | 2,825 |
| 1979 | 636 | 4,509 |
| 1980 | 960 | 5,521 |
| 1981 | 1,082 | 6,126 |
| 1982 | 743 | 5,535 |
| 1983 | 584 | 5,294 |
| 1984 | 453 | 5,173 |
| 1985 | 503 | 5,103 |
| 1986 | 516 | 5,035 |
| 1987 | 559 | 4,169 |
| 1988 | 550 | 4,174 |
| 1989 | 584 | 4,224 |
| 1990 | 553 | 4,327 |
| 1991 | 618 | 6,354 |
| 1992 | 732 | 7,912 |
| 1993 | 606 | 8,889 |
| 1994 | 592 | 7,632 |
| 1995 | 630 | 7,247 |
| 1996 | 574 | 6,550 |
| 1997 | 610 | 7,899 |
| 1998 | 603 | 7,358 |
| 1999 | 601 | 6,466 |
| 2000 | 509 | 6,855 |
| 2001 | 497 | 6,939 |
| 2002 | 592 | 7,375 |
| 2003 | 614 | 6,556 |
| 2004 | 544 | 6,292 |
| 2005 | 494 | 5,923 |
| 2006 | 547 | 6,393 |
| 2007 | 469 | 6,590 |
| 2008 | 471 | 6,370 |
| 2009 | 505 | 6,185 |
| 2010 | 487 | 5,666 |
| 2011 | 495 | 5,536 |
| 2012 | 517 | 5,644 |
| 2013 | 467 | 5,400 |
| 2014 | 445 | 5,588 |
| 2015 | 419 | 5,089 |
| 2016 | 423 | 4,487 |
| 2017 | 399 | 4,055 |
| 1938-2017 Total | 189,264 | 308,409 |
For More Information
1-800-CDC-INFO (232-4636)
TTY: 1-888-232-6348
Web: www.cdc.gov
Centers for Disease Control and Prevention
1600 Clifton Road NE
Atlanta, GA 30333
Publication date: June 12, 2019