


What to know
- The Vision and Eye Health Surveillance System (VEHSS) produces CDC's primary estimates of the prevalence of vision loss and blindness in the United States.
- VEHSS used a statistical model to combine multiple sources of data available in VEHSS along with census data to produce these estimates.
- Three categories of vision loss are presented: presenting visual acuity loss, best corrected visual acuity loss, and uncorrected refractive error.
Vision loss and blindness modeled estimates at a glance*
- In 2024, an estimated 32.17 million people in the United States of all ages had any presenting visual acuity loss (prevalence: 9.46%), meaning that they could not see clearly even when wearing their usual eyeglasses or contact lenses (i.e., visual acuity tested as 20/32 or worse in their better-seeing eye).
- Of these people, 25.02 million had uncorrected refractive error (URE), meaning that they could improve their vision by wearing proper eyeglasses or contact lenses (prevalence: 7.36%).
- In addition, 7.15 million people had best corrected visual acuity loss (prevalence: 2.10%), meaning that they could not improve their vision with eyeglasses or contact lenses alone. Of these, over 700,000 are categorized as blind based on their having visual acuity of 20/200 or worse.
- More than 3 million children in the United States had presenting visual acuity loss.
- Over 1.54 million people with presenting visual acuity loss were residing in nursing homes (1.06 million) and correctional institutions (nearly 500,000).
- The prevalence of presenting visual acuity loss was higher in some populations, including those living in poverty (13.68%), aged 15+ years with less than a high school education (12.79%), and living in nursing facilities (61.49%) and correctional facilities (21.54%).
*Note: Some numbers do not sum due to rounding.
Vision loss categories
Estimates are presented for three categories of visual acuity: presenting visual acuity loss, uncorrected refractive error, and best corrected visual acuity loss. Each is based on measured visual acuity in the better-seeing eye. These estimates do not account for other types of vision loss, such as contrast sensitivity or visual field loss.
Presenting Visual Acuity Loss
Presenting visual acuity loss represents suboptimal visual acuity measured when a person is wearing their usual eyewear, such as eyeglasses or contact lenses. VEHSS modeled estimates of presenting visual acuity loss include anyone with presenting visual acuity in their better-seeing eye of 20/32 or worse. Presenting visual acuity loss is equal to the sum of best corrected visual acuity loss and uncorrected refractive error described below.
Uncorrected Refractive Error (URE)
Uncorrected refractive error represents the visual acuity loss due to improper refraction. This is vision loss that can be corrected with proper eyeglasses or contact lenses. URE is a subset of presenting visual acuity loss.
The VEHSS modeled estimate of URE refers to anyone who has presenting visual acuity loss of 20/32 or worse that can improve to 20/20 or better with refraction.
Best Corrected Visual Acuity (BCVA) Loss
BCVA loss, also called uncorrectable vision loss, represents visual acuity deficits measured when using the best available refraction correction, using a refractor, autorefractor, or eyeglass/contact lenses with optimal prescriptions. BCVA is a subset of presenting visual acuity loss and is vision loss that cannot be corrected with eyeglasses or contact lenses alone.
VEHSS modeled estimates of BCVA include two mutually exclusive levels:
- Impairment: Visual acuity of 20/32 to >20/200
- Blindness: Visual acuity of ≤20/200
Tables and figures
Figure 1. Number of People of All Ages in the United States by Category of Vision Loss, 2024
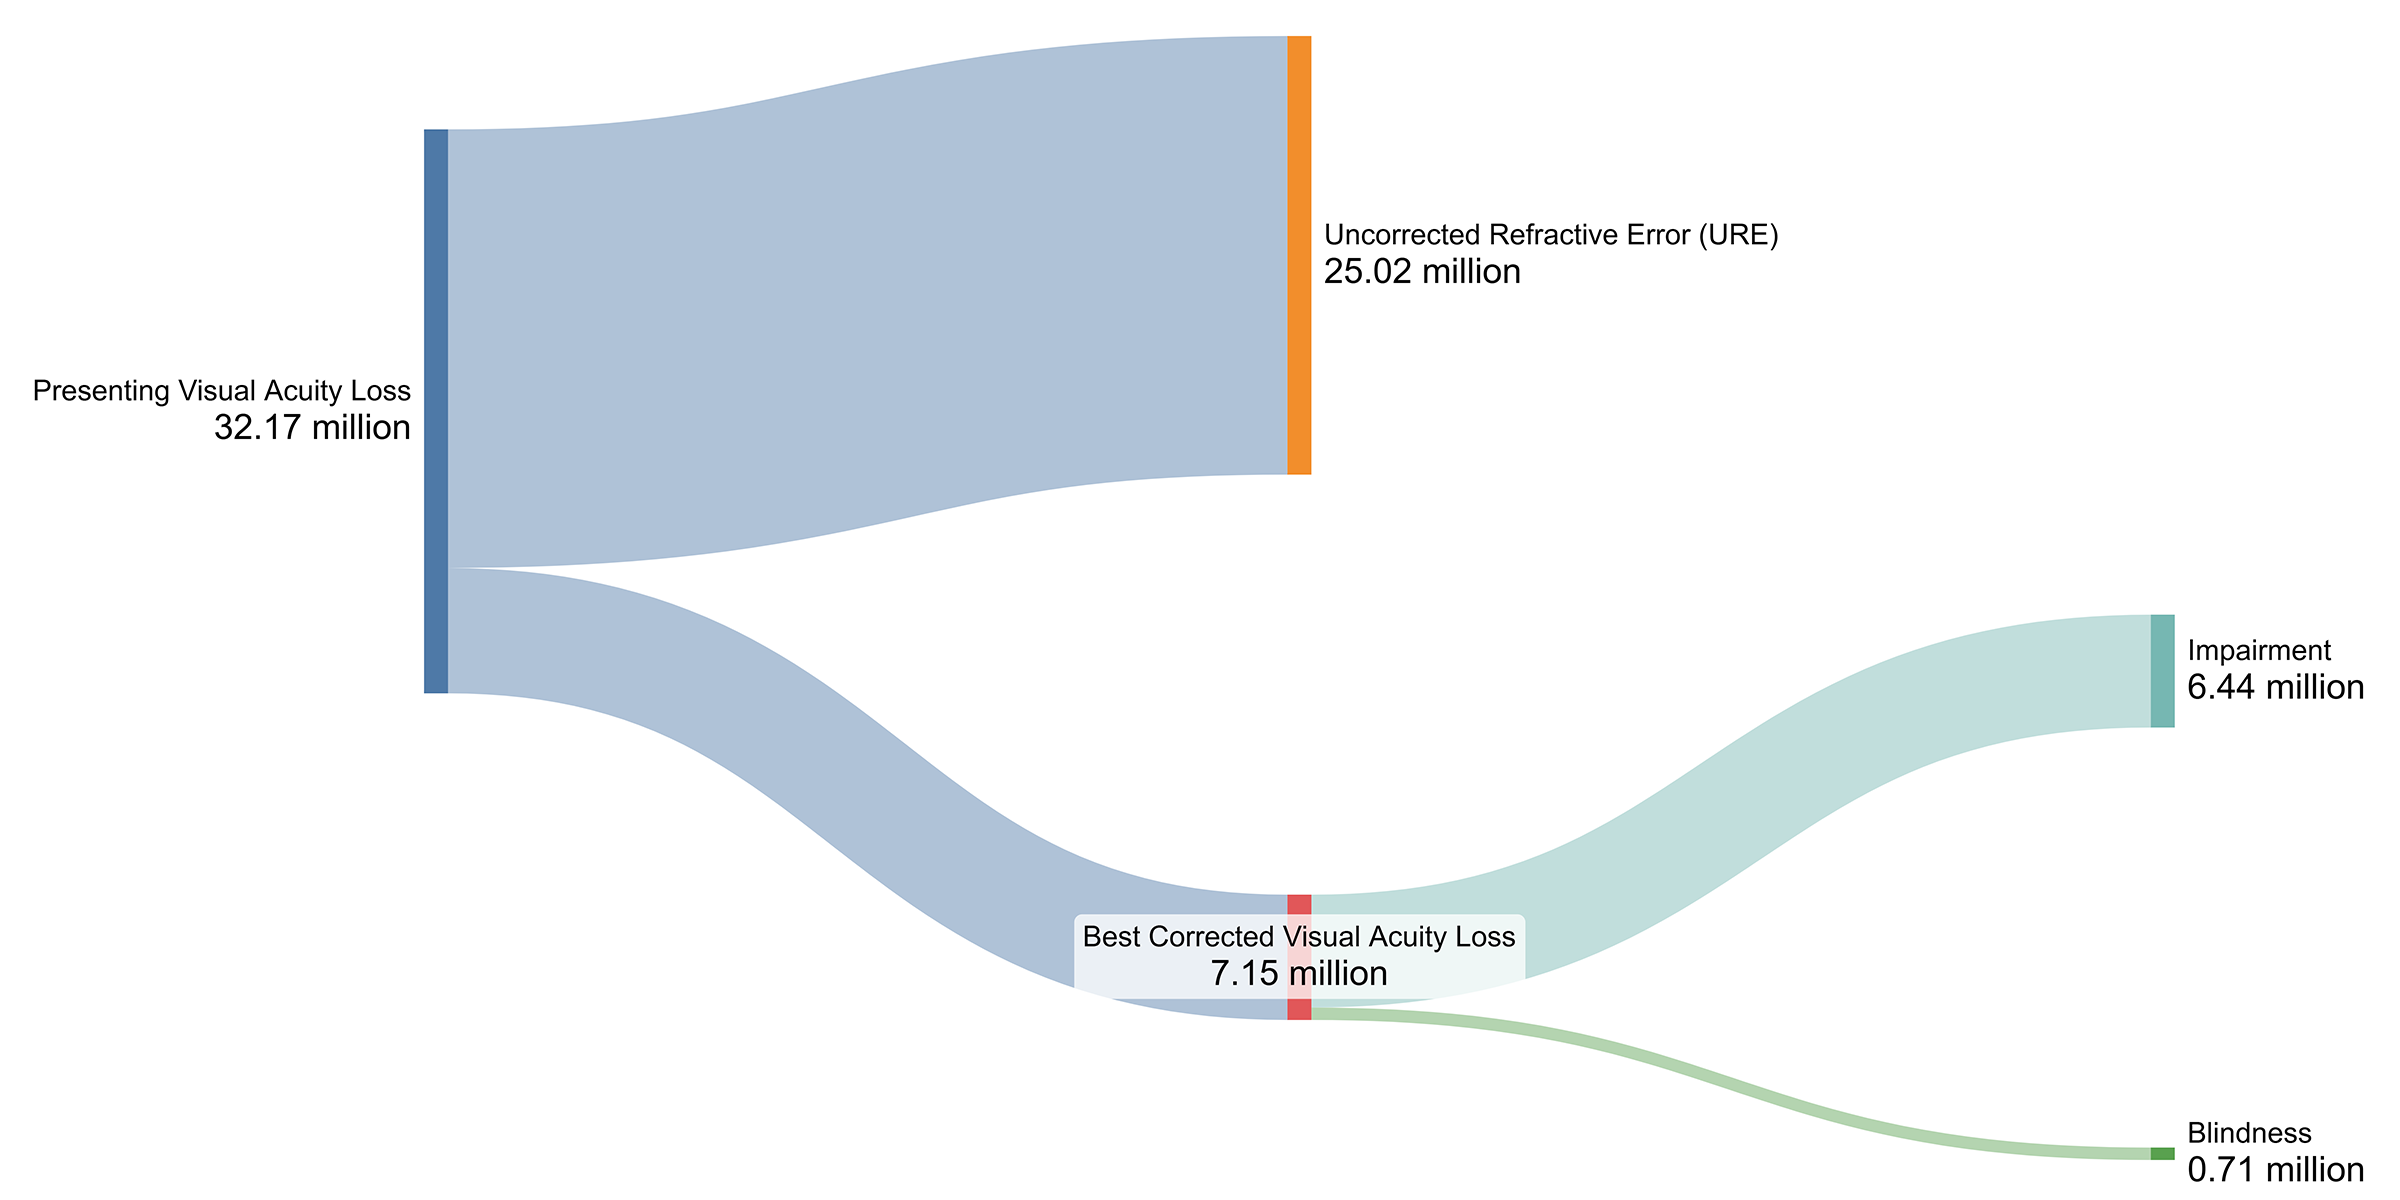
The total number of people with presenting visual acuity loss of 32.17 million comprises uncorrected refractive error (25.02 million) plus best corrected visual acuity loss (7.15 million), which in turn comprises impairment (6.44 million) and blindness (0.71 million).
Figure 2. Percentage of People of All Ages in the United States by Age Group and Category of Vision Loss, 2024
Table 1. Percentage of People in the United States With Best Corrected Visual Acuity Loss, by Sociodemographic Characteristics, 2024 (95% Uncertainty Interval)*
| Best Corrected Visual Acuity Loss | |||
|---|---|---|---|
| Impairment (20/32 to >20/200) |
Blindness (20/200 or worse) |
Any BCVA Loss (20/32 or worse) |
|
| Overall National | 1.89% (1.70%-2.09%) | 0.21% (0.16%-0.26%) | 2.10% (1.92%-2.29%) |
| Sex | |||
| Female | 2.07% (1.80%-2.32%) | 0.22% (0.17%-0.28%) | 2.28% (2.04%-2.53%) |
| Male | 1.72% (1.51%-1.95%) | 0.20% (0.15%-0.26%) | 1.92% (1.72%-2.14%) |
| Race and Ethnicity | |||
| Black, non-Hispanic | 1.87% (1.60%-2.16%) | 0.32% (0.23%-0.41%) | 2.18% (1.93%-2.47%) |
| Hispanic, any race | 1.84% (1.59%-2.12%) | 0.12% (0.08%-0.16%) | 1.95% (1.71%-2.22%) |
| Other | 2.00% (1.56%-2.48%) | 0.19% (0.09%-0.33%) | 2.19% (1.78%-2.60%) |
| White, non-Hispanic | 1.90% (1.65%-2.15%) | 0.22% (0.17%-0.28%) | 2.12% (1.88%-2.36%) |
| Age Group, y | |||
| 0-17 | 0.69% (0.57%-0.83%) | 0.09% (0.07%-0.12%) | 0.79% (0.67%-0.92%) |
| 18-39 | 0.97% (0.85%-1.09%) | 0.10% (0.08%-0.13%) | 1.07% (0.96%-1.18%) |
| 40-64 | 1.90% (1.67%-2.14%) | 0.21% (0.16%-0.27%) | 2.11% (1.89%-2.35%) |
| 65-84 | 4.10% (3.57%-4.65%) | 0.43% (0.33%-0.54%) | 4.54% (4.00%-5.06%) |
| ≥85 | 11.15% (9.46%-13.11%) | 1.24% (0.92%-1.58%) | 12.38% (10.72%-14.26%) |
| Living Facility | |||
| Correctional institution | 3.84% (2.68%-5.43%) | 0.54% (0.35%-0.79%) | 4.38% (3.25%-5.89%) |
| Nursing home | 14.80% (9.87%-20.96%) | 1.76% (1.13%-2.55%) | 16.56% (11.62%-22.69%) |
| Household Income | |||
| ≤ Poverty level | 2.81% (2.43%-3.23%) | 0.32% (0.22%-0.45%) | 3.13% (2.78%-3.53%) |
| > Poverty level | 1.67% (1.47%-1.86%) | 0.18% (0.14%-0.23%) | 1.85% (1.66%-2.03%) |
| Education Level | |||
| Less than high school | 2.52% (2.21%-2.85%) | 0.34% (0.26%-0.44%) | 2.86% (2.57%-3.18%) |
| HS diploma or GED | 2.69% (2.25%-3.15%) | 0.31% (0.20%-0.43%) | 3.00% (2.60%-3.44%) |
| Some college or AA degree | 1.96% (1.62%-2.31%) | 0.17% (0.10%-0.26%) | 2.13% (1.82%-2.47%) |
| Bachelor's degree or above | 1.34% (1.07%-1.63%) | 0.12% (0.07%-0.20%) | 1.46% (1.20%-1.74%) |
HS = high school; GED = general equivalency diploma; AA = associate of arts.
Table 2. Percentage of People in the United States With Uncorrected Refractive Error or Any Presenting Visual Acuity Loss, by Sociodemographic Characteristics, 2024 (95% Uncertainty Interval)*
| Uncorrected Refractive Error | Any Presenting Visual Acuity Loss | |
|---|---|---|
| Overall National | 7.36% (6.76%-7.97%) | 9.46% (8.92%-10.04%) |
| Sex | ||
| Female | 7.56% (6.80%-8.36%) | 9.84% (9.06%-10.61%) |
| Male | 7.15% (6.42%-7.88%) | 9.07% (8.40%-9.81%) |
| Race and Ethnicity | ||
| Black, non-Hispanic | 9.28% (8.27%-10.30%) | 11.46% (10.51%-12.47%) |
| Hispanic, any race | 8.54% (7.56%-9.52%) | 10.49% (9.55%-11.41%) |
| Other | 7.04% (5.67%-8.56%) | 9.23% (7.99%-10.68%) |
| White, non-Hispanic | 6.58% (5.79%-7.35%) | 8.70% (7.95%-9.46%) |
| Age Group, y | ||
| 0-17 | 3.38% (2.84%-3.96%) | 4.17% (3.64%-4.74%) |
| 18-39 | 4.51% (4.07%-4.98%) | 5.58% (5.14%-6.05%) |
| 40-64 | 7.72% (6.92%-8.48%) | 9.84% (9.09%-10.63%) |
| 65-84 | 13.97% (12.20%-15.76%) | 18.50% (16.85%-20.28%) |
| ≥85 | 34.87% (29.40%-40.53%) | 47.25% (41.90%-52.58%) |
| Living Facility | ||
| Correctional institution | 17.16% (11.22%-24.97%) | 21.54% (15.58%-29.14%) |
| Nursing home | 44.93% (29.66%-60.88%) | 61.49% (47.01%-76.62%) |
| Household Income | ||
| ≤ Poverty level | 10.55% (9.38%-11.78%) | 13.68% (12.51%-14.89%) |
| > Poverty level | 6.58% (5.98%-7.19%) | 8.43% (7.88%-9.04%) |
| Education Level | ||
| Less than high school | 5.17% (4.28%-6.21%) | 6.63% (5.76%-7.67%) |
| HS diploma or GED | 9.47% (8.11%-10.88%) | 12.46% (11.23%-13.83%) |
| Some college or AA degree | 8.28% (7.16%–9.47%) | 10.42% (9.29%–11.62%) |
| Bachelor's degree or above | 5.17% (4.28%–6.21%) | 6.63% (5.76%–7.67%) |
HS = high school; GED = general equivalency diploma; AA = associate of arts.
Table 3. Number of People in the United States With Best Corrected Visual Acuity Loss, by Sociodemographic Characteristics, 2024 (95% Uncertainty Interval)*
| Best Corrected Visual Acuity Loss | |||
|---|---|---|---|
| Impairment (20/32 to >20/200) |
Blindness (20/200 or worse) |
Any BCVA (20/32 or worse) |
|
| Overall National | 6,443,000 (5,790,000-7,115,000) | 706,000 (552,000-6,802,000) | 7,149,000 (6,519,000-7,799,000) |
| By Sex | |||
| Female | 3,550,000 (3,100,000-3,979,000) | 373,000 (285,000-5,153,000) | 3,923,000 (3,504,000-4,339,000) |
| Male | 2,893,000 (2,540,000-3,280,000) | 333,000 (250,000-6,734,000) | 3,226,000 (2,898,000-3,600,000) |
| Race and Ethnicity | |||
| Black, non-Hispanic | 802,000 (686,000-928,000) | 135,000 (100,000-2,148,000) | 937,000 (829,000-1,060,000) |
| Hispanic, any race | 1,252,000 (1,083,000-1,443,000) | 78,000 (53,000-4,085,000) | 1,330,000 (1,161,000-1,510,000) |
| Other | 671,000 (524,000-833,000) | 64,000 (31,000-2,355,000) | 735,000 (599,000-875,000) |
| White, non-Hispanic | 3,718,000 (3,231,000-4,205,000) | 428,000 (326,000-15,635,000) | 4,146,000 (3,673,000-4,622,000) |
| Age Group, y | |||
| 0-17 | 505,000 (418,000-603,000) | 68,000 (50,000-6,555,000) | 573,000 (488,000-671,000) |
| 18-39 | 979,000 (862,000-1,103,000) | 101,000 (78,000-10,128,000) | 1,080,000 (970,000-1,196,000) |
| 40-64 | 1,995,000 (1,753,000-2,247,000) | 222,000 (171,000-11,529,000) | 2,217,000 (1,983,000-2,464,000) |
| 65-84 | 2,247,000 (1,956,000-2,546,000) | 236,000 (183,000-6,569,000) | 2,483,000 (2,192,000-2,768,000) |
| ≥85 | 717,000 (609,000-844,000) | 80,000 (59,000-837,000) | 797,000 (690,000-918,000) |
| Living Facility | |||
| Correctional institution | 87,000 (61,000-123,000) | 12,000 (8,000-317,000) | 99,000 (74,000-133,000) |
| Nursing home | 254,000 (170,000-360,000) | 30,000 (19,000-326,000) | 284,000 (200,000-390,000) |
| Household Income | |||
| ≤ Poverty level | 1,152,000 (998,000-1,326,000) | 132,000 (90,000-8,615,000) | 1,284,000 (1,141,000-1,448,000) |
| > Poverty level | 4,844,000 (4,276,000-5,411,000) | 519,000 (401,000-61,019,000) | 5,364,000 (4,834,000-5,904,000) |
| Education Level | |||
| Less than high school | 1,635,000 (1,437,000-1,851,000) | 223,000 (166,000-11,046,000) | 1,858,000 (1,670,000-2,063,000) |
| HS diploma or GED | 1,963,000 (1,644,000-2,295,000) | 223,000 (149,000-11,674,000) | 2,185,000 (1,900,000-2,512,000) |
| Some college or AA degree | 1,545,000 (1,277,000-1,817,000) | 134,000 (79,000-14,156,000) | 1,679,000 (1,433,000-1,939,000) |
| Bachelor's degree or above | 1,132,000 (905,000-1,385,000) | 103,000 (55,000-12,710,000) | 1,235,000 (1,020,000-1,474,000) |
HS = high school; GED = general equivalency diploma; AA = associate of arts.
Table 4. Number of People in the United States With Uncorrected Refractive Error or Any Presenting Visual Acuity Loss, by Sociodemographic Characteristics, 2024 (95% Uncertainty Interval)*
| Uncorrected Refractive Error | Any Presenting Visual Acuity Loss | |
|---|---|---|
| Overall National | 25,022,000 (22,997,000-27,096,000) | 32,172,000 (30,345,000-34,151,000) |
| Sex | ||
| Female | 12,984,000 (11,678,000-14,362,000) | 16,907,000 (15,567,000-18,230,000) |
| Male | 12,038,000 (10,809,000-13,264,000) | 15,264,000 (14,144,000-16,514,000) |
| Race and Ethnicity | ||
| Black, non-Hispanic | 3,985,000 (3,552,000-4,426,000) | 4,922,000 (4,513,000-5,356,000) |
| Hispanic, any race | 5,812,000 (5,150,000-6,481,000) | 7,143,000 (6,503,000-7,772,000) |
| Other | 2,368,000 (1,907,000-2,878,000) | 3,104,000 (2,689,000-3,594,000) |
| White, non-Hispanic | 12,857,000 (11,311,000-14,361,000) | 17,003,000 (15,532,000-18,490,000) |
| Age Group, y | ||
| 0-17 | 2,464,000 (2,069,000-2,886,000) | 68,000 (50,000-6,555,000) |
| 18-39 | 4,572,000 (4,127,000-5,048,000) | 5,652,000 (5,208,000-6,127,000) |
| 40-64 | 8,095,000 (7,254,000-8,886,000) | 10,312,000 (9,529,000-11,140,000) |
| 65-84 | 7,647,000 (6,679,000-8,628,000) | 10,130,000 (9,223,000-11,102,000) |
| ≥85 | 2,244,000 (1,892,000-2,608,000) | 3,041,000 (2,697,000-3,384,000) |
| Living Facility | ||
| Correctional institution | 389,000 (254,000-566,000) | 488,000 (353,000-660,000) |
| Nursing home | 772,000 (510,000-1,046,000) | 1,056,000 (808,000-1,316,000) |
| Household Income | ||
| ≤ Poverty level | 4,327,000 (3,847,000-4,835,000) | 5,610,000 (5,133,000-6,108,000) |
| > Poverty level | 19,126,000 (17,365,000-20,881,000) | 24,490,000 (22,893,000-26,270,000) |
| Education Level | ||
| Less than high school | 6,453,000 (5,750,000-7,197,000) | 8,311,000 (7,640,000-9,034,000) |
| HS diploma or GED | 6,909,000 (5,920,000-7,936,000) | 9,095,000 (8,196,000-10,093,000) |
| Some college or AA degree | 6,514,000 (5,629,000-7,448,000) | 8,193,000 (7,306,000-9,141,000) |
| Bachelor's degree or above | 4,384,000 (3,626,000-5,266,000) | 5,620,000 (4,881,000-6,499,000) |
HS = high school; GED = general equivalency diploma; AA = associate of arts.
*The 95% uncertainty interval, also called a credible interval, represents the range of uncertainty around the estimate based on the Bayesian simulation model from which these estimates were derived. It indicates there is a 95% probability the true estimate lies within the interval.
View detailed results in VEHSS Data Explorer
Vision loss (best corrected visual acuity 20/40 or worse)
- State-level and county-level maps or tables and figures showing all states
- National-level figures and tables
- County-level results for a single state
Blindness (best corrected visual acuity 20/200 or worse)
Methods
Data type
Predicted prevalence rates and prevalence counts created using a Bayesian meta-regression statistical modeling approach.
Source data
- National Health and Nutrition Examination Survey (NHANES, 1999-2008, reference point data source)
- American Community Survey (ACS, 2018-2024) household self-reported blind or difficulty seeing with glasses, used for variation of vision loss by state, among children, by educational attainment and household poverty status, and among people living in group quarters, including nursing homes and correctional institutions.
- National Survey of Children's Health (NSCH, 2016-2023) household self-reported blind or difficulty seeing, used for variation in vision loss among children by demographics and state.
- National Health and Aging Trends Study (NHATS, 2022) presenting distance acuity loss used for variation in older adults.
- Review of published examination studies (1991-2018), including:
- Chinese American Eye Study (CHES).
- Eye Disease Prevalence Research Group (EDPRG).
- Los Angeles Latino Eye Study Group (LALES).
- Multi-Ethnic Study of Atherosclerosis (MESA).
- The modeled population is based on 2024 Census population estimates. Detailed cross-stratifications not available in the population estimates are derived from rates observed in the 2020 Decennial Census Privacy Protected Microdata File (PPMF).
Year
Released 2026; estimates based on 2024 population estimates.
Available stratification factors
- Impairment: Visual acuity of 20/32 to >20/200
- Blindness:
Visual acuity of ≤20/200
- All ages
- Detailed age groups (5-year groups)
-
Major age groups (0-17,
18-39, 40-64, 65-84, ≥85 years)
- Both sexes
- Male
- Female
- All racial and ethnic groups
- Black (non-Hispanic)
- Hispanic
- White (non-Hispanic)
- Other
racial and ethnic groups
- Nursing home
- Correctional institution
- Household income ≤ poverty rate
- Household
income > poverty rate
- Less than high school
- High school degree or general educational development (GED)
- Some college or associate’s degree
- Bachelor's degree or above
- Crude prevalence
- Adjusted prevalence (adjusted by age, race and ethnicity, and sex)
More visual function indicators in the VEHSS Data Explorer
VEHSS modeled estimates are created by combining prevalence information from multiple data sources, many of which are also separately available in the VEHSS Data Explorer and Data Portal. While these individual data sources provide specific and useful information about vision loss and blindness prevalence, they each have inherent limitations and do not provide comprehensive prevalence measures on their own. It is important to consider all sources when deciding which indicator and data source best fits a specific information need.
Self-report measures: VEHSS contains estimates of individuals who reported difficulties with their vision in survey responses to the American Community Survey (ACS), Behavioral Risk Factor Surveillance System (BRFSS), National Health Interview Survey (NHIS), and the National Survey of Children's Health (NSCH). These estimates represent people who perceive that they have vision problems. Estimates from these sources are sensitive to question wording and the data collection mode (Rein et al. Vision Impairment and Blindness Prevalence in the United States: Variability of Vision Health Responses across Multiple National Surveys). The VEHSS visual acuity loss prevalence estimates use survey self-reported information to estimate variations in vision loss and blindness geographically and among children and older adults.
Measured acuity: VEHSS contains national modeled estimates of measured, correctable, and uncorrectable visual acuity deficits from NHANES. VEHSS vision loss and blindness modeled estimates use this information and population-based study data to estimate the total number of people with vision loss and blindness in 2024. The original NHANES estimates are available on the VEHSS Data Explorer but are only available at the national level and were last collected in 2008.
The VEHSS Data Explorer also contains information on patients with measured vision impairment or blindness as measured by ophthalmologists and reported to the Intelligent Research in Sight (IRIS) Registry©. IRIS Registry data can be used to look at state and population differences but are only applicable to people who visited an ophthalmologist and participated in the IRIS Registry.
Utilization measures: While VEHSS identifies diagnosed vision loss in administrative claims databases and the IRIS Registry, diagnosis codes for vision loss are underutilized and exhibit low sensitivity for indicating visual acuity loss (Wittenborn et al. Validity of Administrative Claims and Electronic Health Registry Data From a Single Practice for Eye Health Surveillance). Prevalence of diagnosed vision loss is therefore not an accurate measure of the prevalence of vision loss. However, this information may be indicative of trends and disparities in health services related to vision problems.
Summary
VEHSS modeled estimates of vision loss and blindness are CDC’s primary measure of the percentage of people in the United States who have vision loss, overall and by type of visual acuity loss, geography, and sociodemographic characteristics. These estimates are based on visual acuity loss and therefore represent vision loss that can be objectively measured. These differ from survey self-report estimates, which represent self-assessed visual function. It is important to consider the differences in available measures when deciding whether the modeled estimates of vision loss and blindness, survey self-report, or other data sources are most appropriate to address a specific research objective.
State results
The tables below contain prevalence and counts by state. More detailed state and county numbers are available in the VEHSS Data Explorer or from the VEHSS Prevalence Estimates public use file available for download from the VEHSS Data Portal
Table 5. Percentage of People in the United States With Best Corrected Visual Acuity Loss, by State, 2024 (95% Uncertainty Interval)*
| Best Corrected Visual Acuity Loss | |||
|---|---|---|---|
| Impairment (20/32 to >20/200) | Blindness (20/200 or worse) | Any (20/32 or worse) | |
| Alaska | 2.03% (1.70%-2.47%) | 0.21% (0.16%-0.28%) | 2.25% (1.88%-2.70%) |
| Alabama | 2.14% (1.84%-2.49%) | 0.22% (0.17%-0.27%) | 2.35% (2.05%-2.72%) |
| Arkansas | 2.22% (1.89%-2.60%) | 0.22% (0.17%-0.28%) | 2.45% (2.11%-2.83%) |
| Arizona | 1.92% (1.52%-2.34%) | 0.20% (0.15%-0.28%) | 2.12% (1.71%-2.59%) |
| California | 1.78% (1.53%-2.04%) | 0.20% (0.15%-0.25%) | 1.98% (1.73%-2.24%) |
| Colorado | 1.79% (1.54%-2.04%) | 0.19% (0.15%-0.25%) | 1.99% (1.72%-2.25%) |
| Connecticut | 1.75% (1.44%-2.08%) | 0.20% (0.15%-0.27%) | 1.95% (1.63%-2.29%) |
| District of Columbia | 1.57% (1.10%-2.17%) | 0.17% (0.10%-0.27%) | 1.75% (1.22%-2.40%) |
| Delaware | 1.80% (1.38%-2.26%) | 0.20% (0.14%-0.28%) | 2.00% (1.54%-2.50%) |
| Florida | 1.86% (1.63%-2.10%) | 0.20% (0.16%-0.26%) | 2.07% (1.84%-2.31%) |
| Georgia | 1.96% (1.72%-2.20%) | 0.21% (0.16%-0.26%) | 2.17% (1.94%-2.41%) |
| Hawaii | 1.67% (1.28%-2.09%) | 0.19% (0.13%-0.27%) | 1.86% (1.43%-2.31%) |
| Iowa | 1.82% (1.54%-2.10%) | 0.21% (0.17%-0.27%) | 2.04% (1.75%-2.32%) |
| Idaho | 2.03% (1.74%-2.40%) | 0.21% (0.16%-0.28%) | 2.24% (1.93%-2.61%) |
| Illinois | 1.82% (1.53%-2.15%) | 0.21% (0.15%-0.27%) | 2.02% (1.72%-2.38%) |
| Indiana | 2.01% (1.75%-2.27%) | 0.22% (0.17%-0.28%) | 2.23% (1.97%-2.49%) |
| Kansas | 1.95% (1.69%-2.24%) | 0.21% (0.16%-0.27%) | 2.16% (1.88%-2.47%) |
| Kentucky | 2.22% (1.89%-2.59%) | 0.23% (0.17%-0.29%) | 2.45% (2.11%-2.82%) |
| Louisiana | 2.24% (1.88%-2.68%) | 0.22% (0.17%-0.28%) | 2.46% (2.09%-2.89%) |
| Massachusetts | 1.74% (1.45%-2.03%) | 0.20% (0.15%-0.26%) | 1.95% (1.65%-2.26%) |
| Maryland | 1.69% (1.42%-1.98%) | 0.20% (0.15%-0.25%) | 1.89% (1.61%-2.18%) |
| Maine | 1.80% (1.51%-2.09%) | 0.21% (0.16%-0.27%) | 2.01% (1.71%-2.32%) |
| Michigan | 1.87% (1.61%-2.14%) | 0.21% (0.16%-0.27%) | 2.08% (1.81%-2.35%) |
| Minnesota | 1.69% (1.38%-2.01%) | 0.21% (0.16%-0.26%) | 1.90% (1.58%-2.23%) |
| Missouri | 2.01% (1.75%-2.29%) | 0.22% (0.16%-0.27%) | 2.23% (1.96%-2.51%) |
| Mississippi | 2.26% (1.91%-2.66%) | 0.22% (0.17%-0.28%) | 2.48% (2.12%-2.88%) |
| Montana | 1.95% (1.68%-2.23%) | 0.22% (0.17%-0.28%) | 2.17% (1.88%-2.47%) |
| North Carolina | 1.91% (1.69%-2.14%) | 0.21% (0.16%-0.26%) | 2.12% (1.89%-2.35%) |
| North Dakota | 1.87% (1.57%-2.16%) | 0.22% (0.17%-0.28%) | 2.09% (1.78%-2.39%) |
| Nebraska | 1.87% (1.57%-2.21%) | 0.21% (0.16%-0.27%) | 2.07% (1.76%-2.43%) |
| New Hampshire | 1.78% (1.48%-2.11%) | 0.21% (0.15%-0.28%) | 1.99% (1.66%-2.34%) |
| New Jersey | 1.72% (1.46%-1.98%) | 0.20% (0.15%-0.25%) | 1.92% (1.65%-2.17%) |
| New Mexico | 2.12% (1.77%-2.58%) | 0.20% (0.15%-0.26%) | 2.32% (1.96%-2.79%) |
| Nevada | 2.02% (1.56%-2.67%) | 0.21% (0.14%-0.30%) | 2.23% (1.72%-2.90%) |
| New York | 1.76% (1.51%-2.02%) | 0.21% (0.16%-0.26%) | 1.97% (1.71%-2.24%) |
| Ohio | 1.95% (1.71%-2.20%) | 0.22% (0.17%-0.28%) | 2.17% (1.92%-2.42%) |
| Oklahoma | 2.31% (1.89%-2.80%) | 0.22% (0.17%-0.28%) | 2.53% (2.10%-3.03%) |
| Oregon | 1.93% (1.67%-2.25%) | 0.21% (0.16%-0.27%) | 2.14% (1.86%-2.47%) |
| Pennsylvania | 1.90% (1.67%-2.15%) | 0.22% (0.17%-0.27%) | 2.12% (1.88%-2.38%) |
| Rhode Island | 1.83% (1.40%-2.32%) | 0.21% (0.14%-0.30%) | 2.05% (1.57%-2.57%) |
| South Carolina | 1.99% (1.74%-2.26%) | 0.21% (0.16%-0.26%) | 2.20% (1.94%-2.47%) |
| South Dakota | 1.90% (1.62%-2.19%) | 0.22% (0.17%-0.28%) | 2.12% (1.83%-2.43%) |
| Tennessee | 2.14% (1.84%-2.47%) | 0.22% (0.17%-0.27%) | 2.36% (2.07%-2.69%) |
| Texas | 2.01% (1.76%-2.29%) | 0.20% (0.16%-0.25%) | 2.21% (1.96%-2.50%) |
| Utah | 1.81% (1.50%-2.15%) | 0.20% (0.15%-0.26%) | 2.01% (1.67%-2.37%) |
| Vermont | 1.89% (1.61%-2.22%) | 0.21% (0.16%-0.27%) | 2.10% (1.80%-2.44%) |
| Virginia | 1.80% (1.59%-2.02%) | 0.20% (0.16%-0.25%) | 2.00% (1.79%-2.22%) |
| Washington | 1.89% (1.62%-2.19%) | 0.20% (0.15%-0.26%) | 2.09% (1.80%-2.41%) |
| Wisconsin | 1.74% (1.43%-2.06%) | 0.21% (0.16%-0.27%) | 1.95% (1.64%-2.28%) |
| West Virginia | 2.22% (1.93%-2.56%) | 0.23% (0.18%-0.30%) | 2.46% (2.16%-2.80%) |
| Wyoming | 2.03% (1.78%-2.34%) | 0.22% (0.17%-0.28%) | 2.25% (1.99%-2.57%) |
Table 6. Percentage of People in the United States With Uncorrected Refractive Error or Any Presenting Visual Acuity Loss, by State, 2024 (95% Uncertainty Interval)*
| Uncorrected Refractive Error | Any Presenting Visual Acuity Loss | |
|---|---|---|
| Alaska | 8.05% (7.39%-8.79%) | 10.30% (9.47%-11.22%) |
| Alabama | 9.24% (8.53%-9.93%) | 11.59% (10.94%-12.29%) |
| Arkansas | 9.99% (9.24%-10.78%) | 12.44% (11.70%-13.22%) |
| Arizona | 7.79% (7.12%-8.46%) | 9.91% (9.29%-10.52%) |
| California | 6.49% (5.94%-7.06%) | 8.47% (7.96%-8.99%) |
| Colorado | 6.89% (6.32%-7.49%) | 8.87% (8.32%-9.46%) |
| Connecticut | 6.32% (5.79%-6.90%) | 8.28% (7.73%-8.84%) |
| District of Columbia | 5.88% (5.25%-6.52%) | 7.63% (6.79%-8.53%) |
| Delaware | 6.59% (5.97%-7.21%) | 8.59% (7.83%-9.33%) |
| Florida | 7.18% (6.59%-7.79%) | 9.25% (8.69%-9.81%) |
| Georgia | 7.86% (7.24%-8.50%) | 10.03% (9.43%-10.65%) |
| Hawaii | 5.70% (5.16%-6.26%) | 7.56% (6.97%-8.20%) |
| Iowa | 6.37% (5.77%-6.97%) | 8.41% (7.85%-9.00%) |
| Idaho | 8.45% (7.77%-9.15%) | 10.69% (10.00%-11.41%) |
| Illinois | 6.64% (6.07%-7.21%) | 8.66% (8.11%-9.24%) |
| Indiana | 7.84% (7.20%-8.49%) | 10.06% (9.44%-10.71%) |
| Kansas | 7.88% (7.23%-8.54%) | 10.04% (9.36%-10.72%) |
| Kentucky | 9.83% (9.09%-10.55%) | 12.28% (11.55%-13.00%) |
| Louisiana | 10.42% (9.64%-11.19%) | 12.88% (12.16%-13.65%) |
| Massachusetts | 6.06% (5.53%-6.60%) | 8.01% (7.52%-8.54%) |
| Maryland | 5.79% (5.23%-6.33%) | 7.68% (7.16%-8.18%) |
| Maine | 6.30% (5.69%-6.92%) | 8.30% (7.67%-8.96%) |
| Michigan | 6.91% (6.30%-7.51%) | 8.99% (8.45%-9.57%) |
| Minnesota | 5.47% (4.91%-6.01%) | 7.37% (6.85%-7.89%) |
| Missouri | 8.10% (7.46%-8.76%) | 10.33% (9.69%-10.99%) |
| Mississippi | 10.69% (9.87%-11.49%) | 13.17% (12.40%-13.94%) |
| Montana | 7.30% (6.69%-7.92%) | 9.47% (8.87%-10.16%) |
| North Carolina | 7.46% (6.86%-8.09%) | 9.58% (9.01%-10.21%) |
| North Dakota | 6.63% (5.99%-7.27%) | 8.71% (8.01%-9.45%) |
| Nebraska | 6.92% (6.29%-7.53%) | 8.99% (8.32%-9.60%) |
| New Hampshire | 6.26% (5.65%-6.87%) | 8.25% (7.63%-8.95%) |
| New Jersey | 6.06% (5.50%-6.62%) | 7.97% (7.48%-8.51%) |
| New Mexico | 9.75% (9.01%-10.51%) | 12.07% (11.36%-12.86%) |
| Nevada | 8.56% (7.81%-9.24%) | 10.79% (10.08%-11.51%) |
| New York | 6.11% (5.56%-6.65%) | 8.09% (7.61%-8.60%) |
| Ohio | 7.39% (6.74%-8.01%) | 9.56% (8.95%-10.14%) |
| Oklahoma | 11.30% (10.42%-12.16%) | 13.83% (13.04%-14.70%) |
| Oregon | 7.62% (7.00%-8.26%) | 9.76% (9.12%-10.39%) |
| Pennsylvania | 7.16% (6.57%-7.78%) | 9.28% (8.71%-9.85%) |
| Rhode Island | 6.70% (6.06%-7.30%) | 8.75% (7.94%-9.51%) |
| South Carolina | 8.28% (7.64%-8.93%) | 10.48% (9.85%-11.17%) |
| South Dakota | 6.61% (5.99%-7.25%) | 8.73% (8.11%-9.39%) |
| Tennessee | 9.36% (8.66%-10.06%) | 11.72% (11.02%-12.41%) |
| Texas | 8.58% (7.94%-9.27%) | 10.79% (10.19%-11.44%) |
| Utah | 6.74% (6.18%-7.31%) | 8.75% (8.14%-9.36%) |
| Vermont | 7.06% (6.43%-7.70%) | 9.16% (8.42%-9.91%) |
| Virginia | 6.72% (6.16%-7.27%) | 8.73% (8.19%-9.27%) |
| Washington | 7.43% (6.83%-8.05%) | 9.51% (8.92%-10.12%) |
| Wisconsin | 5.70% (5.14%-6.25%) | 7.65% (7.17%-8.21%) |
| West Virginia | 9.48% (8.75%-10.23%) | 11.94% (11.25%-12.69%) |
| Wyoming | 8.24% (7.58%-8.91%) | 10.49% (9.79%-11.27%) |
Table 7. Number of People of All Ages in the United States With Best Corrected Visual Acuity Loss, by Severity and State, 2024 (95% Uncertainty Interval)*
| Best Corrected Visual Acuity Loss | |||
|---|---|---|---|
| Impairment (20/32 to >20/200) | Blindness (20/200 or worse) | Any (20/32 or worse) | |
| Alaska | 15,000 (13,000-18,000) | 2,000 (1,000-2,000) | 17,000 (14,000-20,000) |
| Alabama | 110,000 (95,000-128,000) | 11,000 (9,000-14,000) | 121,000 (106,000-140,000) |
| Arkansas | 69,000 (58,000-80,000) | 7,000 (5,000-9,000) | 76,000 (65,000-87,000) |
| Arizona | 1145,000 (115,000-178,000) | 15,000 (11,000-21,000) | 161,000 (129,000-196,000) |
| California | 702,000 (605,000-802,000) | 78,000 (60,000-100,000) | 780,000 (681,000-884,000) |
| Colorado | 107,000 (92,000-121,000) | 12,000 (9,000-15,000) | 118,000 (102,000-134,000) |
| Connecticut | 64,000 (53,000-76,000) | 7,000 (6,000-10,000) | 72,000 (60,000-84,000) |
| District of Columbia | 11,000 (8,000-15,000) | 1,000 (1,000-2,000) | 12,000 (9,000-17,000) |
| Delaware | 19,000 (15,000-24,000) | 2,000 (1,000-3,000) | 21,000 (16,000-26,000) |
| Florida | 436,000 (382,000-492,000) | 48,000 (37,000-60,000) | 483,000 (431,000-539,000) |
| Georgia | 219,000 (193,000-246,000) | 23,000 (18,000-29,000) | 243,000 (216,000-269,000) |
| Hawaii | 24,000 (19,000-30,000) | 3,000 (2,000-4,000) | 27,000 (21,000-33,000) |
| Iowa | 59,000 (50,000-68,000) | 7,000 (5,000-9,000) | 66,000 (57,000-75,000) |
| Idaho | 41,000 (35,000-48,000) | 4,000 (3,000-6,000) | 45,000 (39,000-52,000) |
| Illinois | 231,000 (194,000-274,000) | 26,000 (19,000-34,000) | 257,000 (218,000-302,000) |
| Indiana | 139,000 (121,000-157,000) | 15,000 (12,000-19,000) | 154,000 (136,000-172,000) |
| Kansas | 58,000 (50,000-67,000) | 6,000 (5,000-8,000) | 64,000 (56,000-73,000) |
| Kentucky | 102,000 (87,000-119,000) | 10,000 (8,000-13,000) | 112,000 (97,000-129,000) |
| Louisiana | 103,000 (86,000-123,000) | 10,000 (8,000-13,000) | 113,000 (96,000-133,000) |
| Massachusetts | 124,000 (103,000-145,000) | 14,000 (11,000-19,000) | 139,000 (118,000-161,000) |
| Maryland | 106,000 (89,000-124,000) | 12,000 (9,000-16,000) | 118,000 (101,000-137,000) |
| Maine | 25,000 (21,000-29,000) | 3,000 (2,000-4,000) | 28,000 (24,000-33,000) |
| Michigan | 189,000 (163,000-217,000) | 21,000 (16,000-28,000) | 211,000 (184,000-239,000) |
| Minnesota | 98,000 (80,000-116,000) | 12,000 (9,000-15,000) | 110,000 (92,000-129,000) |
| Missouri | 126,000 (109,000-143,000) | 13,000 (10,000-17,000) | 139,000 (122,000-157,000) |
| Mississippi | 66,000 (56,000-78,000) | 7,000 (5,000-8,000) | 73,000 (63,000-85,000) |
| Montana | 22,000 (19,000-25,000) | 3,000 (2,000-3,000) | 25,000 (21,000-28,000) |
| North Carolina | 211,000 (187,000-237,000) | 23,000 (18,000-29,000) | 234,000 (209,000-260,000) |
| North Dakota | 15,000 (13,000-17,000) | 2,000 (1,000-2,000) | 17,000 (14,000-19,000) |
| Nebraska | 37,000 (32,000-44,000) | 4,000 (3,000-5,000) | 42,000 (35,000-49,000) |
| New Hampshire | 25,000 (21,000-30,000) | 3,000 (2,000-4,000) | 28,000 (23,000-33,000) |
| New Jersey | 163,000 (139,000-188,000) | 19,000 (15,000-24,000) | 182,000 (156,000-206,000) |
| New Mexico | 45,000 (38,000-55,000) | 19,000 (15,000-24,000) | 49,000 (42,000-59,000) |
| Nevada | 66,000 (51,000-87,000) | 7,000 (5,000-10,000) | 73,000 (56,000-95,000) |
| New York | 350,000 (300,000-401,000) | 41,000 (31,000-53,000) | 392,000 (339,000-445,000) |
| Ohio | 232,000 (203,000-262,000) | 26,000 (20,000-33,000) | 258,000 (229,000-288,000) |
| Oklahoma | 95,000 (77,000-115,000) | 9,000 (7,000-12,000) | 104,000 (86,000-124,000) |
| Oregon | 82,000 (71,000-96,000) | 9,000 (7,000-11,000) | 91,000 (80,000-106,000) |
| Pennsylvania | 249,000 (218,000-281,000) | 28,000 (22,000-35,000) | 277,000 (246,000-311,000) |
| Rhode Island | 20,000 (16,000-26,000) | 2,000 (2,000-3,000) | 23,000 (17,000-29,000) |
| South Carolina | 109,000 (95,000-124,000) | 11,000 (9,000-14,000) | 120,000 (106,000-136,000) |
| South Dakota | 18,000 (15,000-20,000) | 2,000 (2,000-3,000) | 20,000 (17,000-22,000) |
| Tennessee | 155,000 (133,000-179,000) | 16,000 (12,000-20,000) | 171,000 (150,000-194,000) |
| Texas | 629,000 (551,000-715,000) | 64,000 (49,000-80,000) | 692,000 (613,000-782,000) |
| Utah | 63,000 (53,000-75,000) | 7,000 (5,000-9,000) | 70,000 (59,000-83,000) |
| Vermont | 12,000 (10,000-14,000) | 1,000 (1,000-2,000) | 14,000 (12,000-16,000) |
| Virginia | 1159,000 (140,000-178,000) | 18,000 (14,000-22,000) | 176,000 (157,000-195,000) |
| Washington | 150,000 (129,000-174,000) | 16,000 (12,000-21,000) | 166,000 (143,000-192,000) |
| Wisconsin | 104,000 (85,000-123,000) | 13,000 (10,000-16,000) | 116,000 (98,000-136,000) |
| West Virginia | 39,000 (34,000-45,000) | 4,000 (3,000-5,000) | 44,000 (38,000-50,000) |
| Wyoming | 12,000 (10,000-14,000) | 1,000 (1,000-2,000) | 13,000 (12,000-15,000) |
Table 8. Number of People of All Ages in the United States With Uncorrected Refractive Error or Any Presenting Visual Acuity Loss, by State, 2024 (95% Uncertainty Interval)*
| Uncorrected Refractive Error | Any Presenting Visual Acuity Loss | |
|---|---|---|
| Alaska | 60,000 (55,000-65,000) | 76,000 (70,000-83,000) |
| Alabama | 476,000 (440,000-512,000) | 598,000 (564,000-634,000) |
| Arkansas | 309,000 (285,000-333,000) | 384,000 (361,000-408,000) |
| Arizona | 591,000 (540,000-642,000) | 751,000 (704,000-798,000) |
| California | 2,560,000 (2,341,000-2,783,000) | 3,340,000 (3,140,000-3,545,000) |
| Colorado | 410,000 (377,000-446,000) | 529,000 (495,000-563,000) |
| Connecticut | 232,000 (213,000-254,000) | 304,000 (284,000-325,000) |
| District of Columbia | 41,000 (37,000-46,000) | 54,000 (48,000-60,000) |
| Delaware | 69,000 (63,000-76,000) | 90,000 (82,000-98,000) |
| Florida | 1,678,000 (1,539,000-1,820,000) | 2,161,000 (2,030,000-2,293,000) |
| Georgia | 879,000 (809,000-951,000) | 1,121,000 (1,055,000-1,191,000) |
| Hawaii | 82,000 (75,000-90,000) | 109,000 (101,000-119,000) |
| Iowa | 207,000 (187,000-226,000) | 273,000 (254,000-292,000) |
| Idaho | 169,000 (155,000-183,000) | 214,000 (200,000-228,000) |
| Illinois | 843,000 (771,000-917,000) | 1,101,000 (1,030,000-1,174,000) |
| Indiana | 543,000 (499,000-588,000) | 697,000 (654,000-741,000) |
| Kansas | 234,000 (215,000-254,000) | 298,000 (278,000-318,000) |
| Kentucky | 451,000 (417,000-484,000) | 563,000 (530,000-597,000) |
| Louisiana | 479,000 (443,000-515,000) | 592,000 (559,000-628,000) |
| Massachusetts | 433,000 (395,000-471,000) | 572,000 (537,000-609,000) |
| Maryland | 362,000 (327,000-397,000) | 481,000 (449,000-512,000) |
| Maine | 88,000 (80,000-97,000) | 117,000 (108,000-126,000) |
| Michigan | 701,000 (639,000-761,000) | 912,000 (857,000-970,000) |
| Minnesota | 317,000 (284,000-348,000) | 427,000 (397,000-457,000) |
| Missouri | 506,000 (466,000-547,000) | 645,000 (605,000-687,000) |
| Mississippi | 315,000 (291,000-338,000) | 388,000 (365,000-410,000) |
| Montana | 83,000 (76,000-90,000) | 108,000 (101,000-116,000) |
| North Carolina | 824,000 (758,000-893,000) | 1,058,000 (995,000-1,128,000) |
| North Dakota | 53,000 (48,000-58,000) | 69,000 (64,000-75,000) |
| Nebraska | 139,000 (126,000-151,000) | 180,000 (167,000-193,000) |
| New Hampshire | 88,000 (80,000-97,000) | 116,000 (107,000-126,000) |
| New Jersey | 575,000 (522,000-629,000) | 758,000 (710,000-809,000) |
| New Mexico | 208,000 (192,000-224,000) | 257,000 (242,000-274,000) |
| Nevada | 280,000 (255,000-302,000) | 353,000 (329,000-376,000) |
| New York | 1,215,000 (1,105,000-1,322,000) | 1,607,000 (1,512,000-1,709,000) |
| Ohio | 878,000 (801,000-952,000) | 1,135,000 (1,064,000-1,206,000) |
| Oklahoma | 463,000 (427,000-498,000) | 566,000 (534,000-602,000) |
| Oregon | 326,000 (299,000-353,000) | 417,000 (390,000-444,000) |
| Pennsylvania | 937,000 (859,000-1,017,000) | 1,214,000 (1,139,000-1,288,000) |
| Rhode Island | 75,000 (67,000-81,000) | 97,000 (88,000-106,000) |
| South Carolina | 454,000 (418,000-489,000) | 574,000 (539,000-612,000) |
| South Dakota | 61,000 (55,000-67,000) | 81,000 (75,000-87,000) |
| Tennessee | 677,000 (626,000-727,000) | 847,000 (797,000-897,000) |
| Texas | 2,685,000 (2,486,000-2,900,000) | 3,378,000 (3,188,000-3,580,000) |
| Utah | 236,000 (217,000-256,000) | 307,000 (285,000-328,000) |
| Vermont | 46,000 (42,000-50,000) | 59,000 (55,000-64,000) |
| Virginia | 592,000 (543,000-640,000) | 769,000 (721,000-817,000) |
| Washington | 591,000 (544,000-640,000) | 757,000 (710,000-806,000) |
| Wisconsin | 340,000 (306,000-373,000) | 456,000 (427,000-489,000) |
| West Virginia | 168,000 (155,000-181,000) | 211,000 (199,000-225,000) |
| Wyoming | 48,000 (45,000-52,000) | 62,000 (57,000-66,000) |
This page was last updated on this date. Updates may include minor edits, image changes, or other modifications to page content.
The information on this page was last reviewed by subject matter experts to ensure accuracy.