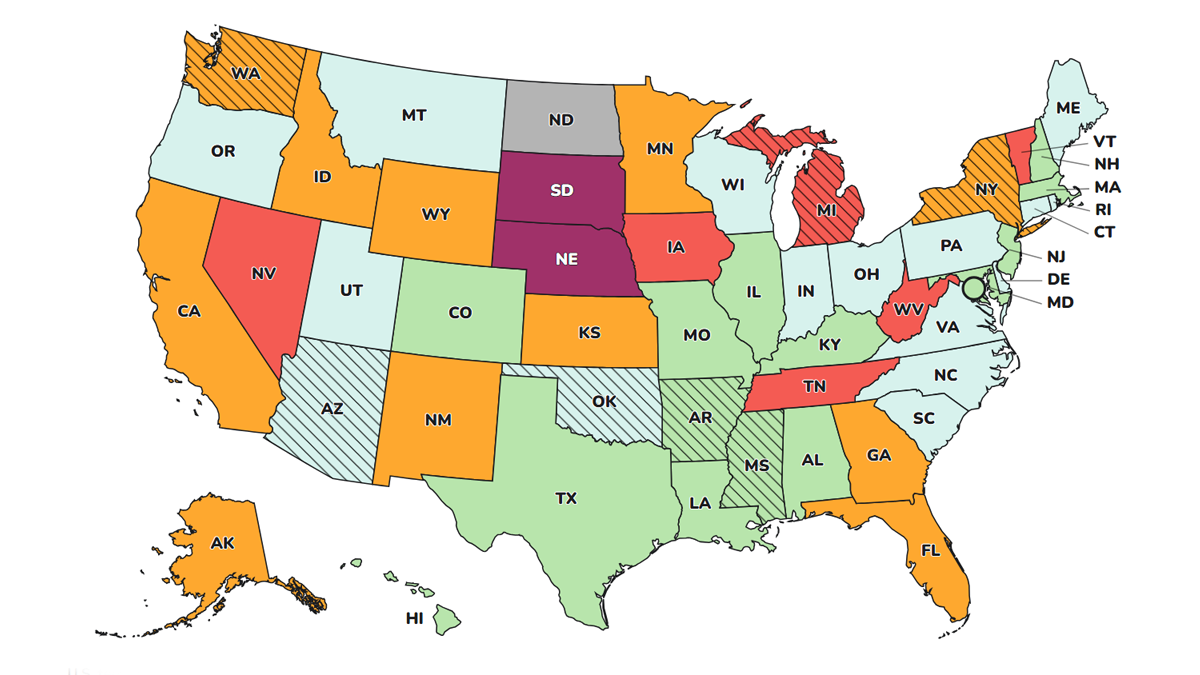
Explore wastewater viral activity data for tracked respiratory viruses across the U.S.

Explore wastewater detection data for measles, A(H5), and monkeypox at sites across the U.S.
More information
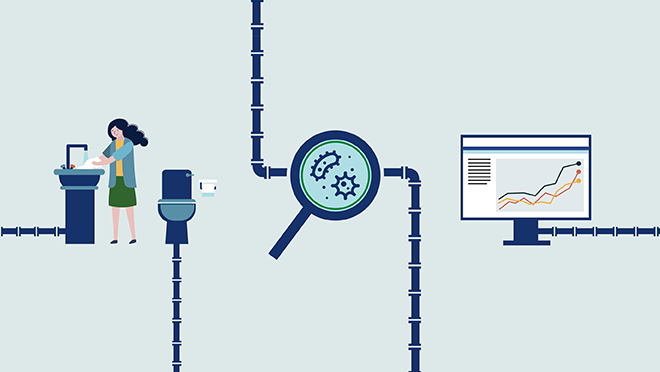
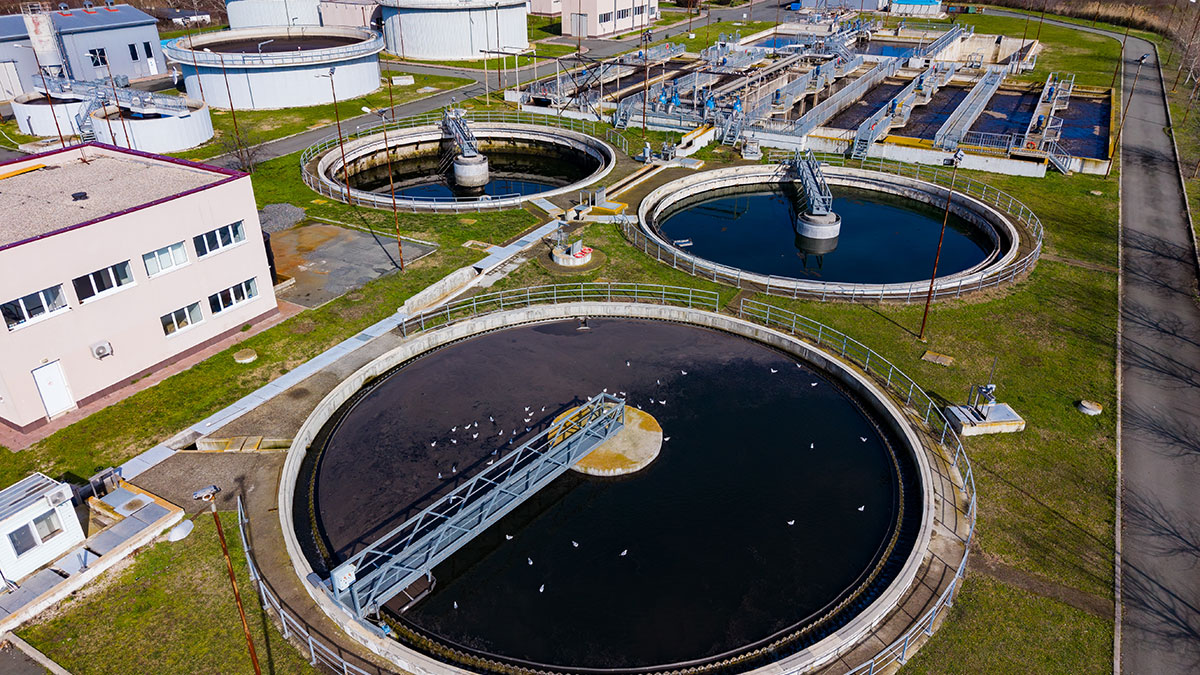
CDC's program provides the infrastructure to monitor infectious diseases through wastewater.
Wastewater data helps communities act quickly to prevent the spread of infections.

Wastewater monitoring resources, including factsheets, publications, videos, and images.