Coal Contractor Mining Facts - 2008 (HTML)
DHHS (NIOSH) Publication No. 2011–168
Mining Operations
An independent contractor is defined by the Mine Safety and Health Administration (MSHA) as "any person, partnership, corporation, subsidiary of a corporation, firm, association or other organization that contracts to perform services or construction at a mine. Contractors that perform specific types of work are required to report the number of employees who work at coal mines and noncoal mines.
Companies
In 2008, a total of 3,467 independent contracting companies reported employment at coal mines, or 36.1% of all independent contracting companies.
Employees
A total of 43,772 employees, [1] corresponding to 26,321 full-time equivalent (FTE) [2] employees, were reported by coal contractors.
- Within the mining sectors, [3] coal contractor employees comprised 7.7% of all employee hours reported to MSHA.
- Coal contractor employee hours were reported for both underground (15.6%) and surface (84.4%) work locations. [4]
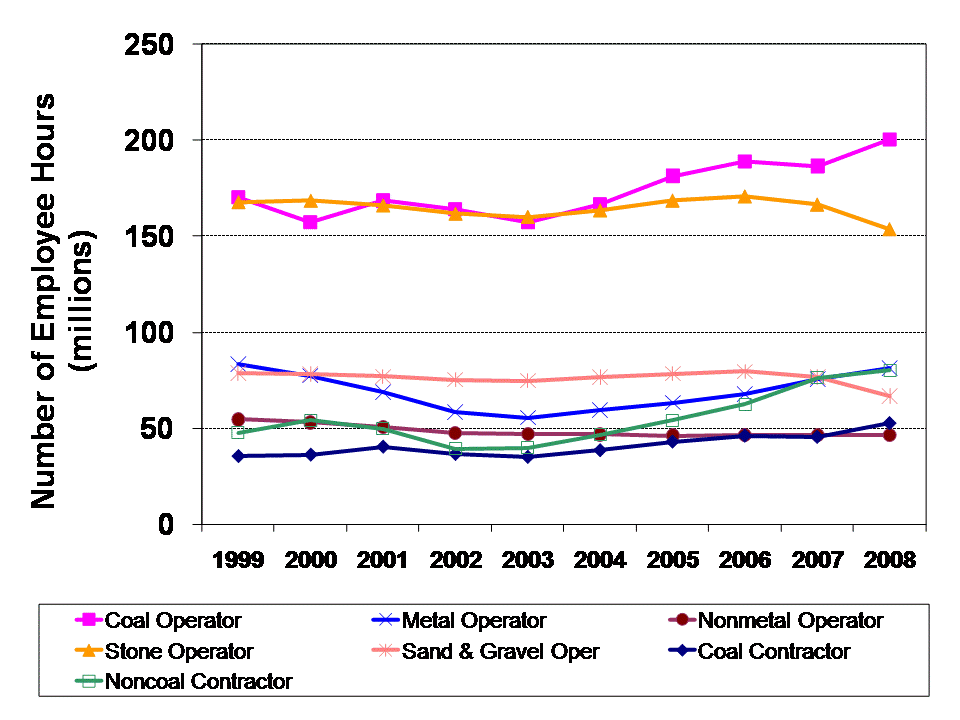
| Commodity and Type of Employer |
1999 | 2000 | 2001 | 2002 | 2003 | 2004 | 2005 | 2006 | 2007 | 2008 |
|---|---|---|---|---|---|---|---|---|---|---|
| Coal Operator | 170.3 | 157.3 | 168.4 | 163.8 | 157.1 | 166.5 | 181.3 | 189.0 | 186.5 | 200.4 |
| Metal Operator | 83.4 | 77.4 | 68.8 | 58.5 | 55.5 | 59.5 | 63.4 | 67.9 | 75.5 | 81.4 |
| Nonmetal Operator | 54.7 | 53.1 | 50.6 | 47.5 | 46.9 | 46.9 | 46.2 | 46.4 | 46.5 | 46.5 |
| Stone Operator | 167.8 | 168.5 | 166.1 | 161.7 | 160.0 | 163.5 | 168.6 | 170.8 | 166.5 | 153.5 |
| Sand and Gravel Operator | 78.9 | 78.1 | 77.0 | 75.3 | 74.8 | 76.6 | 78.4 | 79.6 | 76.7 | 66.7 |
| Coal Contractor | 35.4 | 36.2 | 40.3 | 36.5 | 35.0 | 38.5 | 43.0 | 46.2 | 45.5 | 52.6 |
| Noncoal Contractor | 47.8 | 54.2 | 49.8 | 39.2 | 39.9 | 46.8 | 54.1 | 62.6 | 76.3 | 80.2 |
Fatalities
Twelve occupational fatalities occurred among coal contractor employee in 2008. These coal fatalities accounted for 70.6% of all contractor fatalities.
- The coal contractor fatality rate was 48.3 [95% confidence interval (CI): 25.0, 84.4] fatalities per 100,000 FTE employees. The underground rate was not calculated because the number of fatalities was less than 5 (n=3). The surface work location rate was 43.4 [CI: 19.9, 82.5] (n=9).
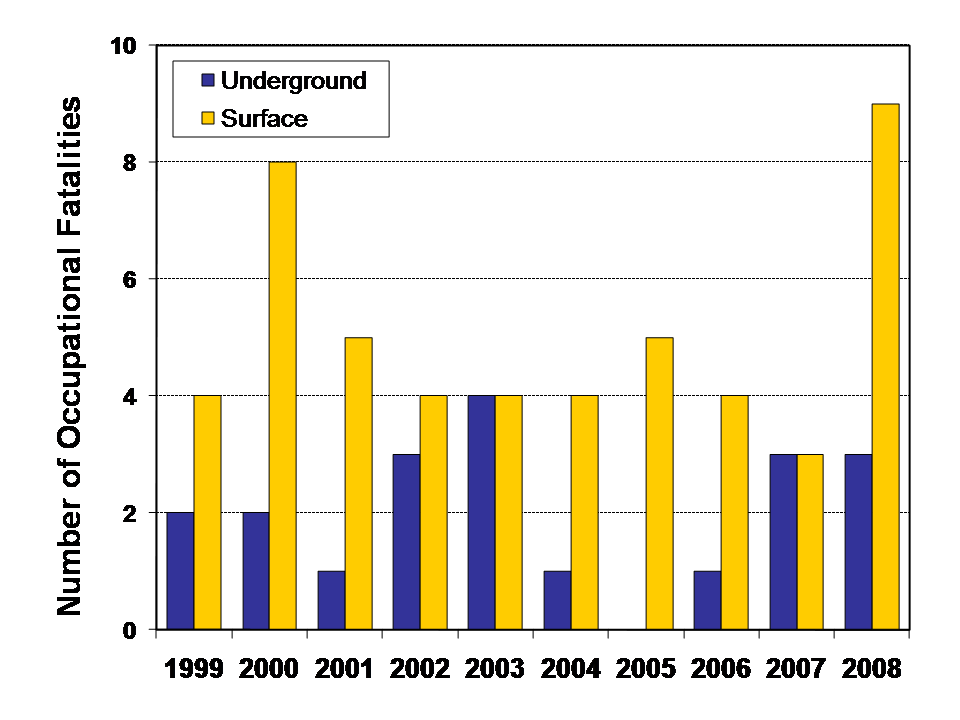
| Fatalities | 1999 | 2000 | 2001 | 2002 | 2003 | 2004 | 2005 | 2006 | 2007 | 2008 |
|---|---|---|---|---|---|---|---|---|---|---|
| Underground number | 2 | 2 | 1 | 3 | 4 | 1 | 0 | 1 | 3 | 3 |
| Surface number | 4 | 8 | 5 | 4 | 4 | 4 | 5 | 4 | 3 | 9 |
Nonfatal Lost-time Injuries
There were 481 nonfatal lost-time injuries among coal contractor employees (168 at underground and 313 at surface work locations) with an overall rate of 1.9 [CI: 1.8, 2.1] injuries per 100 FTE employees. These injuries resulted in 24,099 days lost from work. [5]
- The underground nonfatal lost-time injury rate was greater than the surface injury rate (4.1 [CI: 3.5, 4.7] vs. 1.5 [CI: 1.3, 1.7] per 100 FTE workers).
- The most frequent classification of nonfatal lost-time injuries for coal contractor employees involved slip or fall of person (n=147; 30.6%), followed by handling materials (n=131; 27.2%).
- Sprains and strains were the most frequently reported nature of injury (n=160; 33.3%).
- The back was the most frequently reported body part injured (n=73; 15.2%) and accounted for 3,265 days lost from work.
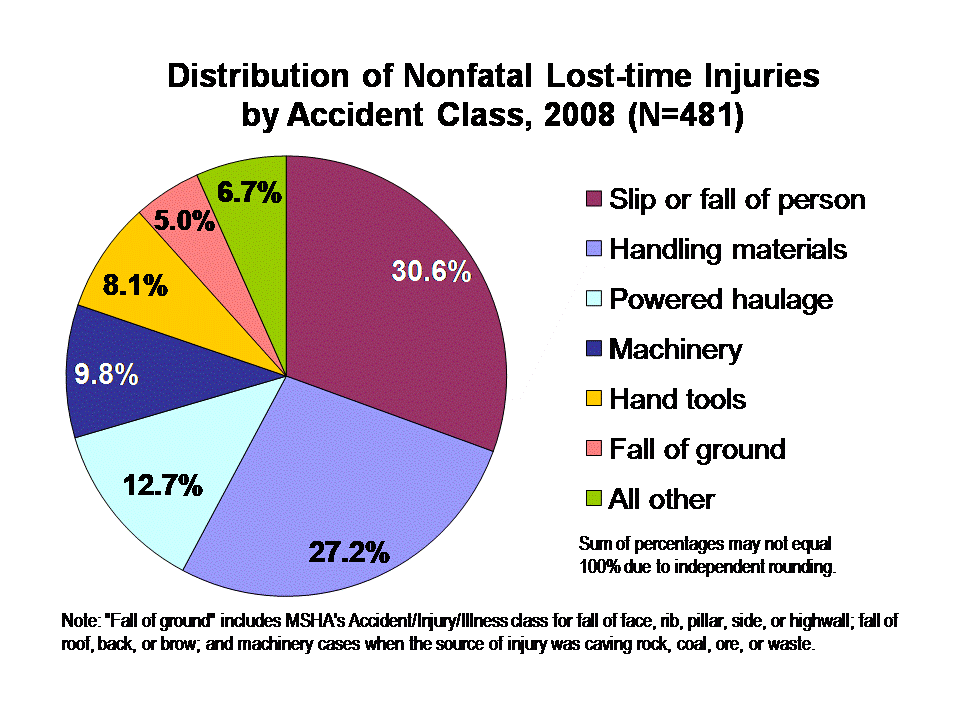
| Accident Class | Percent |
|---|---|
| Slip or fall of person | 30.6 |
| Handling materials | 27.2 |
| Powered haulage | 12.7 |
| Machinery | 9.8 |
| Hand tools | 8.1 |
| Fall of ground | 5.0 |
| All other | 6.7 |
Mining operations, 2008
| Commodity and Type of Employer | Underground Mining Operations | Surface Mining Operations | Total Mining Operations |
|---|---|---|---|
| Coal | 665 | 1,464 | 2,129 |
| Metal | 105 | 188 | 293 |
| Nonmetal | 44 | 676 | 720 |
| Stone | 111 | 4,522 | 4,633 |
| Sand & Gravel | Not applicable | 7,132 | 7,132 |
| Total | 925 | 13,982 | 14,907 |
Contracting companies, 2008
| Commodity and Type of Employer | Number of Companies |
|---|---|
| Coal | 3,467 |
| Noncoal | 6,128 |
| Total | 9,595 |
Employment characteristics, 2008
| Commodity and Type of Employer | Underground Employees [1] | Surface Employees [1] | Total Employees [1] | Underground FTE Employees [2] | Surface FTE Employees [2] | Total FTE Employees [2] |
|---|---|---|---|---|---|---|
| Coal Operator | 40,370 | 49,685 | 90,055 | 45,866 | 54,312 | 100,178 |
| Metal Operator | 5,844 | 33,282 | 39,126 | 5,842 | 34,840 | 40,682 |
| Nonmetal Operator | 2,579 | 20,454 | 23,033 | 2,725 | 20,534 | 23,260 |
| Stone Operator | 1,875 | 77,100 | 78,975 | 2,029 | 74,720 | 76,749 |
| Sand & Gravel Operator | Not applicable | 42,307 | 42,307 | Not applicable | 33,343 | 33,343 |
| Operator Total | 50,668 | 222,828 | 273,496 | 56,462 | 217,750 | 274,212 |
| Coal Contractor | 6,262 | 37,510 | 43,772 | 4,105 | 22,216 | 26,321 |
| Noncoal Contractor | 2,992 | 74,459 | 75,451 | 1,998 | 38,088 | 40,086 |
| Contractor Total | 9,254 | 109,969 | 119,223 | 6,103 | 60,304 | 66,407 |
| Total | 59,922 | 332,797 | 392,719 | 62,565 | 278,054 | 340,620 |
Mining Occupational Fatalities (per 100,000 FTE employees), 2008
| Commodity and Type of Employer | Underground Fatalities | Underground Fatality Rate | Surface Fatalities | Surface Fatality Rate | Fatalities | Fatality Rate |
|---|---|---|---|---|---|---|
| Coal Operator | 12 | 26.2 | 6 | 11.9 | 18 | 18.7 |
| Metal Operator | 3 | Not calculated | 2 | Not calculated | 5 | 13.8 |
| Nonmetal Operator | 1 | Not calculated | 1 | Not calculated | 2 | Not calculated |
| Stone Operator | 1 | Not calculated | 6 | 9.4 | 7 | 10.6 |
| Sand & Gravel Operator | Not applicable | Not applicable | 3 | Not calculated | 3 | Not calculated |
| Operator Total | 17 | 30.1 | 18 | 9.4 | 35 | 14.2 |
| Coal Contractor | 3 | Not calculated | 9 | 43.4 | 12 | 48.3 |
| Noncoal Contractor | 0 | Not calculated | 5 | 13.9 | 5 | 13.2 |
| Contractor Total | 3 | Not calculated | 14 | 24.7 | 17 | 27.1 |
| Total | 20 | 32.0 | 32 | 12.9 | 52 | 16.8 |
Nonfatal Lost-time Injuries (per 100 FTE employees), 2008
| Commodity and Type of Employer | Underground Injuries | Underground Injury Rate | Surface Injuries | Surface Injury Rate | Injuries | Injury Rate |
|---|---|---|---|---|---|---|
| Coal Operator | 2,103 | 4.6 | 768 | 1.5 | 2,871 | 3.0 |
| Metal Operator | 163 | 2.8 | 649 | 2.1 | 812 | 2.2 |
| Nonmetal Operator | 95 | 3.5 | 412 | 2.4 | 507 | 2.5 |
| Stone Operator | 33 | 1.6 | 1,593 | 2.5 | 1,626 | 2.5 |
| Sand & Gravel Operator | Not applicable | Not applicable | 550 | 1.9 | 550 | 1.9 |
| Operator Total | 2,972 | 4.2 | 3,972 | 2.1 | 6,366 | 2.6 |
| Coal Contractor | 168 | 4.1 | 313 | 1.5 | 481 | 1.9 |
| Noncoal Contractor | 38 | 1.9 | 463 | 1.3 | 501 | 1.3 |
| Contractor Total | 206 | 3.4 | 776 | 1.4 | 982 | 1.6 |
| Total | 2,600 | 4.2 | 4,748 | 1.9 | 7,348 | 2.4 |
Not calculated when N is less than 5. 95% CI for rates reported above. Totals may not sum due to independent rounding.
Data source: Publicly released employment and accident/injury/illness data collected by MSHA under 30 CFR 50.
Notes: All analyses of accident data exclude office employees. Occupational fatalities exclude all cases under 17 years of age. Further statistical methodology is available on the NIOSH Internet. Caution should be used when interpreting rates based on a small number of events.
- Average number of employees working at individual mines during calendar quarters of active operations (includes office workers).
- Full-time equivalent employees computed using reported employee hours (2,000 hours = 1 FTE).
- Mining sectors include coal operators, metal operators, nonmetal operators, stone operators, sand and gravel operators, coal contractors, and noncoal contractors.
- Surface work location include surface operations at underground mines, surface operations (strip or open pit), auger, culm banks, dredge. independent shops and yards, and mills or preparation plants.
- Includes actual days away from work and/or days of restricted work activity. For permanently disabling injuries only, statutory days charged by MSHA were used if they exceeded the total lost workdays.
To receive NIOSH documents or more information about occupational safety and health topics, contact NIOSH at 1-800-CDC-INFO (1-800-232-4636), TTY: 1-888-232-6348, or visit NIOSH's Ask an Occupational Safety and Health Question page.
- Coal and metal/nonmetal mining facts - 2008
- Coal and Metal/Nonmetal Mining Facts - 2008 (HTML)
- Coal Contractor Mining Facts - 2001
- Coal Contractor Mining Facts - 2002
- Coal Contractor Mining Facts - 2003
- Coal Contractor Mining Facts - 2004
- Coal Contractor Mining Facts - 2005
- Coal Contractor Mining Facts - 2006
- Mining Fact Sheets
- Rib Falls: A Major Ground Control Issue