Mining Publication: Sand and Gravel Mining Facts - 2001
Original creation date: July 2003
Authors: National Institute for Occupational Safety and Health
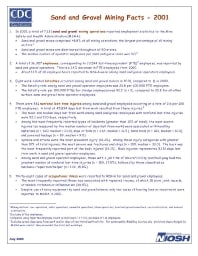
In 2001, a total of 7,131 sand and gravel mining operations reported employment statistics to the Mine Safety and Health Administration (MSHA). Sand and gravel mines comprised 48.8% of all mining operations, the largest percentage of all mining sectors. Sand and gravel mines are distributed throughout all 50 states. The median number of operator employees per sand and gravel mine was 3.0. 2. A total of 36,957 employees, corresponding to 33,544 full-time equivalent (FTE) employees, was reported by sand and gravel operators. This is a 1.4% decrease in FTE employees from 2000. About 12% of all employee hours reported to MSHA were among sand and gravel operators employees. 3. Eight work-related fatalities occurred among sand and gravel miners in 2001, compared to 11 in 2000. The fatality rate among sand and gravel operator employees was 23.8 per 100,000 FTE employees. The fatality rate per 100,000 FTEs for dredge employees was 42.5 (n = 2), compared to 20.8 for all other surface sand and gravel mine operator employees. 4. There were 881 nonfatal lost-time injuries among sand and gravel employees occurring at a rate of 2.6 per 100 FTE employees. A total of 45,894 days lost from work resulted from these injuries. The mean and median days lost from work among sand and gravel employees with nonfatal lost-time injuries were 52.1 and 11.0 days, respectively. Among the most frequently reported types of incidents (greater than 10% of total), the most severe injuries (as measured by the median number of days lost from work) were associated with handling materials (n = 320, median = 13.0), slips or falls (n = 232, median = 12.5), hand tools (n = 103, median = 10.0), and powered haulage (n = 89, median = 9.0). Sprains and strains were the most prevalent injury (41.2%). Among those injury categories with greater than 10% of total injuries, the most severe was fractures and chips (n = 100, median = 33.0). The back was the most frequently reported part of the body injured (19.1%). Back injuries represented 5,151 days lost from work in sand and gravel operator employees. Among sand and gravel operator employees, those with a job title of laborer/utility man/bull gang had the greatest number of nonfatal lost-time injuries (n = 150, 17.0%), followed by those classified as mechanic/repairman/helper (n = 139, 15.8%). 5. Thirty-eight cases of occupational illness were reported to MSHA for sand and gravel employees. The most frequently reported illness was associated with repeated trauma, of which 15 were joint, muscle, or tendon irritation or inflammation (39.5%). Despite use of noisy equipment by sand and gravel miners, only two cases of hearing loss or impairment were reported to MSHA in 2001.
- Coal and metal/nonmetal mining facts - 2008
- Coal and Metal/Nonmetal Mining Facts - 2008 (HTML)
- Coal Contractor Mining Facts - 2001
- Coal Contractor Mining Facts - 2002
- Coal Contractor Mining Facts - 2003
- Coal Contractor Mining Facts - 2004
- Coal Contractor Mining Facts - 2005
- Coal Contractor Mining Facts - 2006
- Mining Fact Sheets
- Rib Falls: A Major Ground Control Issue