Mining Publication: Metal Operator Mining Facts - 2008
Original creation date: March 2011
Authors: National Institute for Occupational Safety and Health
NIOSHTIC2 Number: 20039160
Pittsburgh, PA: U. S. Department of Health and Human Services, Public Health Service, Centers for Disease Control and Prevention, National Institute for Occupational Safety and Health, DHHS (NIOSH) Publication No. 20111-164, 2011 Mar; :1-2
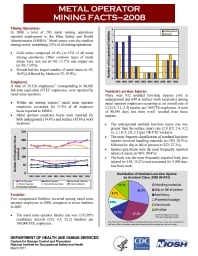
Mining Operations: In 2008, a total of 293 metal mining operations reported employment to the Mine Safety and Health Administration (MSHA). Metal mines were the smallest mining sector, comprising 2.0% of all mining operations. 1. Gold mines comprised 45.4% (n=133) of all metal mining operations. Other common types of metal mines were iron ore (n=40; 13.7%) and copper ore (n=38; 13.0%). 2. Nevada had the largest number of metal mines (n=47; 16.0%), followed by Alaska (n=32; 10.9%). Employees: A total of 39,126 employees, corresponding to 40,682 full-time equivalent (FTE) employees, were reported by metal mine operators. 1. Within the mining sectors, metal mine operator employees accounted for 11 .9% of all employee hours reported to MSHA. 2. Metal operator employee hours were reported for both underground (14.4%) and surface (85.6%) work locations. Fatalities: Five occupational fatalities occurred among metal mine operator employees in 2008, compared to seven fatalities in 2007. 1. The metal mine operator fatality rate was 13.8 [95% confidence interval (CI): 4.5, 32.2] fatalities per 100,000 FTE employees. Nonfatal Lost-time Injuries: There were 812 nonfatal lost-time injuries (163 at underground and 649 at surface work locations) among metal operator employees occurring at an overall rate of 2.2 [CI: 2.1, 2.4] injuries per 100 FTE employees. A total of 40,598 days lost from work resulted from these injuries. 1. The underground nonfatal lost-time injury rate was greater than the surface injury rate (2.8 [CI: 2.4, 3.2] vs. 2.1 [CI: 2.0, 2.3] per 100 FTE workers). 2. The most frequent classification of nonfatal lost-time injuries involved handling materials (n=230; 28.3%), followed by slip or fall of person (n=222; 27.3%). 3. Sprains and strains were the most frequently reported nature of injury (n=401; 49.4%). 4. The back was the most frequently reported body part injured (n=148; 18.2%) and accounted for 5,409 days lost from work.
NIOSHTIC2 Number: 20039160
Pittsburgh, PA: U. S. Department of Health and Human Services, Public Health Service, Centers for Disease Control and Prevention, National Institute for Occupational Safety and Health, DHHS (NIOSH) Publication No. 20111-164, 2011 Mar; :1-2
- Coal and metal/nonmetal mining facts - 2008
- Coal and Metal/Nonmetal Mining Facts - 2008 (HTML)
- Coal Contractor Mining Facts - 2001
- Coal Contractor Mining Facts - 2002
- Coal Contractor Mining Facts - 2003
- Coal Contractor Mining Facts - 2004
- Coal Contractor Mining Facts - 2005
- Coal Contractor Mining Facts - 2006
- Mining Fact Sheets
- Rib Falls: A Major Ground Control Issue