Suicide
The content on this page was last updated in June 2023. More recent estimates and visualizations may be available from the NCHS Data Query System.
Suicide rates increased steadily over the past 2 decades before decreasing from 2018 to 2019 (1). In 2019, suicide was the 10th leading cause of death in the United States—accounting for 47,511 deaths overall. Suicide is a significant cause of premature death because it is the second leading cause of death among people aged 10–14, 15–24, and 25–34 (Table LCODAge) (2).
Key Findings

From 2009 to 2019, the age-adjusted suicide rate increased from 11.8 per 100,000 to 13.9; however, the rate in 2019 was lower than the rate in 2018 (14.2). See Featured Charts for additional analysis.
SOURCE: National Center for Health Statistics, National Vital Statistics System, Mortality. See Sources and Definitions, National Vital Statistics System (NVSS) and Health, United States, 2020–2021 Table SuicMort.
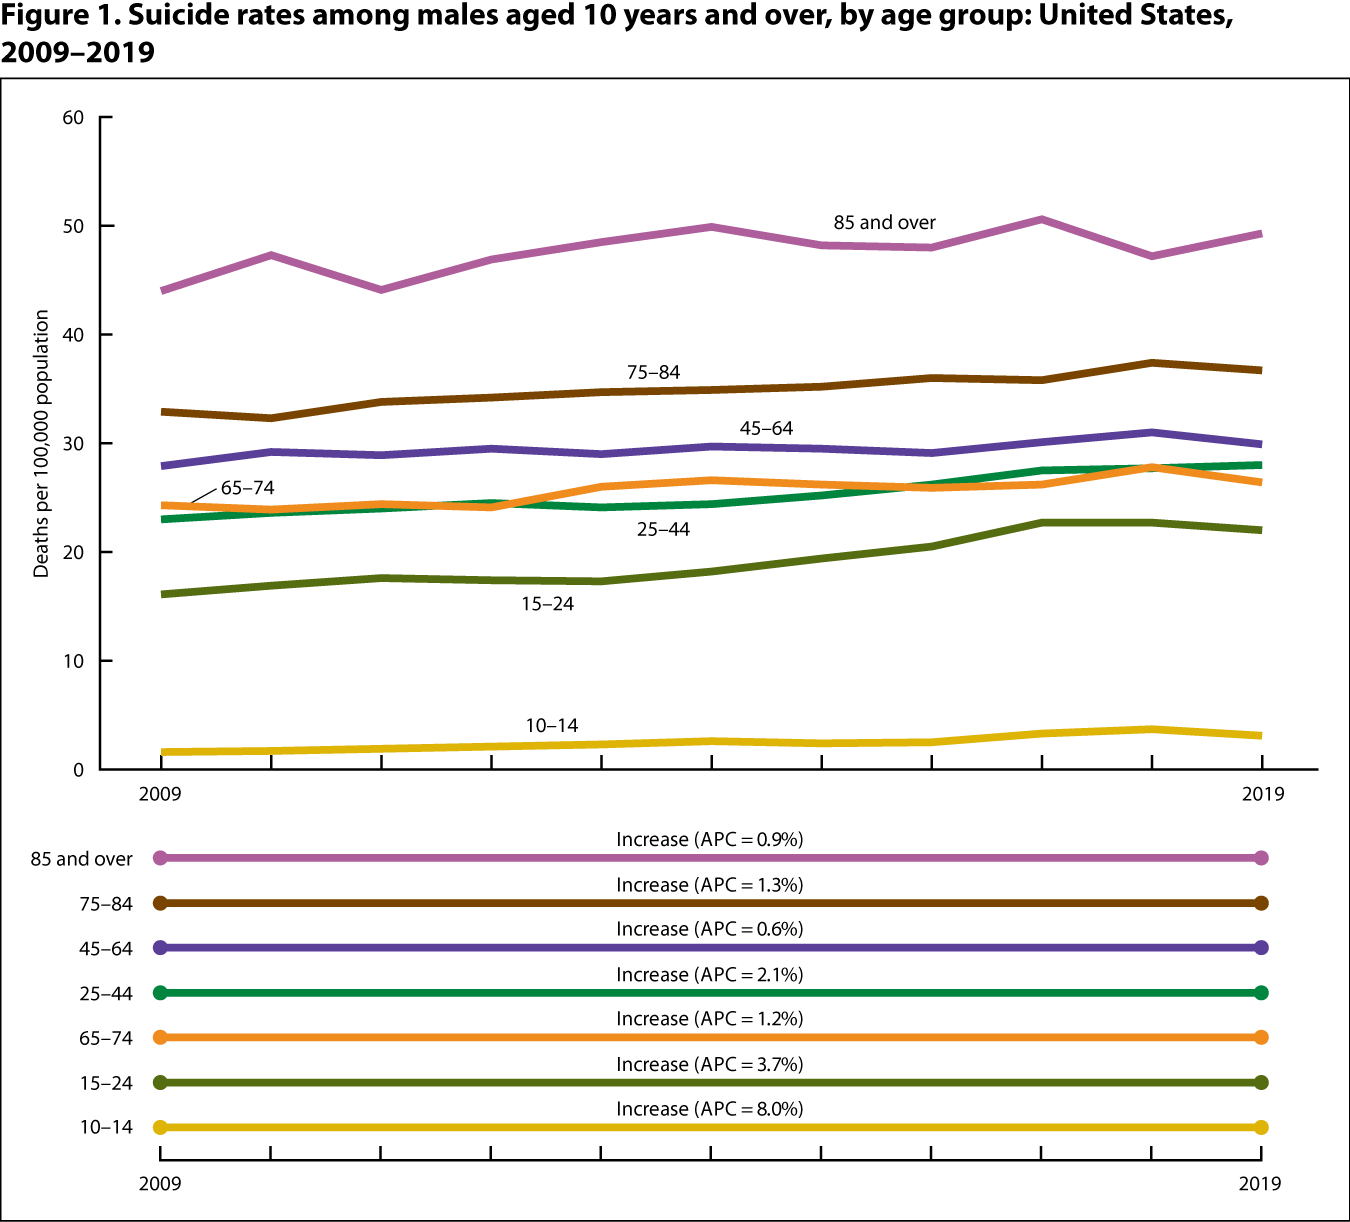
From 2009 to 2019, suicide rates among males increased for all age groups. Rates in 2019 were lower than in 2018 for several age groups.

NOTE: APC is annual percent change.
SOURCE: National Center for Health Statistics, National Vital Statistics System, Mortality. See Sources and Definitions, National Vital Statistics System (NVSS) and Health, United States, 2020–2021 Table SuicMort.
- Among males, suicide rates were highest among men aged 85 and over, increasing from 44.0 deaths per 100,000 in 2009 to 49.3 in 2019.
- Among males, suicide rates were lowest among adolescent boys aged 10–14 years, increasing from 1.6 deaths per 100,000 in 2009 to 3.1 in 2019.
- Male suicide rates in 2019 were lower than the rates in 2018 for age groups 10–14, 45–64, and 65–74. For males in all other age groups, no difference was seen between 2018 and 2019 estimates.
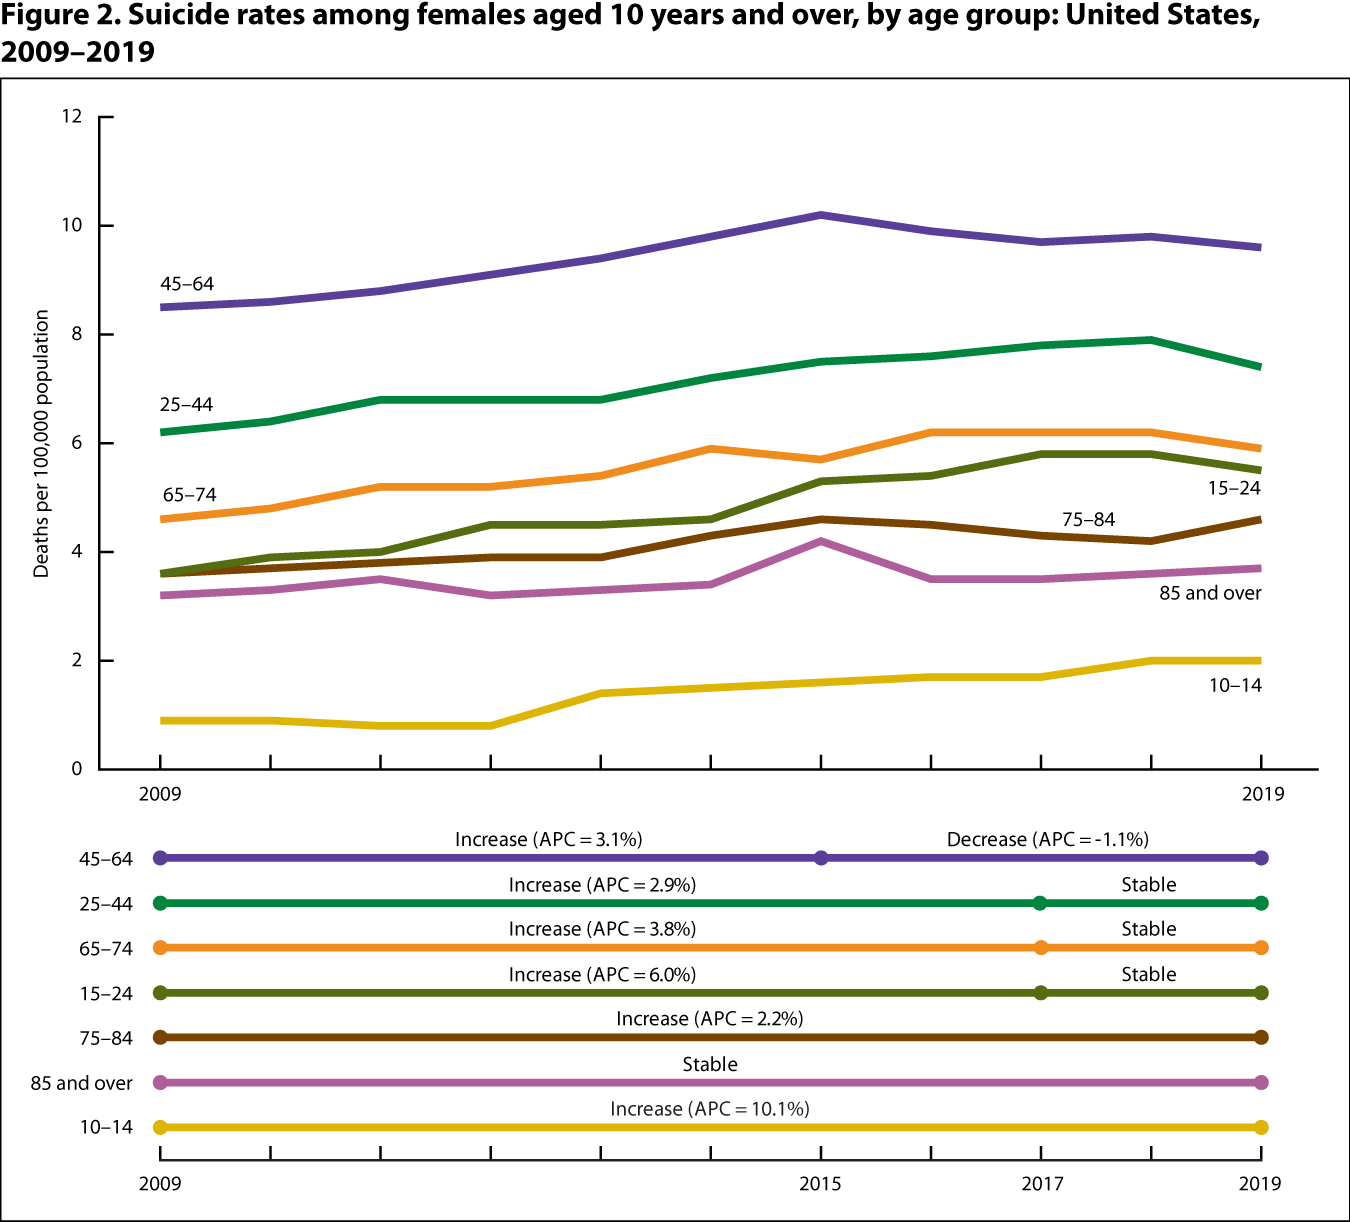
From 2009 to 2019, suicide rates among females generally increased for all age groups, although rates have decreased since 2015 for women aged 45–64.

NOTES: APC is annual percent change. “Stable” refers to no statistically significant trend during the period.
SOURCE: National Center for Health Statistics, National Vital Statistics System, Mortality. See Sources and Definitions, National Vital Statistics System (NVSS) and Health, United States, 2020–2021 Table SuicMort.
- Among females, suicide rates were highest among women aged 45–64, increasing from 8.5 deaths per 100,000 in 2009 to 10.2 in 2015, and then decreasing to 9.6 in 2019.
- Among females, suicide rates were lowest among adolescent girls aged 10–14 years, increasing from 0.9 deaths per 100,000 in 2009 to 2.0 in 2019.
- Female suicide rates in 2019 were lower than in 2018 for women aged 25–44. For females in all other age groups, no difference was seen between 2018 and 2019 estimates.
Download the data
Suicide rates, by sex, race, Hispanic origin, and age: United States, selected years 1950–2019
SOURCE: National Center for Health Statistics, National Vital Statistics System, Mortality.
Age-adjusted death rates for selected causes of death, by sex, race, and Hispanic origin: United States, selected years 1950–2019
SOURCE: National Center for Health Statistics, National Vital Statistics System, Mortality.
Leading causes of death and numbers of deaths, by age: United States, 1980 and 2019
SOURCE: National Center for Health Statistics, National Vital Statistics System, Mortality.
Leading causes of death and numbers of deaths, by sex, race, and Hispanic origin: United States, 1980 and 2019
SOURCE: National Center for Health Statistics, National Vital Statistics System, Mortality.
- Leading causes of death: Ranked according to the number of deaths. See Sources and Definitions, Cause of death; Cause-of-death ranking.
- Suicide deaths: Identified using International Classification of Diseases, 10th Revision (ICD–10) underlying cause-of-death codes *U03, X60–X84, and Y87.0. See Sources and Definitions, Cause of death; International Classification of Diseases (ICD).
- Hedegaard H, Curtin SC, Warner M. Suicide mortality in the United States, 1999– NCHS Data Brief, no 398. Hyattsville, MD: National Center for Health Statistics. 2021.
- CDC web-based injury statistics query and reporting system (WISQARS). Leading causes of death reports, 1981– 2021. Available from: https://webappa.cdc.gov/sasweb/ncipc/leadcause.html.

