NCHS Data on Drug Overdose Deaths
NCHS Fact Sheet, June 2021
About NCHS
The National Center for Health Statistics (NCHS) is the nation’s principal health statistics agency, providing data to identify and address health issues. NCHS compiles statistical information to help guide public health and health policy decisions.
Collaborating with other public and private health partners, NCHS uses a variety of data collection mechanisms to obtain accurate information from multiple sources. This process provides a broad perspective on the population’s health, influences on health, and health outcomes.
NCHS drug overdose data
NCHS uses the National Vital Statistics System (NVSS) to monitor deaths due to drug overdose. NVSS collects mortality information from death certificates in all 50 states and the District of Columbia. NCHS identifies the number of drug overdose deaths using the underlying cause-of-death information from death certificates. Multiple causes of death are used to identify deaths involving specific drugs. In 2019, approximately 6% of death certificates for drug overdose deaths lacked information on the specific drugs involved.
Recent findings
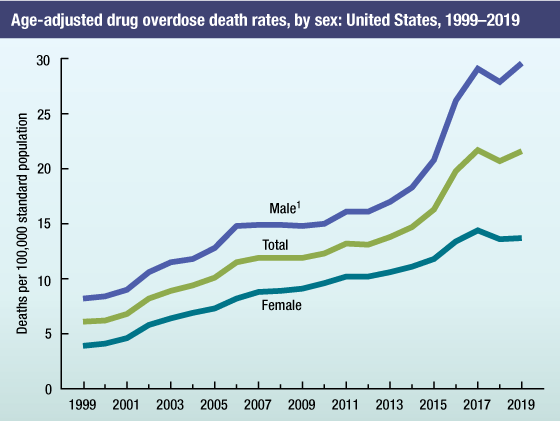
- The age-adjusted rate of drug overdose deaths increased from 1999 through 2017, with different rates of change over time. The rate in 2019 (21.6 per 100,000) was significantly higher than the rate in 2018 (20.7), but similar to the rate in 2017 (21.7).
- The rate of drug overdose deaths involving cocaine increased from 1.4 in 1999 to 2.5 in 2006, then decreased to 1.4 in 2012. From 2012 through 2019, the rate more than tripled from 1.4 in 2012 to 4.9 in 2019.
Who is most at risk?
- The age-adjusted rate of drug overdose deaths was higher for males than females from 1999 through 2019.
- For males, the rate increased from 8.2 per 100,000 in 1999 to 29.1 in 2017, decreased to 27.9 in 2018, and increased to 29.6 in 2019. The rate for males in 2019 was significantly higher than the rate in 2017 and 2018.
- For females, the rate increased from 3.9 in 1999 to 14.4 in 2017, then decreased to 13.6 in 2018 and 13.7 in 2019. The rate for females in 2019 was not significantly different from the rate in 2018, and was lower than the rate in 2017.

1Rates for males were significantly higher than rates for females for all years, p < 0.05.
NOTES: Significant increasing trend from 1999 through 2017, with different rates of change over time for all groups, p < 0.05. Drug overdose deaths are identified using the International Classification of Diseases, 10th Revision underlying cause-of-death codes X40–X44, X60–X64, X85, and Y10–Y14.
Age-adjusted death rates were calculated using the direct method and the 2000 U.S. standard population. The number of drug overdose deaths in 2019 was 70,630. Access data table for this figure at:https://www.cdc.gov/nchs/data/databriefs/db394-tables-508.pdf#1.
SOURCE: National Center for Health Statistics, National Vital Statistics System, Mortality.
Urban-rural differences in drug overdose death rates
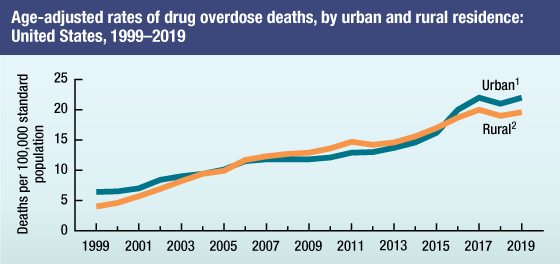
From 2016 through 2019, age-adjusted drug overdose death rates were higher in urban counties than in rural counties.
- The age-adjusted rate of drug overdose deaths in urban counties increased from 6.4 per 100,000 in 1999 to 22.0 in 2019; the age-adjusted rate in rural counties increased from 4.0 to 19.6.
- Rates were higher in urban than in rural counties from 1999 through 2003 and from 2016 through 2019. From 2007 through 2015, rates were higher in rural counties.

1Significant increasing trend from 1999 to 2017, with different rates of change over time; stable trend from 2017 through 2019, p < 0.05.
2Significant increasing trend from 1999 through 2019, with different rates of change over time, p < 0.05.
NOTES: Drug overdose deaths were identified using International Classification of Diseases, 10th Revision underlying cause-of-death codes X40–X44, X60–X64, X85, and Y10–Y14. Age-adjusted death rates were calculated using the direct method and the 2000 U.S. standard population. Decedent’s county of residence was classified as urban or rural based on the 2013 NCHS Urban–Rural Classification Scheme for Counties. Access data table for this figure at: https://www.cdc.gov/nchs/data/databriefs/db403-tables-508.pdf#1.
SOURCE: National Center for Health Statistics, National Vital Statistics System, Mortality.
Drug overdose death rates by opioid category
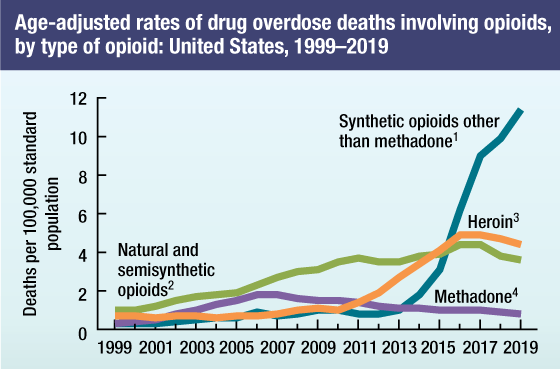
- The rate of drug overdose deaths involving synthetic opioids other than methadone, which include drugs such as fentanyl, fentanyl analogs, and tramadol, increased from 1.0 per 100,000 in 2013 to 11.4 in 2019.
- The rate of drug overdose deaths involving heroin was stable from 1999 through 2005, then increased from 0.7 in 2005 to 4.9 in 2016 and 2017. From 2016 through 2019, the rate decreased from 4.9 to 4.4.
- The rate of drug overdose deaths involving natural and semisynthetic opioids, which include drugs such as oxycodone and hydrocodone, increased from 1.0 in 1999 to 3.7 in 2011, then increased again to 4.4 in 2016 and 2017. The rates in 2018 (3.8) and 2019 (3.6) were lower than the rate in 2017 (4.4).
- The rate of drug overdose deaths involving methadone increased from 0.3 in 1999 to 1.8 in 2006 and 2007. From 2006 through 2019, the rate decreased on average by 6% per year (from 1.8 to 0.8).

1Significant increasing trend from 1999 through 2006 and 2013 through 2019, with different rates of change over time, p < 0.05.
2Significant increasing trend from 1999 through 2017, with different rates of change over time, p < 0.05.
3Significant increasing trend from 2005 to 2016, with different rates of change over time, then significant decreasing trend from 2016 through 2019, p < 0.05.
4Significant increasing trend from 1999 to 2006, with different rates of change over time, then significant decreasing trend from 2006 through 2019, 0.05.
NOTE: Access data table for this figure at: https://www.cdc.gov/nchs/data/databriefs/db394-tables-508.pdf#3.
SOURCE: National Center for Health Statistics, National Vital Statistics System, Mortality.
Challenges and future opportunities
- Work with medical examiners and coroners to improve timeliness of reporting drug overdose deaths
- Improve reporting of the specific drug(s) involved in drug overdose deaths on the death certificate
- Enhance capacity to search the cause-of-death description on the death certificate for drug mentions
- Improve automated cause-of-death coding systems for faster reporting
- Explore opportunities to link electronic death records to electronic health records
- Develop capacity to support monthly reporting of drug overdose deaths; monthly provisional estimates can be found at: https://www.cdc.gov/nchs/nvss/vsrr/drug-overdose-data.htm.
For more information about NCHS, visit https://www.cdc.gov/nchs.
For more information about NVSS, visit https://www.cdc.gov/nchs/nvss.htm.