Strategic Plan Indicator Dashboard
The National Center for HIV/AIDS, Viral Hepatitis, STD, and TB Prevention Strategic Plan includes 3 goals and 31 indicators of trends since 2010 toward 2020 targets for its goals of decreasing incidence of infection, decreasing morbidity and mortality, and decreasing health disparities by sex, race/ethnicity, age-group, geographic residence, and sexual behavior. According to the most recent data, three-fourths of the indicators related to HIV, viral hepatitis, STDs, TB, and youth risk behaviors have made progress toward meeting their 2020 targets. For example, the data show progress in reducing new diagnoses of HIV, which declined 14% from 2010 to 2016, and the lowest rate recorded for tuberculosis in 2016. But rates for acute hepatitis C diagnoses rose during the period, largely due to the nation’s opioid epidemic.
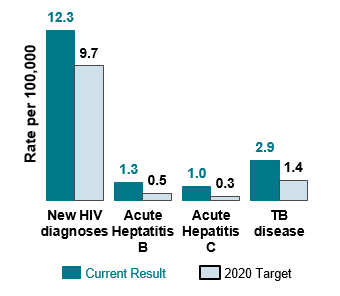
Example Indicator: Rate per 100,000 of new diagnoses
| Infection Type | Current Result | 2020 Target |
|---|---|---|
| HIV | 12.3 | 9.7 |
| Acute Hepatitis B | 1.3 | 0.5 |
| Acute Hepatitis C | 1.0 | 0.3 |
| TB | 2.9 | 1.4 |
Goal 1 current result year is 2016 for HIV, acute hepatitis B and C, and TB disease
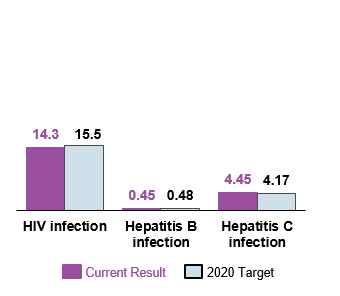
Example Indicator: Reduce deaths for people diagnosed with HIV, Hepatitis B, and Hepatitis C
| Infection Type | Current Result | 2020 Target |
|---|---|---|
| HIV | 14.3 | 15.5 |
| Hepatitis B | 0.45 | 0.48 |
| Hepatitis C | 4.45 | 4.17 |
Goal 2 current result year is 2015 for HIV; 2016 for hepatitis B and C infections
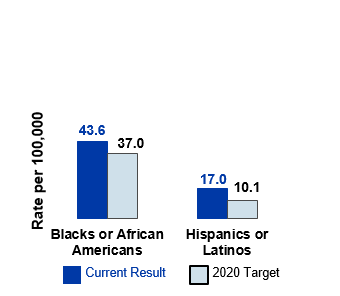
Example Indicator: Rate per 100,000 of new HIV diagnoses by race/ethnicity
| Group | Current Result | 2020 Target |
|---|---|---|
| Blacks or African Americans | 43.6 | 37.0 |
| Hispanics or Latinos | 17.0 | 10.1 |
Goal 3 current result year is 2016