
Discover the three dimensions of disability and learn about related health conditions.
Access state-level health and demographic data about adults with disabilities.
An overview of what disability inclusion means and the health of people with disabilities.
Learn how to prepare for emergencies and stay safe.
Featured
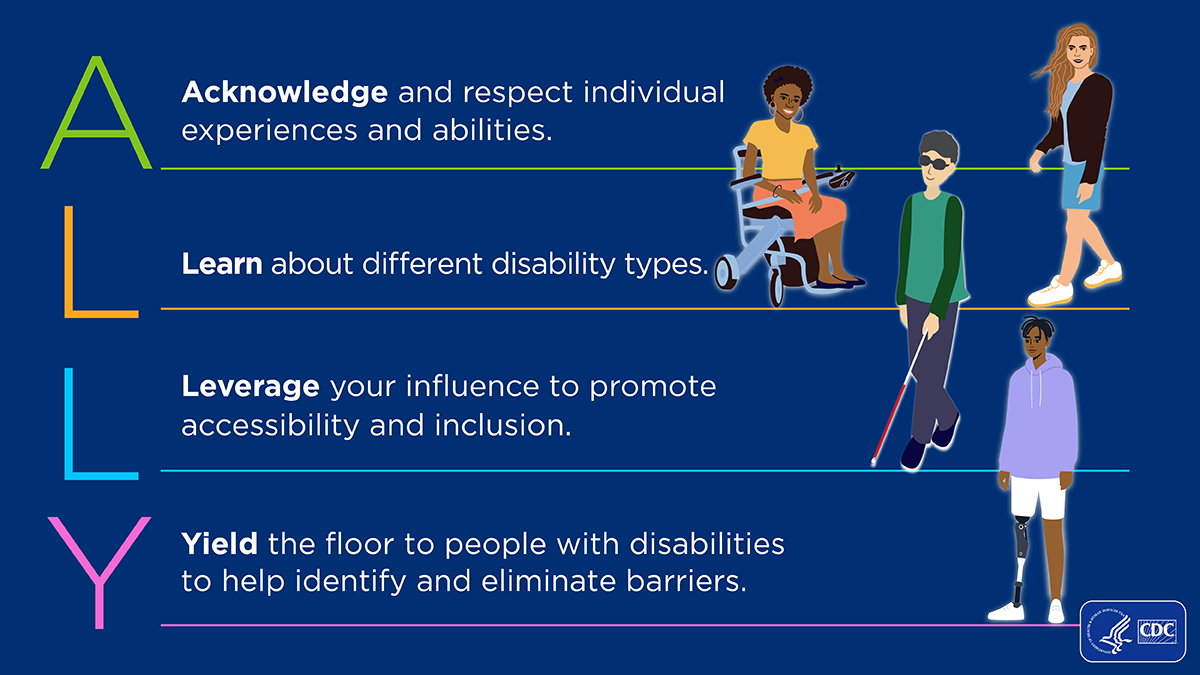
Advocate for accessibility and equitable health with resources, images, and social media content.
Disability and health profiles across the states and territories.
Materials tailored and tested to promote healthy behaviors for people with disabilities.
Information for specific groups
Health programs, educational materials, data, initiatives, and inclusion for people with disabilitie
Access information and resources for people with disabilities.
Read how to help care for someone with a disability.
Read about inclusive healthcare practices for healthcare providers.