Using Medicaid Data to Characterize Persons with Intellectual and Developmental Disabilities in Five U.S. States
An article in the American Journal on Intellectual and Developmental Disabilities used Medicaid data from 2008-2013 to identify and describe people with intellectual or developmental disability (IDD) in five states (Delaware, Iowa, Massachusetts, New York, and South Carolina). Many people with disabilities are insured through Medicaid, so this study’s results can help states plan for services for this important population. The researchers found that about 11.4 million people were insured through Medicaid in these states, and about 1 in 35 were found to have IDD, ranging from 1 in 42 in New York to 1 in 24 in South Carolina.
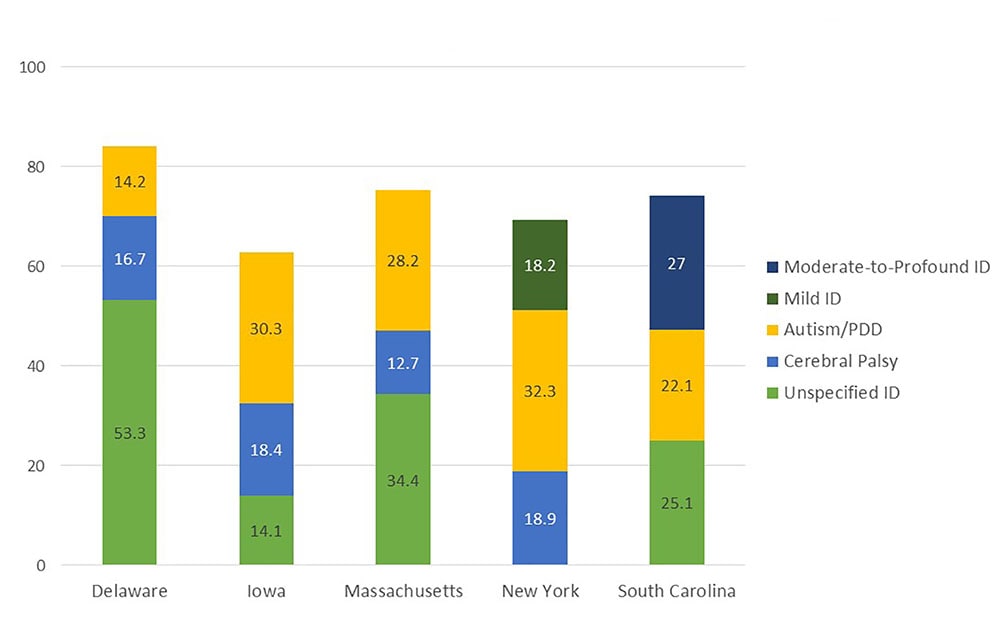
Percentages of Top 3 IDD Diagnoses for Medicaid Users with IDD by State
(2008-2013)*

| Delaware | Iowa | Massachusetts | New York | South Carolina | |
|---|---|---|---|---|---|
| % | % | % | % | % | |
| Moderate-to-Profound ID | – | – | – | – | 27% |
| Mild ID | – | – | – | 18.2% | – |
| Autism/PDD | 14.2% | 30.3% | 28.2% | 32.3% | 22.1% |
| Cerebral Palsy | 16.7% | 18.4% | 12.7% | 18.9% | – |
| Unspecified ID | 53.5% | 14.1% | 34.4% | – | 25.1% |
Remaining IDD Diagnoses of Medicaid Members by State (2008-2013)
Delaware: Moderate-to-Profound ID (4.7%), Mild ID (3.0%), Fetal Alcohol Syndrome (0.0%), Other Genetic Conditions (1.5%), Down Syndrome or Trisomy/Autosomal Deletions (6.4%)
Iowa: Moderate-to-Profound ID (8.5%), Mild ID (12.5%), Fetal Alcohol Syndrome (1.7%), Other Genetic Conditions (2.3%), Down Syndrome or Trisomy/Autosomal Deletions (12.3%)
Massachusetts: Moderate-to-Profound ID (5.3%), Mild ID (8.0%), Fetal Alcohol Syndrome (0.6%), Other Genetic Conditions (2.6%), Down Syndrome or Trisomy/Autosomal Deletions (8.2%)
New York: Unspecified ID (5.9%), Moderate-to-Profound ID (12.9%), Fetal Alcohol Syndrome (0.6%), Other Genetic Conditions (2.2%), Down Syndrome or Trisomy/Autosomal Deletions (9.1%)
South Carolina: Mild ID (7.5%), Cerebral Palsy (11.3%), Fetal Alcohol Syndrome (0.3%), Other Genetic Conditions (1.1%), Down Syndrome or Trisomy/Autosomal Deletions (5.4%)
Of these Medicaid members, the most frequent IDD diagnoses were Unspecified Intellectual Disability, Autism or Pervasive Developmental Disorder (AU/PDD), and Cerebral Palsy (CP).
- 1 in 79 had Intellectual Disability
- 1 in 117 had AU/PDD
- 1 in 225 had CP
The percentage of Medicaid members with IDD who were enrolled in both Medicaid and another health plan (commercial insurance or Medicare) ranged from about 1 in 4 in Delaware to about 1 in 3 in South Carolina.
About This Study
This study looked at people who were enrolled in Medicaid for at least one calendar year from 2008 to 2013. The researchers used ICD-9-CM diagnostic codes (International Statistical Classification of Diseases and Related Health Problems 9th Revision) to sort people with different IDD diagnoses, like Down syndrome, autism, and fetal alcohol syndrome, within each state.
Identifying and characterizing people with IDD is the first step toward a deeper understanding of this population’s healthcare needs. Medicaid data provide helpful information for describing people living with IDD and for tracking healthcare utilization, the quality of care received, and the effects of health policy and healthcare interventions.
For More Information
- Read the article hereexternal icon
- CDC’s Disability and Health webpage
- CDC’s work on developmental disabilities
- Resources for people with developmental disabilities
References
Using Medicaid Data to Characterize Persons with Intellectual and Developmental Disabilities in Five U.S. States. 2018.
Suzanne McDermott, Julie Royer, Tara Cope, Scott Lindgren, Elizabeth Momany, Jae Chul Lee, Mary Joan McDuffie, Emily Lauer, Stephen Kurtz, Brian Armour.
American Journal on Intellectual and Developmental Disabilities: July 2018, Vol. 123, No. 4, pp. 371-381.
