Monitoring Selected National HIV Prevention and Care Objectives By Using HIV Surveillance Data United States and 6 Dependent Areas, 2019: Figures
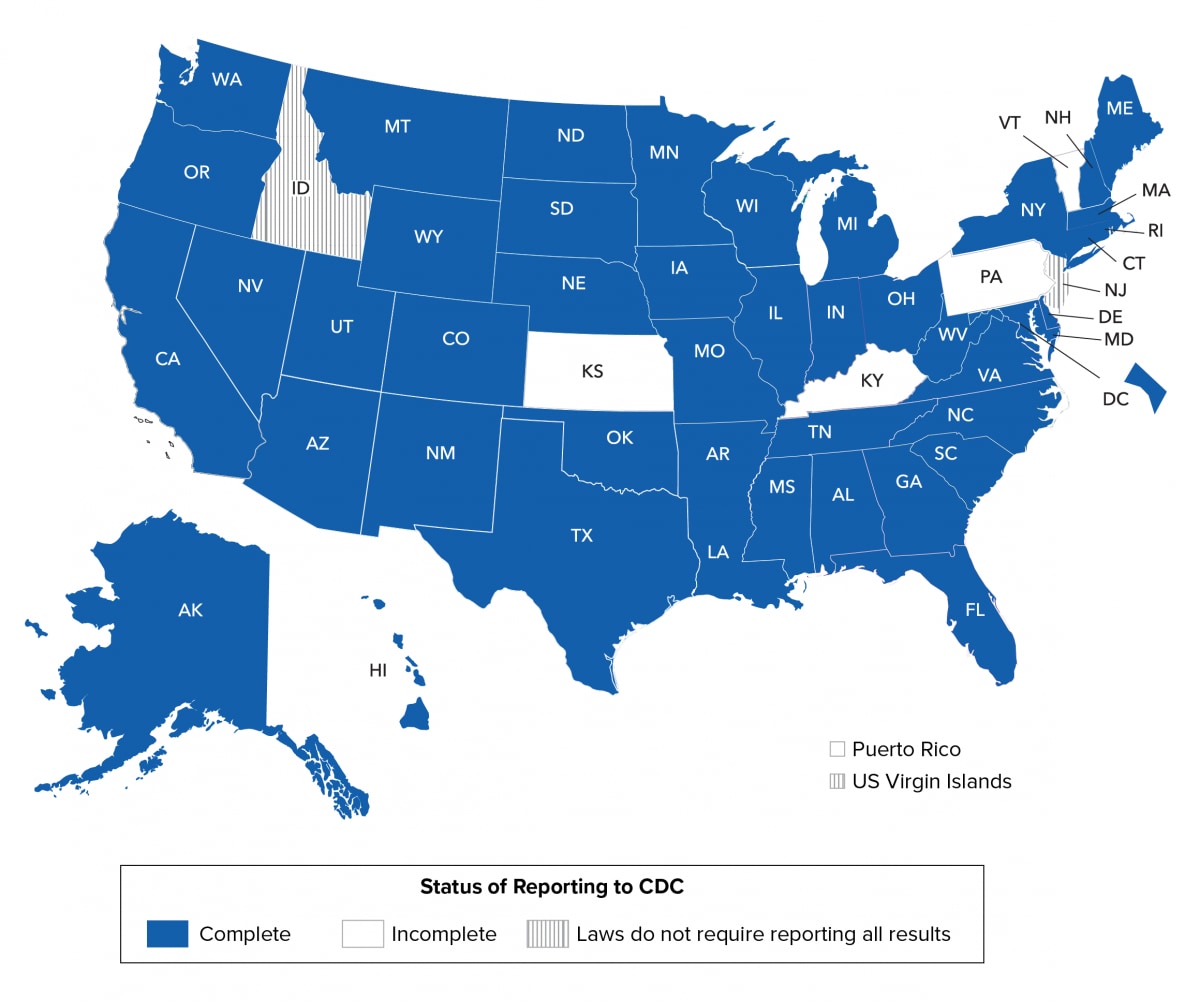
As of December 2020, 45 jurisdictions (44 states and the District of Columbia) had complete laboratory reporting for specimens collected from at least January 2018 through September 2020.

Note. See Technical Notes for more information on areas with complete laboratory reporting.

Download and Share This Infographicimage icon

Among 33,795 persons with an HIV diagnosis during 2019, in 45 jurisdictions with complete laboratory reporting, the stage of disease at time of diagnosis was classified as follows: stage 0 (7.9%), stage 1 (25.9%), stage 2 (30.7%), stage 3 (AIDS) (20.2%), and stage unknown (15.3%). A higher percentage of persons had HIV diagnosed at an earlier stage (stage 0, 1, or 2: 64.5%) than at the late stage (stage 3 [AIDS]: 20.2%).

Note. See Guide to Acronyms and Initialisms, Data Tables, and Technical Notes for more information on definitions and data specifications.

Download and Share This Infographicimage icon

The highest percentage for persons whose infection was diagnosed at an earlier stage (stage 0, 1, or 2) by selected characteristics was for persons of AGI, transgender FTM persons, persons aged 13–24 at time of diagnosis, American Indian or Alaska Native persons, males with infection attributed to male-to-male sexual contact and injection drug use (MMSC-IDU), and males with infection attributed to MMSC. The highest percentage for persons whose infection was diagnosed at a late stage (stage 3 [AIDS]) by selected characteristics was for females, males, persons aged ≥45 years at time of diagnosis (45–54 years: 31.3%, ≥55 years: 34.4%), Asian persons, and males with infection attributed to heterosexual contact.

Note. See Guide to Acronyms and Initialisms, Data Tables, and Technical Notes for more information on definitions and data specifications.
aHispanic/Latino persons can be of any race.
Download and Share This Infographicimage icon

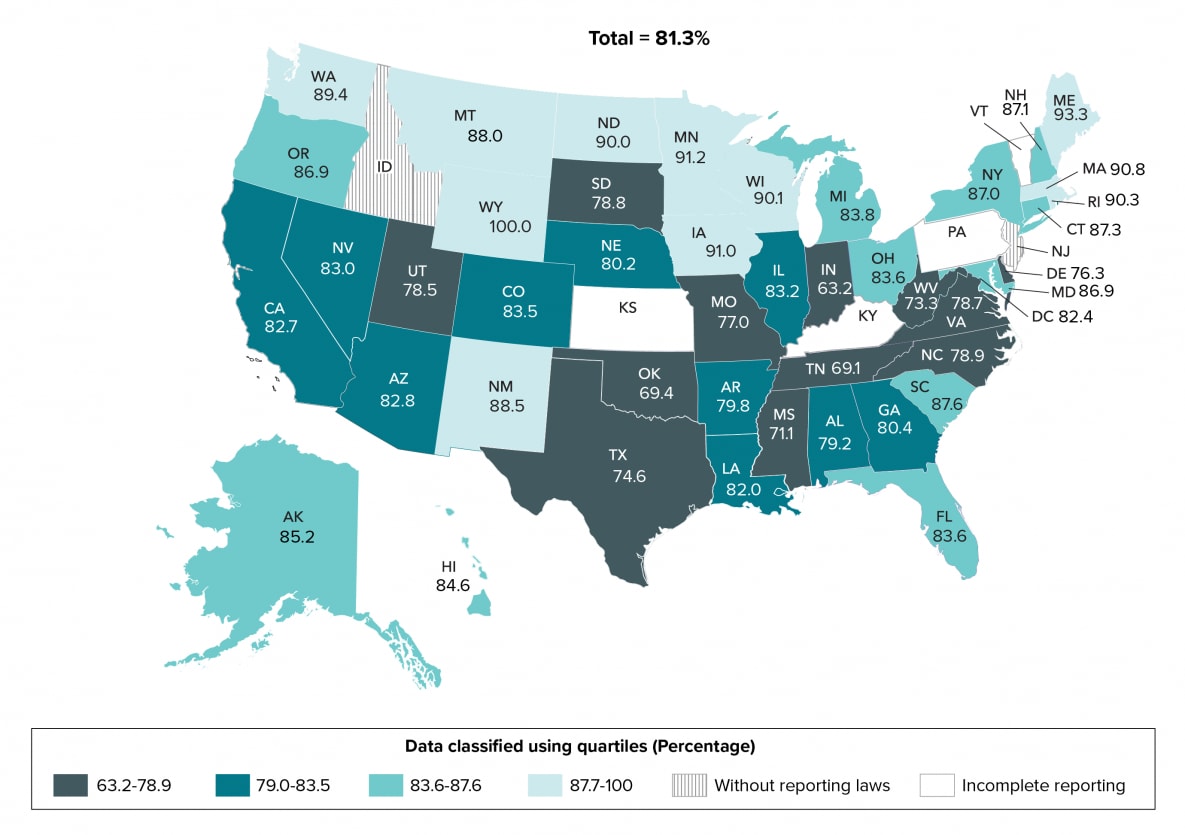
During 2019, 11 states (Iowa, Maine, Massachusetts, Minnesota, Montana, New Mexico, North Dakota, Rhode Island, Washington, Wisconsin, and Wyoming) in the top 25% had the highest percentages (≥87.7) of persons linked to HIV medical care within 1 month of diagnosis. Twelve states (Delaware, Indiana, Mississippi, Missouri, North Carolina, Oklahoma, South Dakota, Tennessee, Texas, Utah, Virginia, and West Virginia) in the lowest 25% had the lowest percentages (≤78.9) of persons linked to HIV medical care within 1 month of diagnosis.

Note. See Guide to Acronyms and Initialisms, Data Tables, and Technical Notes for more information on definitions and data specifications.
Download and Share This Infographicimage icon

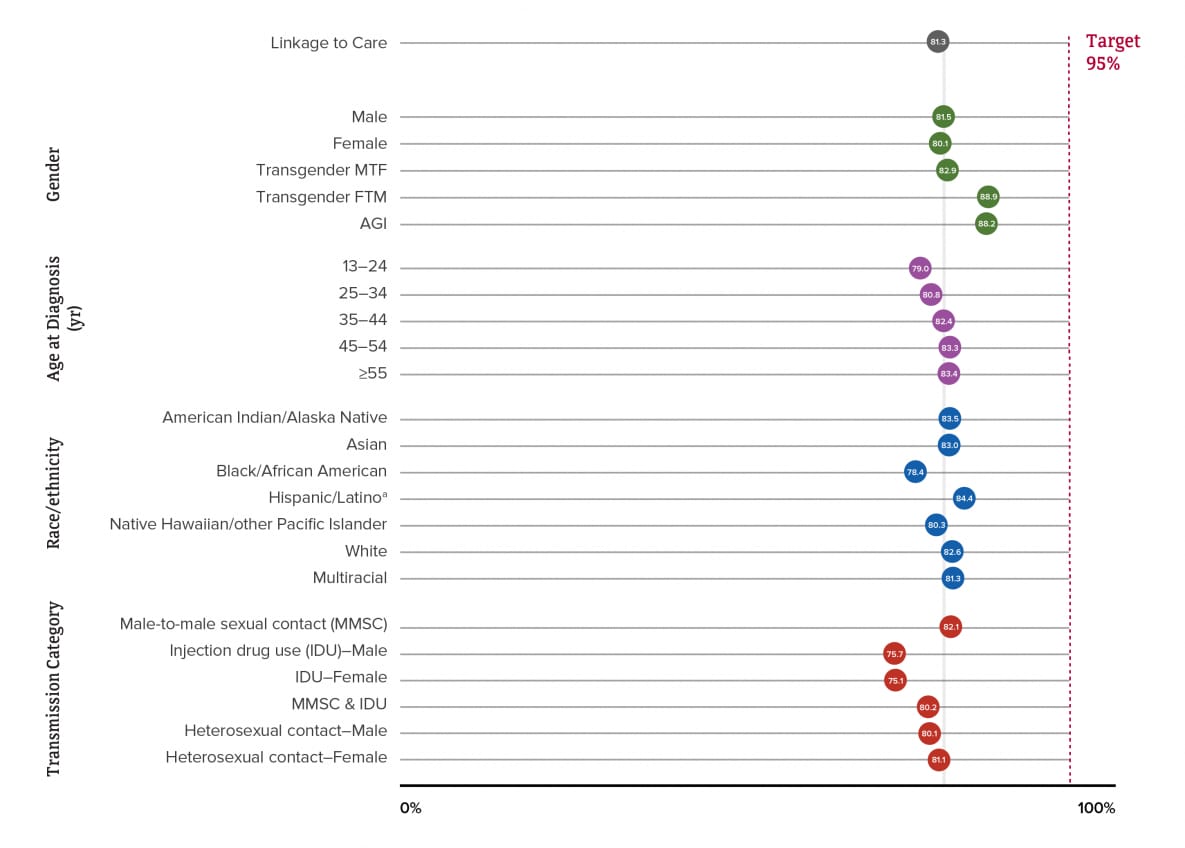
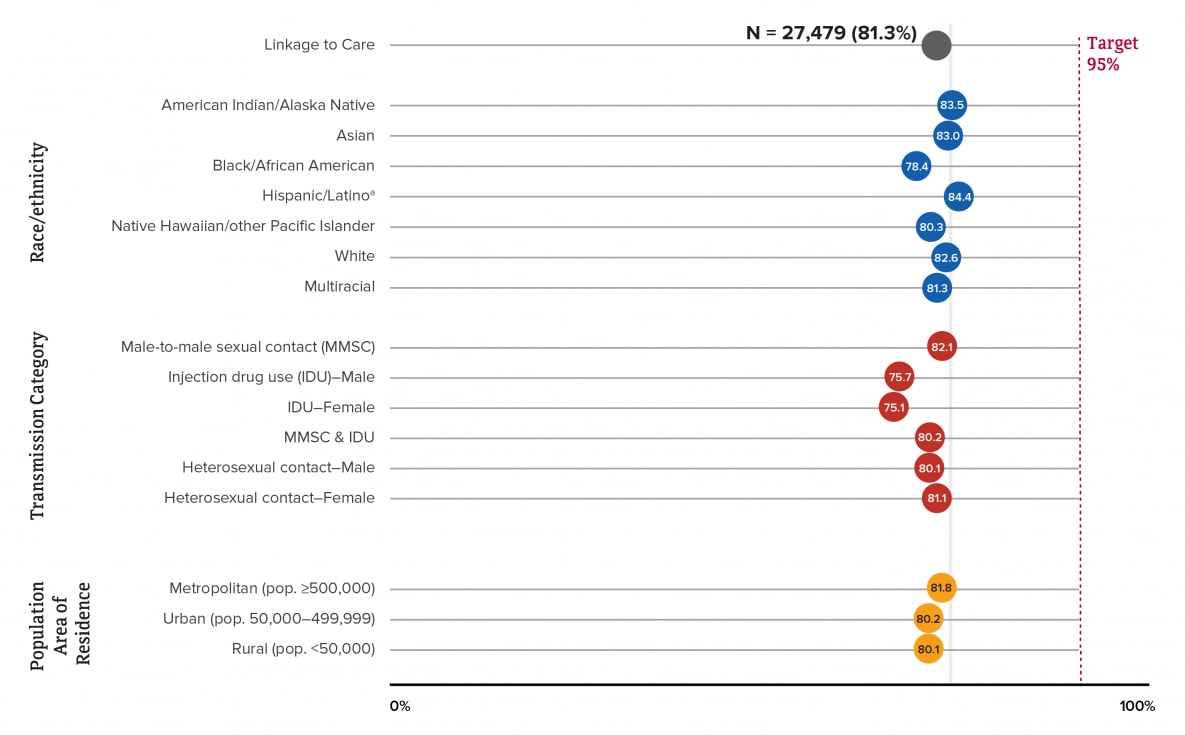
A closer look at linkage to HIV medical care within 1 month of diagnosis reveals among 33,795 persons whose infection was diagnosed during 2019 in the 45 jurisdictions with complete laboratory reporting, none of the demographic groups or groups with infection attributed to any of the transmission categories met the forthcoming EHE target of 95%.

Note. See Guide to Acronyms and Initialisms, Data Tables, and Technical Notes for more information on definitions and data specifications.
aHispanic/Latino persons can be of any race.
Download and Share This Infographicimage icon

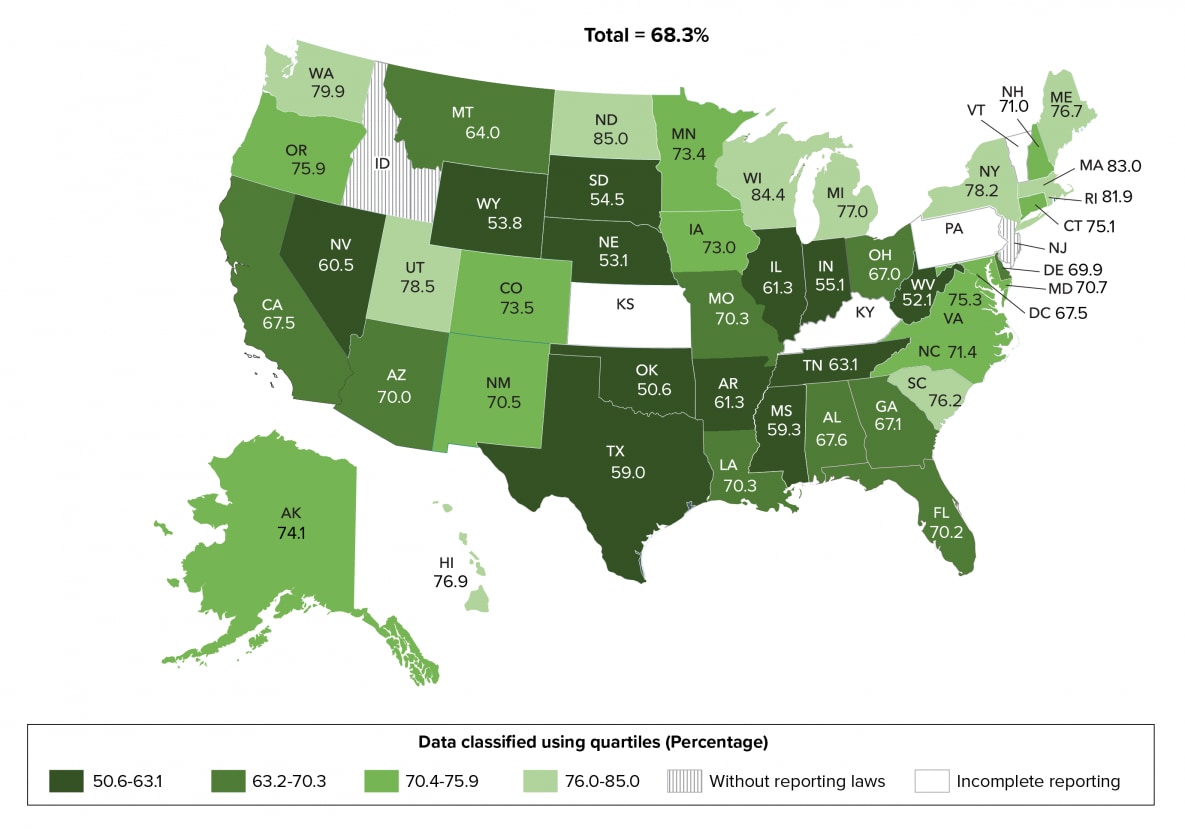
Eleven states (Hawaii, Maine, Massachusetts, Michigan, New York, North Dakota, Rhode Island, South Carolina, Utah, Washington, and Wisconsin) in the top 25% had the highest percentages (≥76.0) of persons with viral suppression within 6 months of diagnosis in 2019. Twelve states (Arkansas, Illinois, Indiana, Mississippi, Nebraska, Nevada, Oklahoma, South Dakota, Tennessee, Texas, West Virginia, and Wyoming) in the lowest 25% had the lowest percentages (≤63.1) of persons with viral suppression within 6 months of diagnosis in 2019.

Note. See Guide to Acronyms and Initialisms, Data Tables, and Technical Notes for more information on definitions and data specifications.
Download and Share This Infographicimage icon

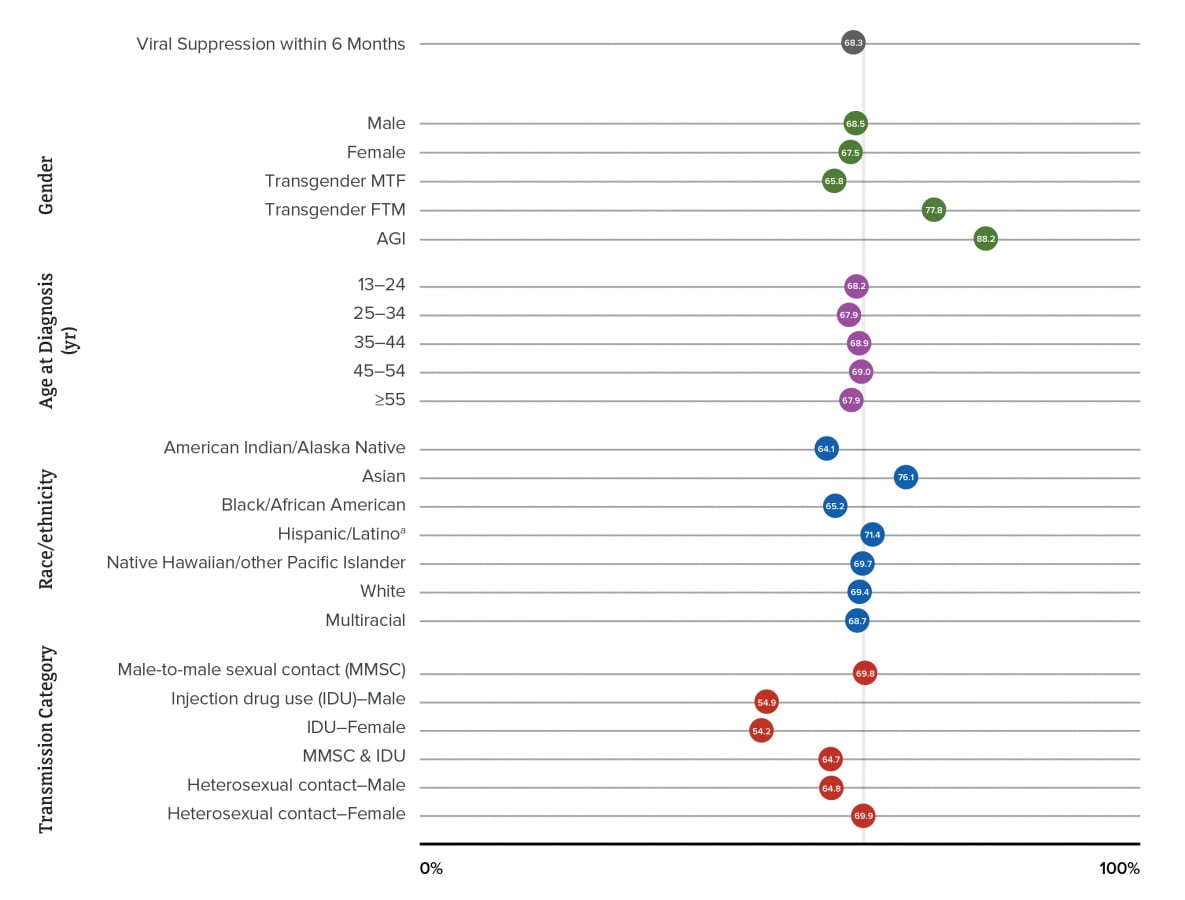
The lowest percentage for persons that had viral suppression within 6 months of HIV diagnosis in 2019 was for transgender MTF persons (65.8%), persons aged 25–34 years and persons ≥55 years (67.9%), American Indian/Alaska Native persons (64.1%), and females with infection attributed to IDU (54.2%).

Note. See Guide to Acronyms and Initialisms, Data Tables, and Technical Notes for more information on definitions and data specifications.
aHispanic/Latino persons can be of any race.
Download and Share This Infographicimage icon

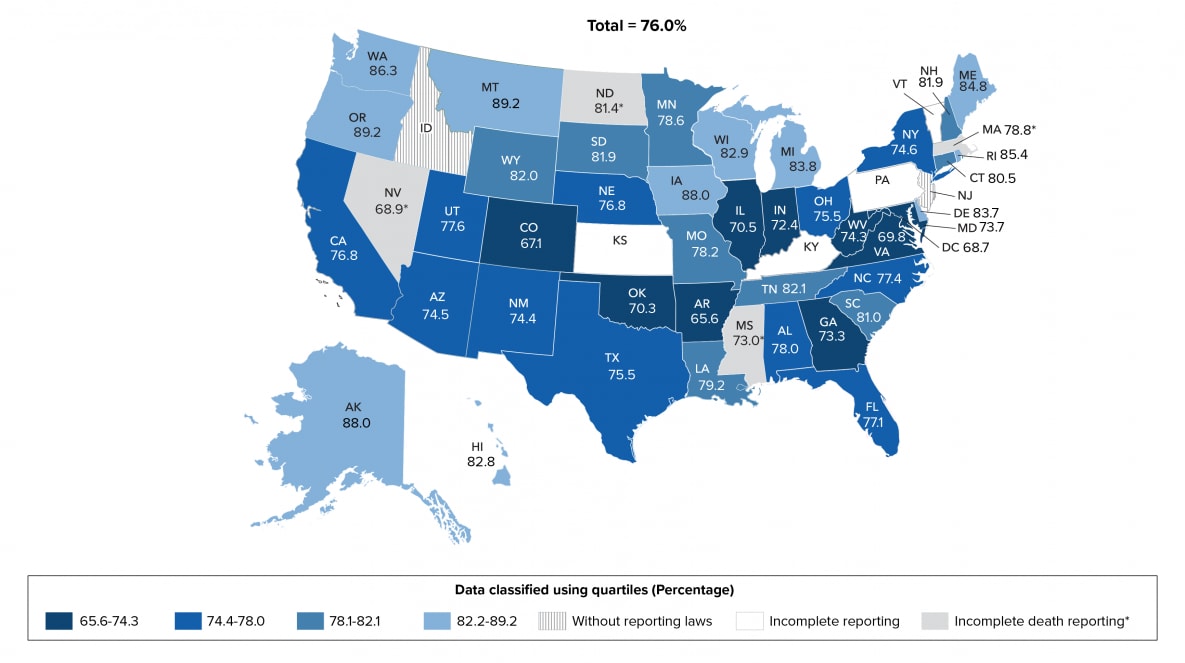
Eleven states (Arkansas, Colorado, Georgia, Illinois, Indiana, Maryland, Mississippi, Nevada, Oklahoma, Virginia, and West Virginia) and the District of Columbia were in the lowest 25% and had the lowest percentages (≤74.3) of persons who received any HIV medical care. Eleven states (Arkansas, Colorado, Georgia, Illinois, Indiana, Maryland, Mississippi, Nevada, Oklahoma, Virginia, and West Virginia) and the District of Columbia were in the lowest 25% and had the lowest percentages (≤74.3) of persons who received any HIV medical care.

Note. Data for the year 2019 are preliminary and based on deaths reported to CDC as of December 2020.
See Guide to Acronyms and Initialisms, Data Tables, and Technical Notes for more information on Definitions and Data Specifications.
Download and Share This Infographicimage icon

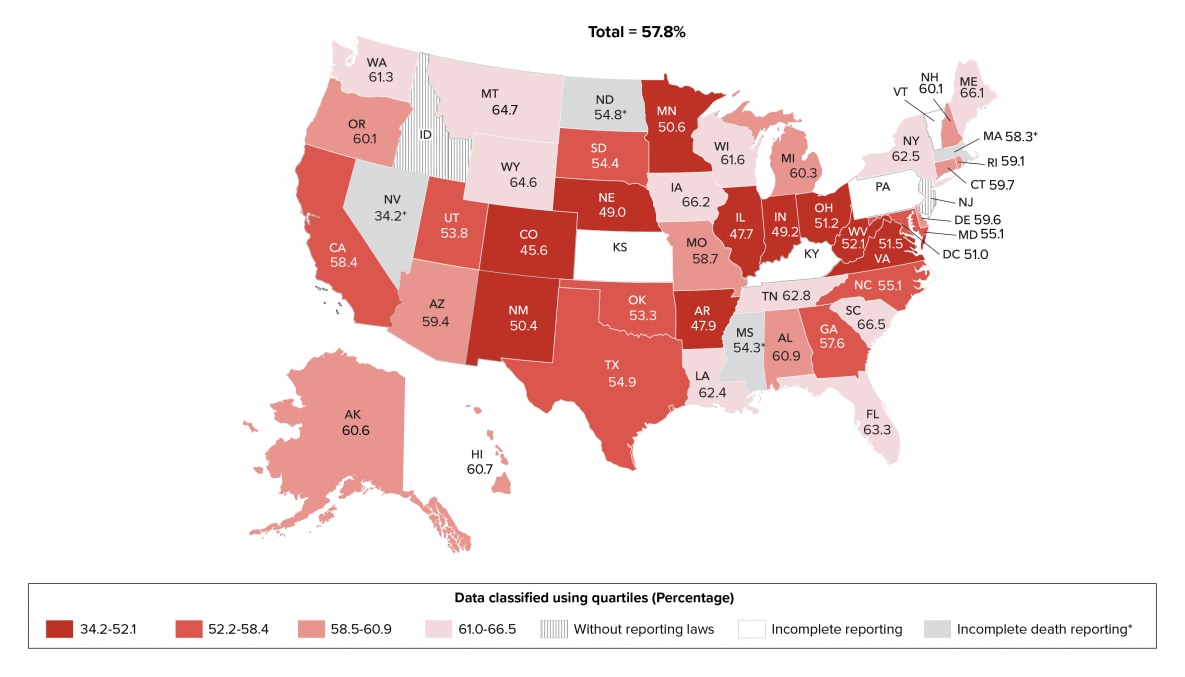
Eleven states (Florida, Iowa, Louisiana, Maine, Montana, New York, South Carolina, Tennessee, Washington, Wisconsin, and Wyoming) in the top 25% had the highest percentages (≥61.0) of persons retained in HIV medical care. Eleven states (Arkansas, Colorado, Illinois, Indiana, Minnesota, Nebraska, Nevada, New Mexico, Ohio, Virginia, and West Virginia) and the District of Columbia were in the lowest 25% and had the lowest percentages (≤52.1) of persons retained in HIV medical care.

Note. Data for the year 2019 are preliminary and based on deaths reported to CDC as of December 2020.
See Guide to Acronyms and Initialisms, Data Tables, and Technical Notes for more information on Definitions and Data Specifications.
Download and Share This Infographicimage icon

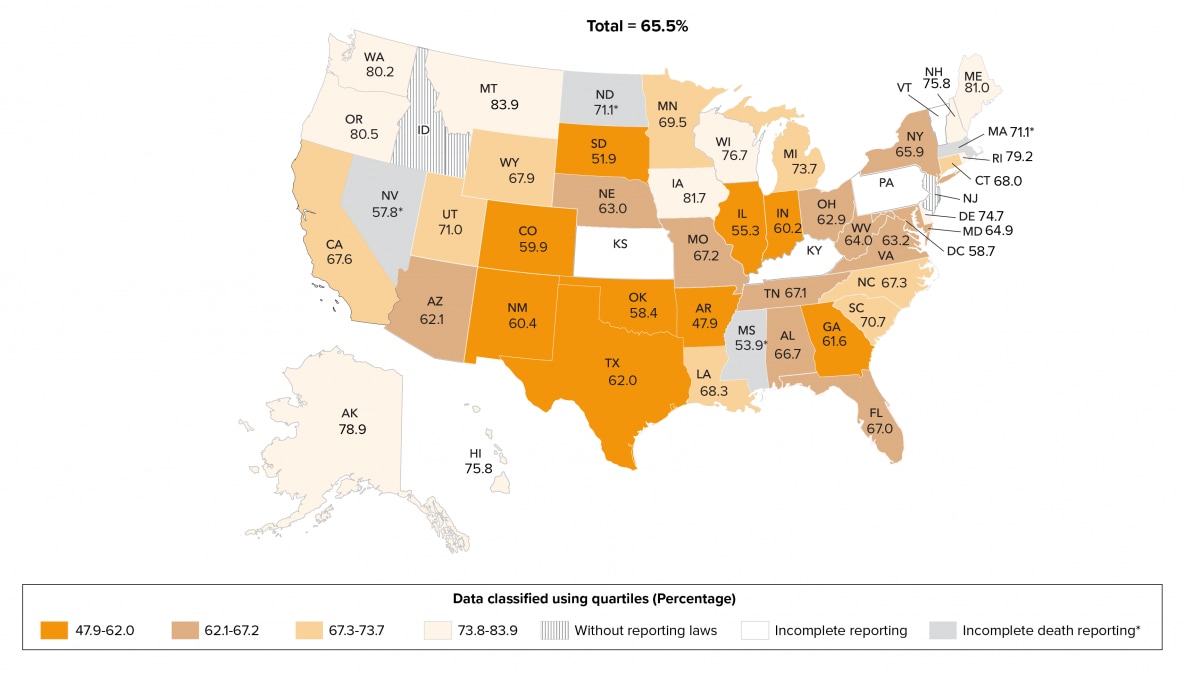
Figure 9. Viral Suppression among Persons Aged greater than or equal to 13 Years Living with Diagnosed HIV Infection, by Area of Residence, 2019—44 States and the District of Columbia

Note. Data for the year 2019 are preliminary and based on deaths reported to CDC as of December 2020.
See Guide to Acronyms and Initialisms, Data Tables, and Technical Notes for more information on Definitions and Data Specifications.
Download and Share This Infographicimage icon

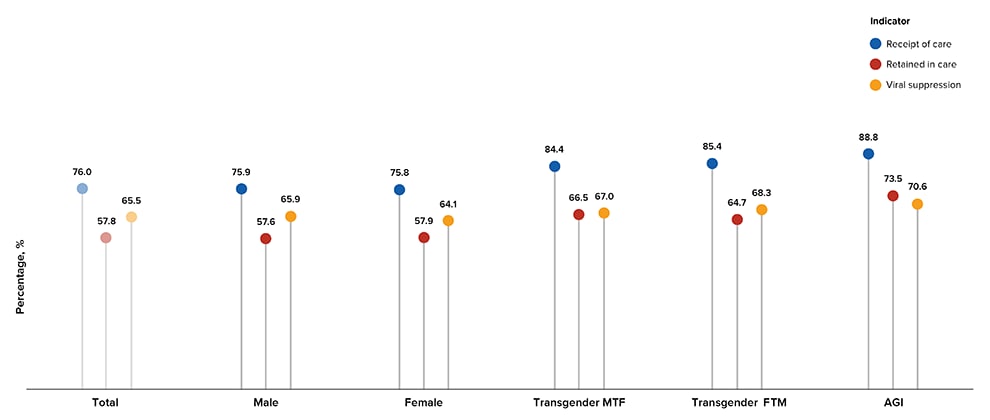
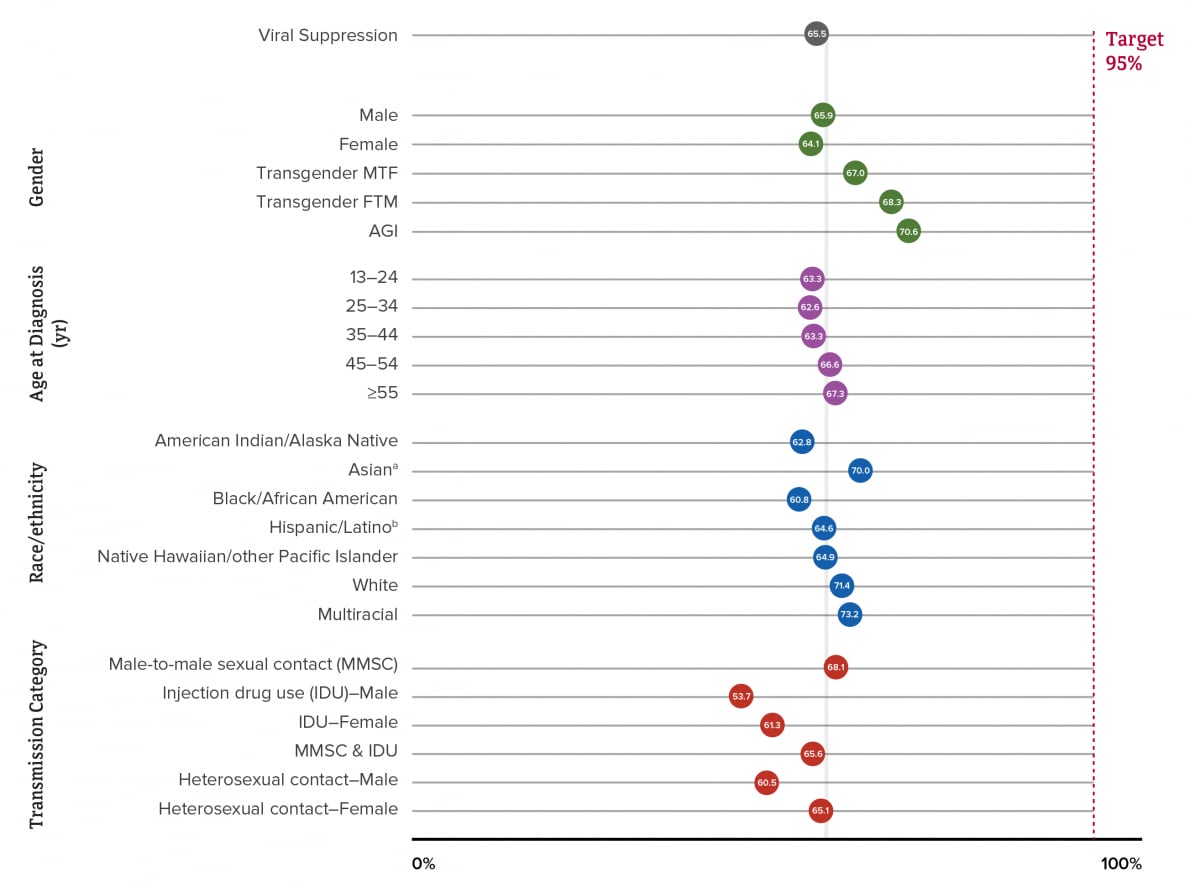
The highest percentage for persons who received any HIV medical care was for persons of AGI (88.8%) and the lowest percentage was for females (75.8%). The highest percentage for persons retained in HIV medical care was for persons of AGI (73.5%) and the lowest percentage was for males (57.6%). The highest percentage for persons who had viral suppression was for transgender FTM persons (70.6%) and the lowest percentage was for females (64.1%).

Note. See Guide to Acronyms and Initialisms, Data Tables, and Technical Notes for more information on definitions and data specifications.
Download and Share This Infographicimage icon

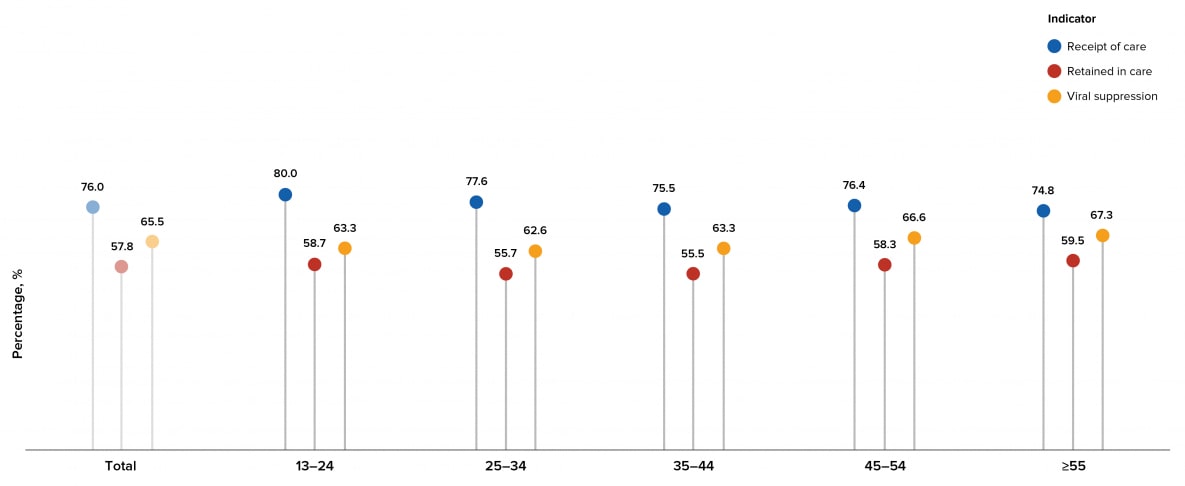
The highest percentage for persons who received any HIV medical care was for persons aged 13–24 years (80.0%) and the lowest percentage was for persons aged greater than or equal to 55 years (74.8%). The highest percentage for persons retained in HIV medical care was for persons aged greater than or equal to 55 years (59.5%) and the lowest percentage was for persons aged 35–44 years (55.5%). The highest percentage for persons who had viral suppression was for persons aged greater than or equal to 55 years (67.3%) and the lowest percentage was for persons aged 25–34 years (62.6%).

Note. See Guide to Acronyms and Initialisms, Data Tables, and Technical Notes for more information on definitions and data specifications.
Download and Share This Infographicimage icon

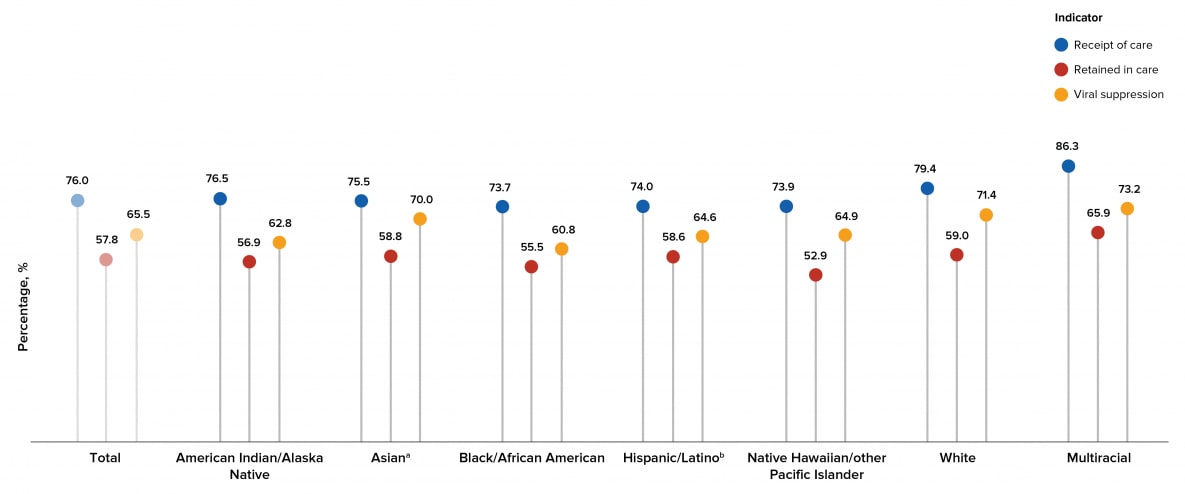
The highest percentage for persons who had viral suppression was for multiracial persons (73.2%) and the lowest percentage was for Black/African American persons (60.8%).

Note. See Guide on Acronyms and Initialisms, Data Tables, and Technical Notes for more information on Definitions and Data Specifications.
aIncludes Asian/Pacific Islander legacy cases.
bHispanic/Latino persons can be of any race.
Download and Share This Infographicimage icon

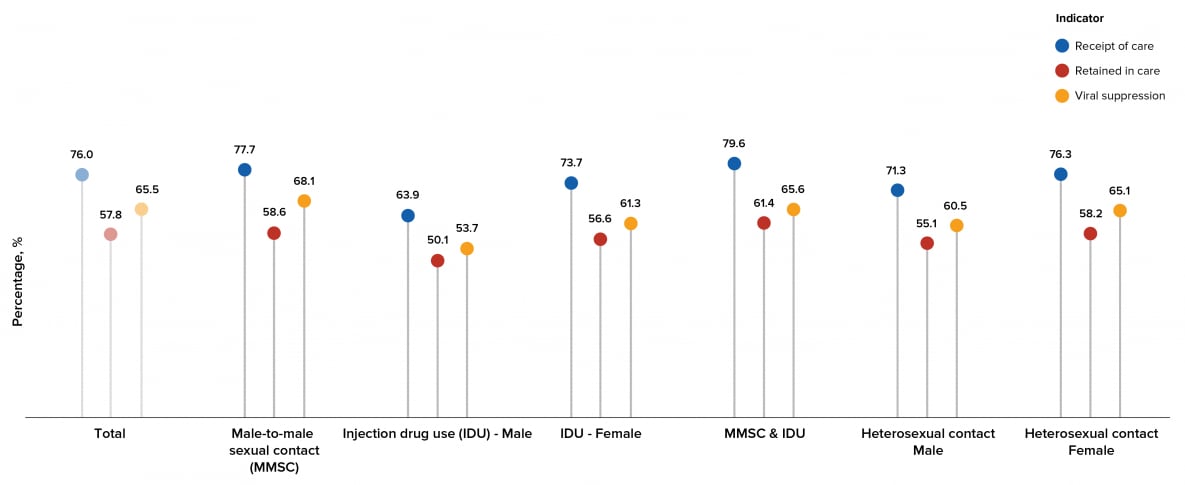
The highest percentage for persons who had viral suppression was for males with infection attributed to MMSC (68.1%) and the lowest percentage was for males with infection attributed to IDU (53.7%).

Note. See Guide to Acronyms and Initialisms, Data Tables, and Technical Notes for more information on definitions and data specifications.
Download and Share This Infographicimage icon

A closer look at viral suppression reveals among 925,077 persons aged ≥13 years living with diagnosed HIV infection at year-end 2019 in the 45 jurisdictions with complete laboratory reporting, none of the demographic groups or groups with infection attributed to any of the transmission categories met the forthcoming EHE target of 95%.

Note. See Guide to Acronyms and Initialisms, Data Tables, and Technical Notes for more information on definitions and data specifications.
aIncludes Asian/Pacific Islander legacy cases.
bHispanic/Latino persons can be of any race.
Download and Share This Infographicimage icon

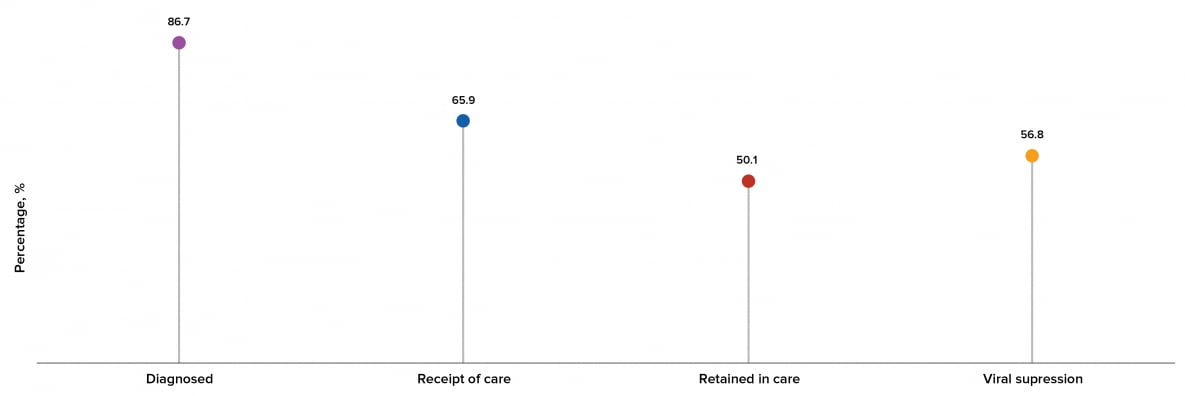
Among the estimated 1.2 million people living with HIV in the United States, 87% have received a diagnosis, 66% received HIV medical care in 2019, 50% were retained in HIV medical care, and 57% with viral suppression.

Note. See Guide to Acronyms and Initialisms, Data Tables, and Technical Notes for more information on definitions and data specifications.
Download and Share This Infographicimage icon

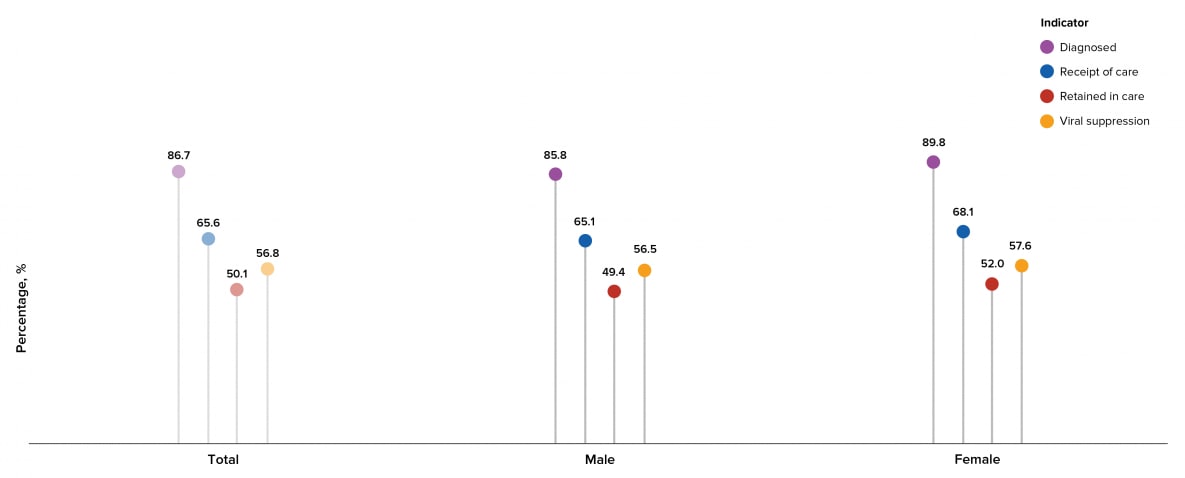
Among persons living with HIV in the United States, a higher percentage of females received a diagnosis, received HIV medical care in 2019, were retained in HIV medical care, and had viral suppression than males.

Note. See Guide to Acronyms and Initialisms, Data Tables, and Technical Notes for more information on definitions and data specifications.
Download and Share This Infographicimage icon

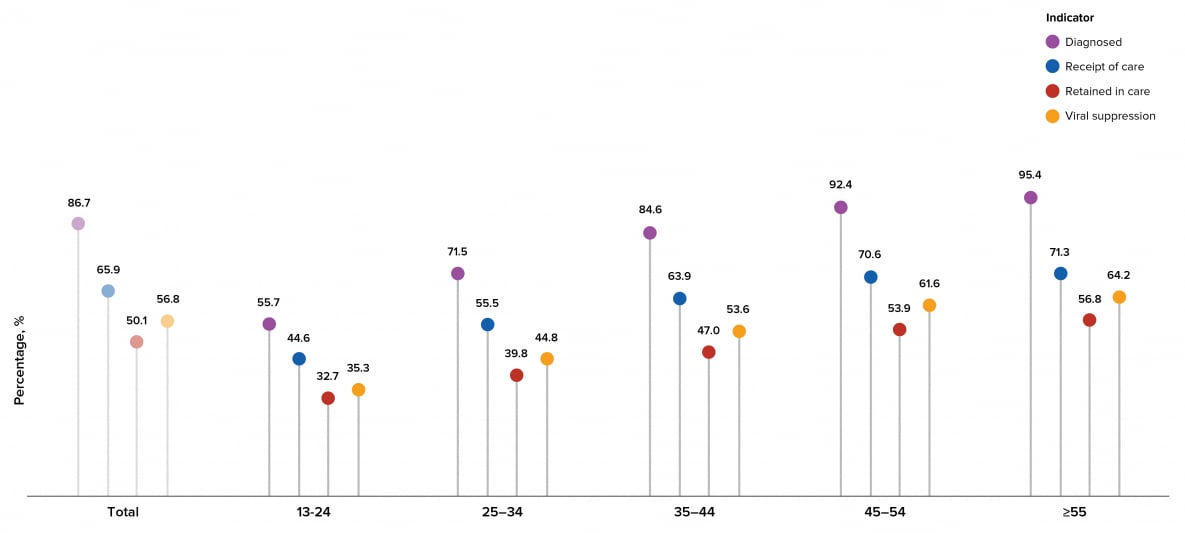
Among persons living with HIV in the United States, a higher percentage of persons aged greater than or equal to 55 years received a diagnosis, a higher percentage of persons aged greater than or equal to 45 years received HIV medical care in 2019, a higher percentage of persons aged greater than or equal to 55 years were retained in HIV medical care, and a higher percentage of persons aged greater than or equal to 55 years had viral suppression than persons in other age groups. A lower percentage of persons aged 13-24 years received a diagnosis, received HIV medical care in 2019, were retained in HIV medical care, and had viral suppression than other age groups.

Note. See Guide on Acronyms and Initialisms, Data Tables, and Technical Notes for more information on Definitions and Data Specifications.
Download and Share This Infographicimage icon

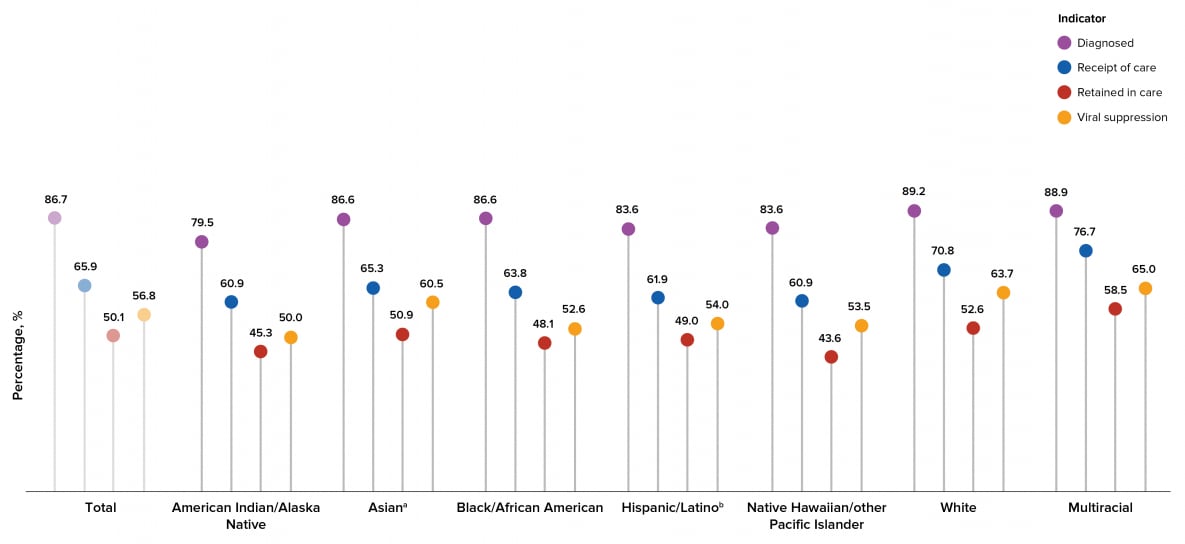
Among persons living with HIV in the United States, higher percentages of White and Multiracial persons received a diagnosis, a higher percentage of Multiracial persons received HIV medical care in 2019, a higher percentage of Multiracial persons were retained in HIV medical care, and higher percentages of Multiracial and White persons had viral suppression than other racial/ethnic groups. A lower percentage of American Indian/Alaska Native persons received a diagnosis, lower percentages of American Indian/Alaska Native and Native Hawaiian/other Pacific Islander persons received HIV medical care in 2019, lower percentages of Native Hawaiian/other Pacific Islander and American Indian/Alaska Native persons were retained in HIV medical care, and a lower percentage of American Indian/Alaska Native persons had viral suppression than other racial/ethnic groups.

Note. See Guide on Acronyms and Initialisms, Data Tables, and Technical Notes for more information on Definitions and Data Specifications.
aIncludes Asian/Pacific Islander legacy cases.
bHispanic/Latino persons can be of any race.
Download and Share This Infographicimage icon

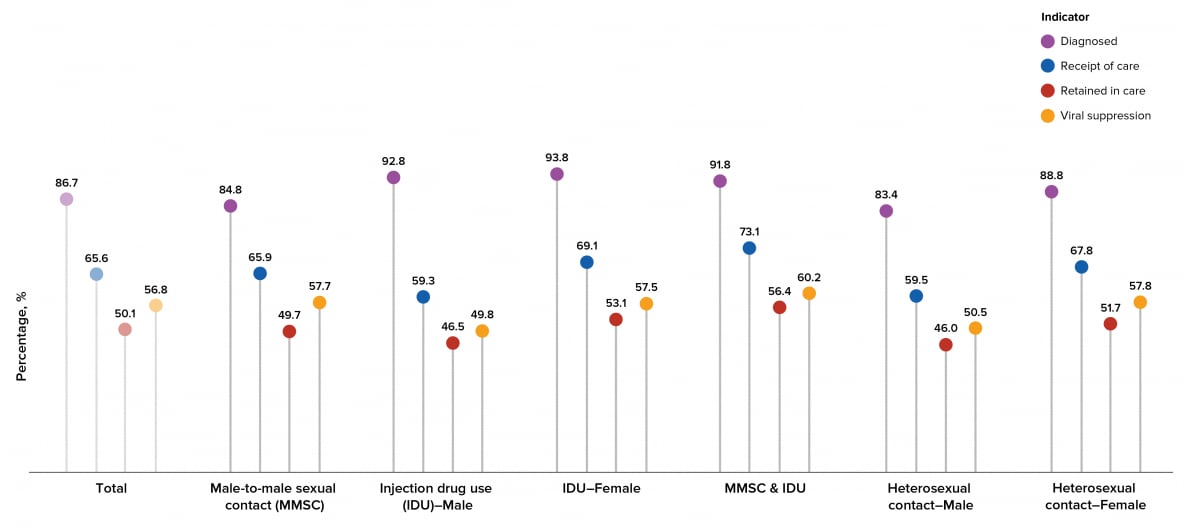
Among persons living with HIV in the US, a higher percentage of persons with infection attributed to IDU received a diagnosis, a higher percentage of MMSC-IDU males w received HIV medical care, a higher percentage of MMSC-IDU males were retained in medical care, and a higher percentages of MMSC males and heterosexual females had viral suppression. A lower percentage of heterosexual males with received a diagnosis, a lower percentage of heterosexual males received medical care, lower percentages of heterosexual males and IDU males were retained in HIV medical care, and lower percentages of heterosexual males and IDU males had virally suppressed.

Note. See Guide on Acronyms and Initialisms, Data Tables, and Technical Notes for more information on Definitions and Data Specifications.
Download and Share This Infographicimage icon

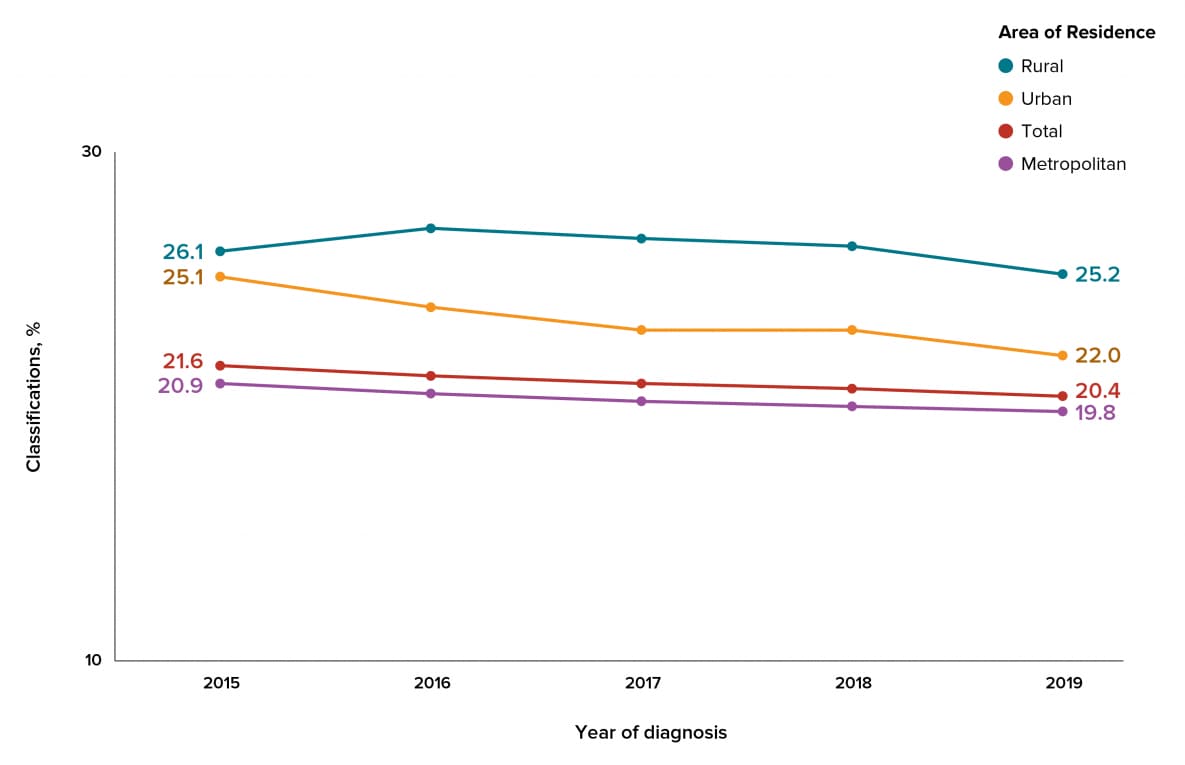
The percentage of stage 3 (AIDS) classifications decreased overall and in metropolitan and urban areas from 2015 through 2019.

Note. See Guide on Acronyms and Initialisms, Data Tables, and Technical Notes for more information on Definitions and Data Specifications.
Download and Share This Infographicimage icon

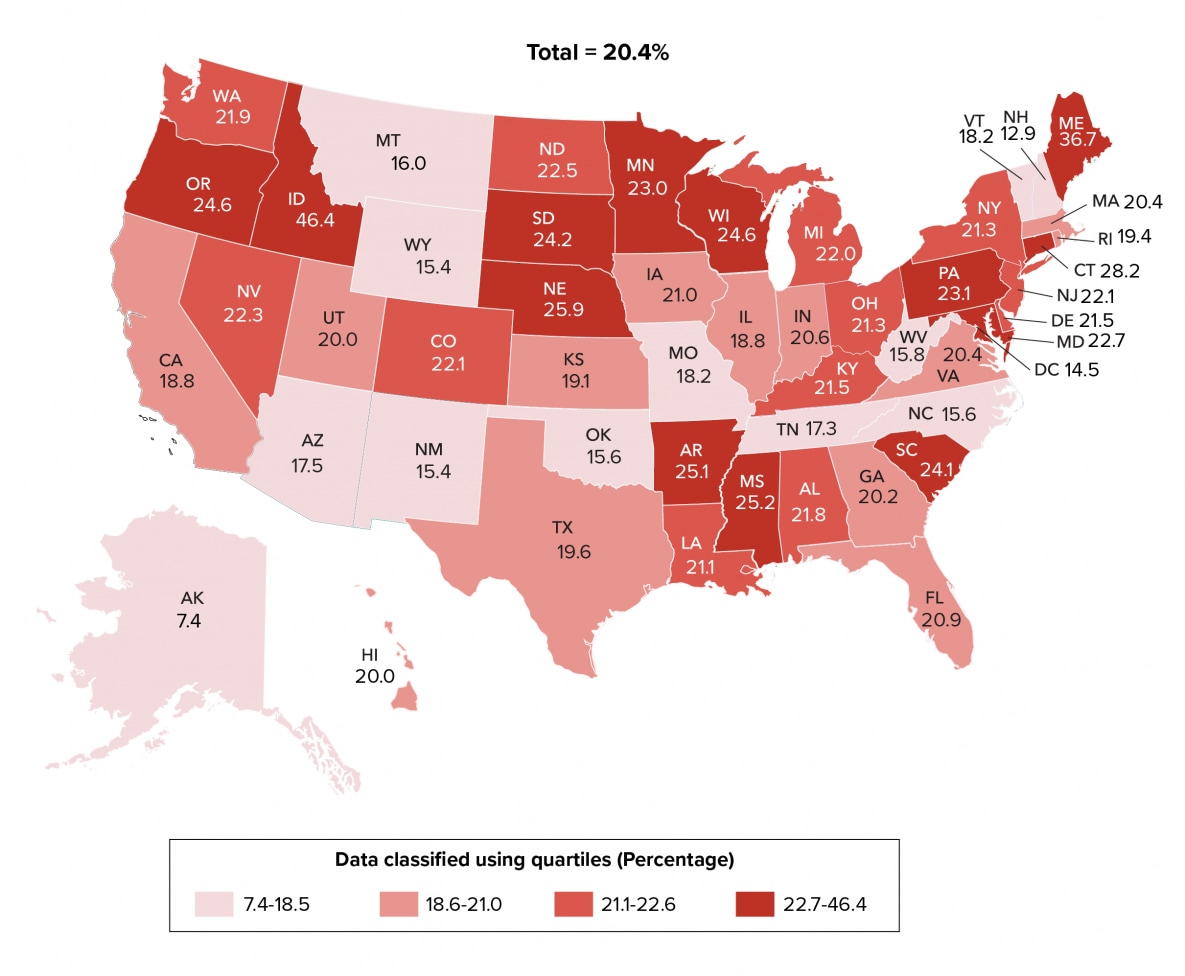
Twelve states (Alaska, Arizona, Missouri, Montana, New Hampshire, New Mexico, North Carolina, Oklahoma, Tennessee, Vermont, West Virginia, Wyoming) and the District of Columbia were in the lowest 25% and had the lowest percentages ( less than or equal to 18.5) of persons who received a late-stage diagnosis.

Note. See Guide to Acronyms and Initialisms, Data Tables, and Technical Notes for more information on Definitions and Data Specifications.
Download and Share This Infographicimage icon

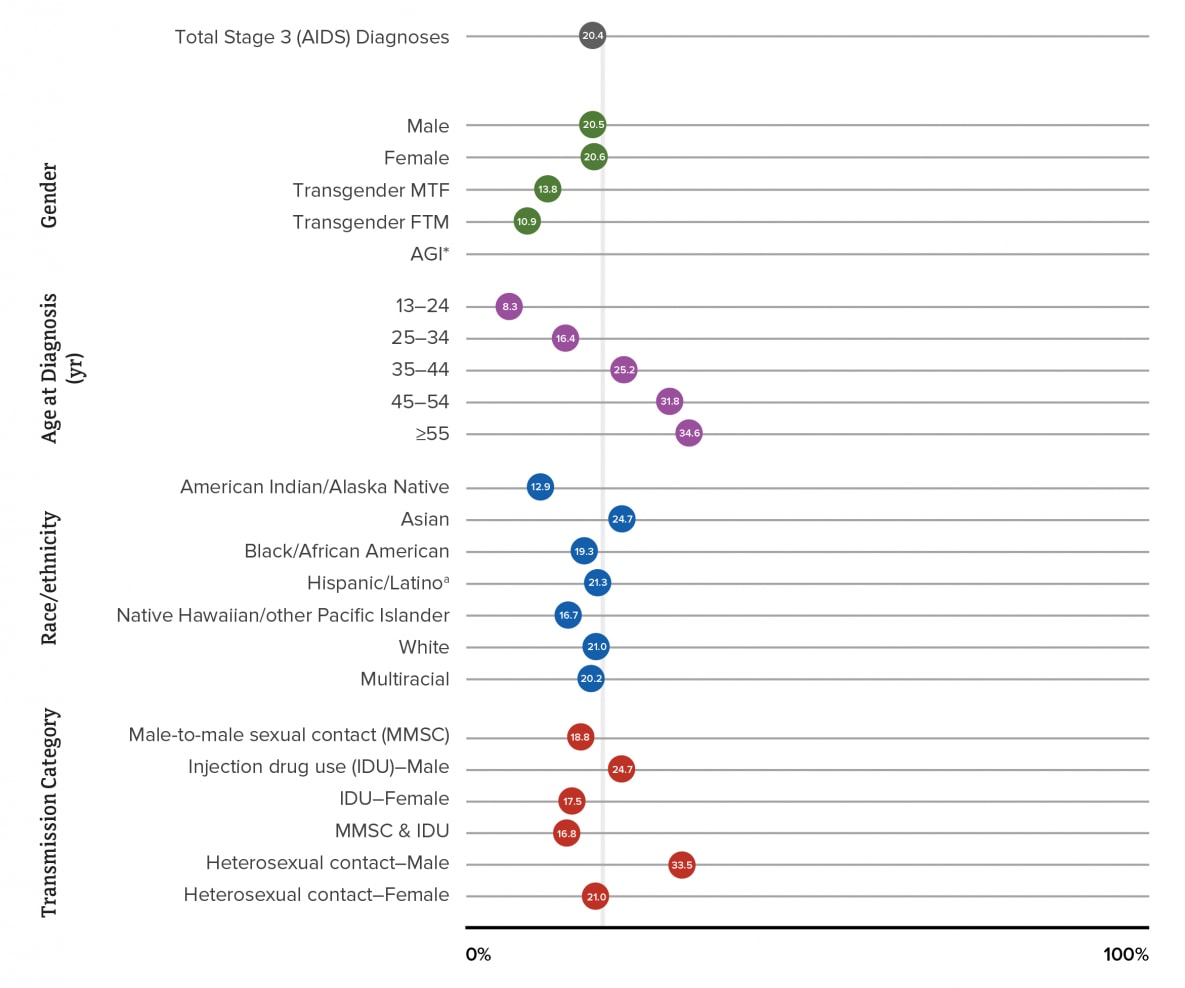
In 2019, the highest percentages of a late-stage diagnosis in the United States and 6 dependent areas by selected characteristics (i.e., gender, age, race/ethnicity, and transmission category) were among females (20.7%), males (20.5%), persons aged greater than or equal to 45 years at time of diagnosis (45–54 years: 31.9%; greater than or equal to 55 years: 34.5%), Asian persons (24.9%), and males with infection attributed to heterosexual contact (33.4%).

Note. See Guide on Acronyms and Initialisms, Data Tables, and Technical Notes for more information on Definitions and Data Specifications.
aHispanic/Latino persons can be of any race.
Download and Share This Infographicimage icon

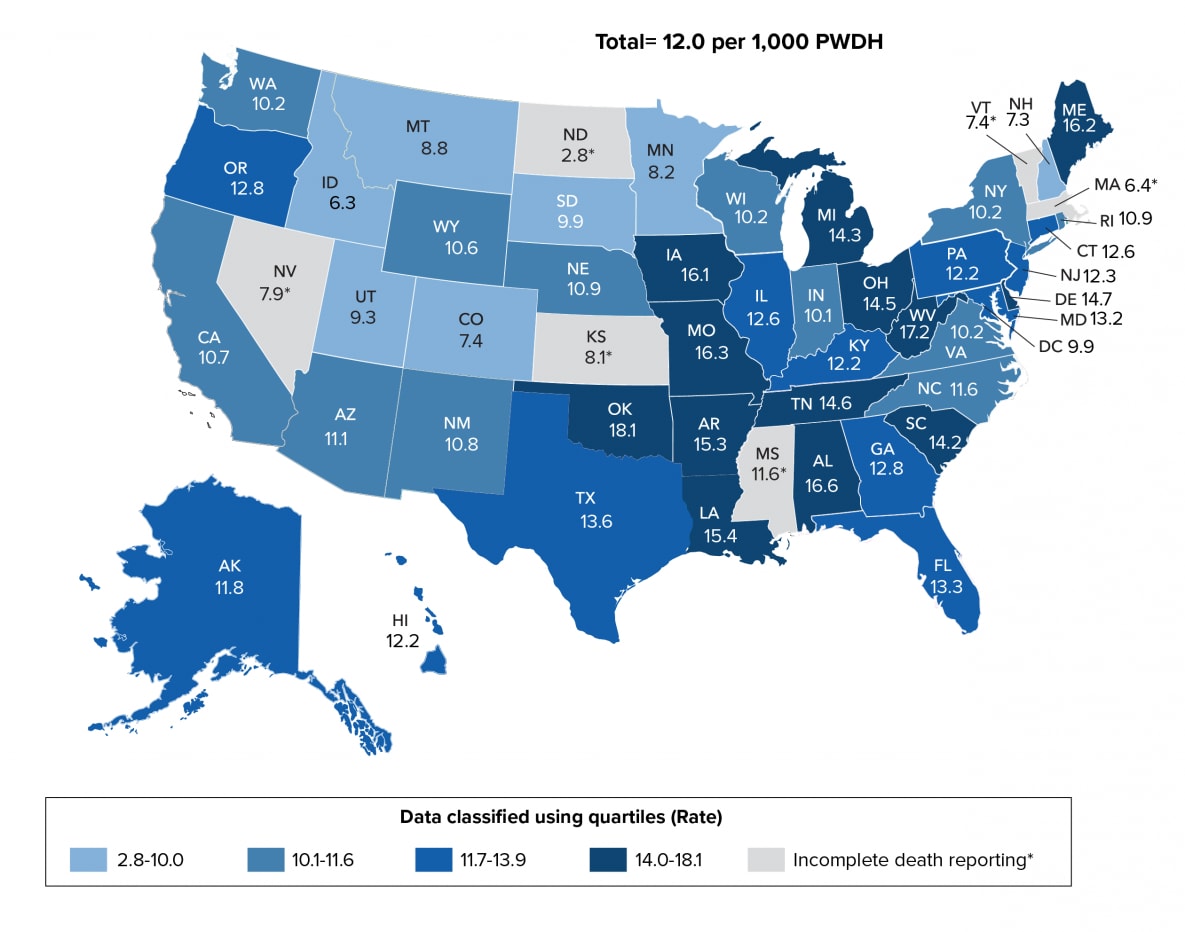
During 2019, 14 states (Alabama, Arkansas, Delaware, Iowa, Louisiana, Maine, Missouri, Ohio, Oklahoma, South Carolina, Tennessee, and West Virginia) in the highest 25% had the highest age-adjusted rates of death (greater than or equal to 14.0) per 1,000 persons with diagnosed HIV infection. Thirteen jurisdictions (Colorado, Idaho, Kansas, Massachusetts, Minnesota, Montana, Nevada, New Hampshire, North Dakota, South Dakota, Utah, Vermont,) and the District of Columbia were in the lowest 25% and had the lowest age-adjusted rates of death (less than or equal to 9.9) per 1,000 persons with diagnosed HIV infection.

Note. Data for the year 2019 are preliminary and based on deaths reported to CDC as of December 2020. Rates per 1,000 persons with diagnosed HIV infection. See Guide to Acronyms and Initialisms, Data Tables, and Technical Notes for more information on Definitions and Data Specifications.
Download and Share This Infographicimage icon

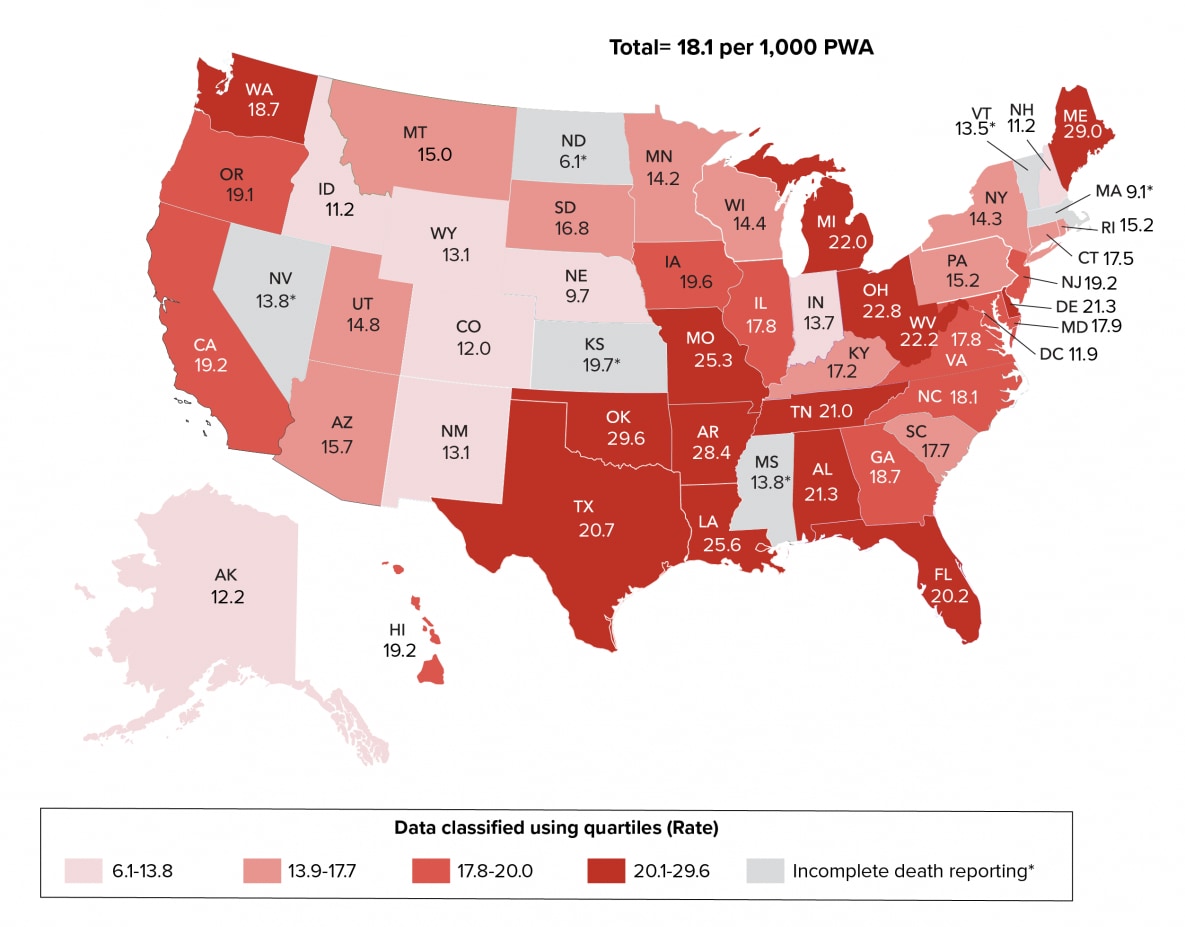
Twelve states (Alaska, Colorado, Idaho, Indiana, Massachusetts, Mississippi, Nebraska, New Hampshire, New Mexico, North Dakota, Vermont, Wyoming) and the District of Columbia were in the lowest 25% and had the lowest age-adjusted rates of deaths (less than or equal to 13.7) per 1,000 persons with diagnosed HIV infection ever classified as Stage 3 (AIDS).

Note. Data for the year 2019 are preliminary and based on deaths reported to CDC as of December 2020. Rates per 1,000 persons with diagnosed HIV infection ever classified as stage 3 (AIDS). See Guide to Acronyms and Initialisms, Data Tables, and Technical Notes for more information on Definitions and Data Specifications.
Download and Share This Infographicimage icon

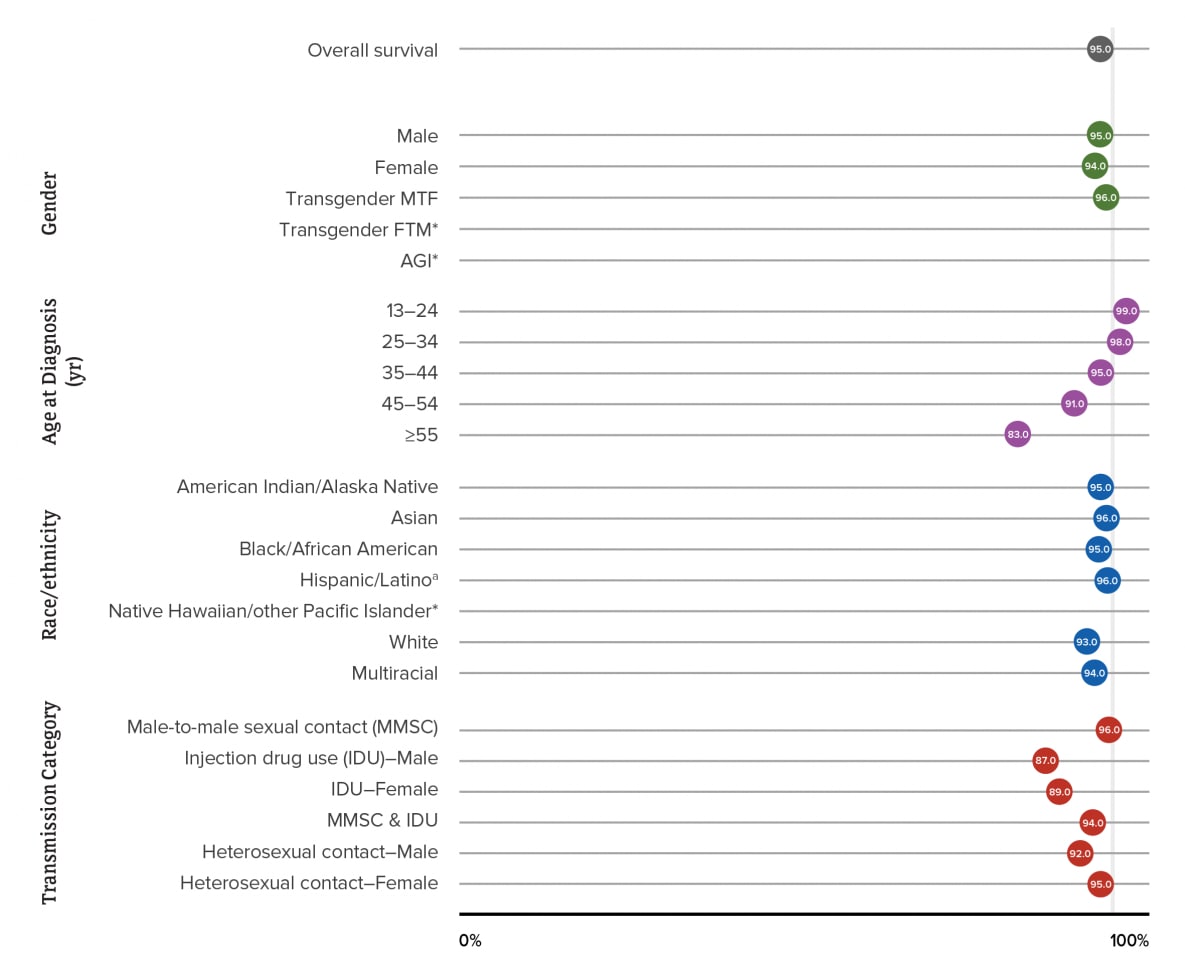
In the United States, survival for greater than or equal to 3 years after a diagnosis of HIV infection was above 94% and remained stable for diagnoses that were made during 2011–2016. By gender, the highest percentage was for transgender MTF persons (96%). By age, the highest percentage was for persons aged 13–24 years (99%). By race/ethnicity, the highest percentages were for Asian and Hispanic/Latino persons (96%). By transmission category, the highest percentage was for males with infection attributed to MMSC (96%).

Note. Asterisk (*) indicates sample too small (<600 diagnoses during the 6-year period) for the calculation of meaningful survival estimates. See Guide to Acronyms and Initialisms, Data Tables, and Technical Notes for more information on Definitions and Data Specifications.
aHispanic/Latino persons can be of any race.
Download and Share This Infographicimage icon

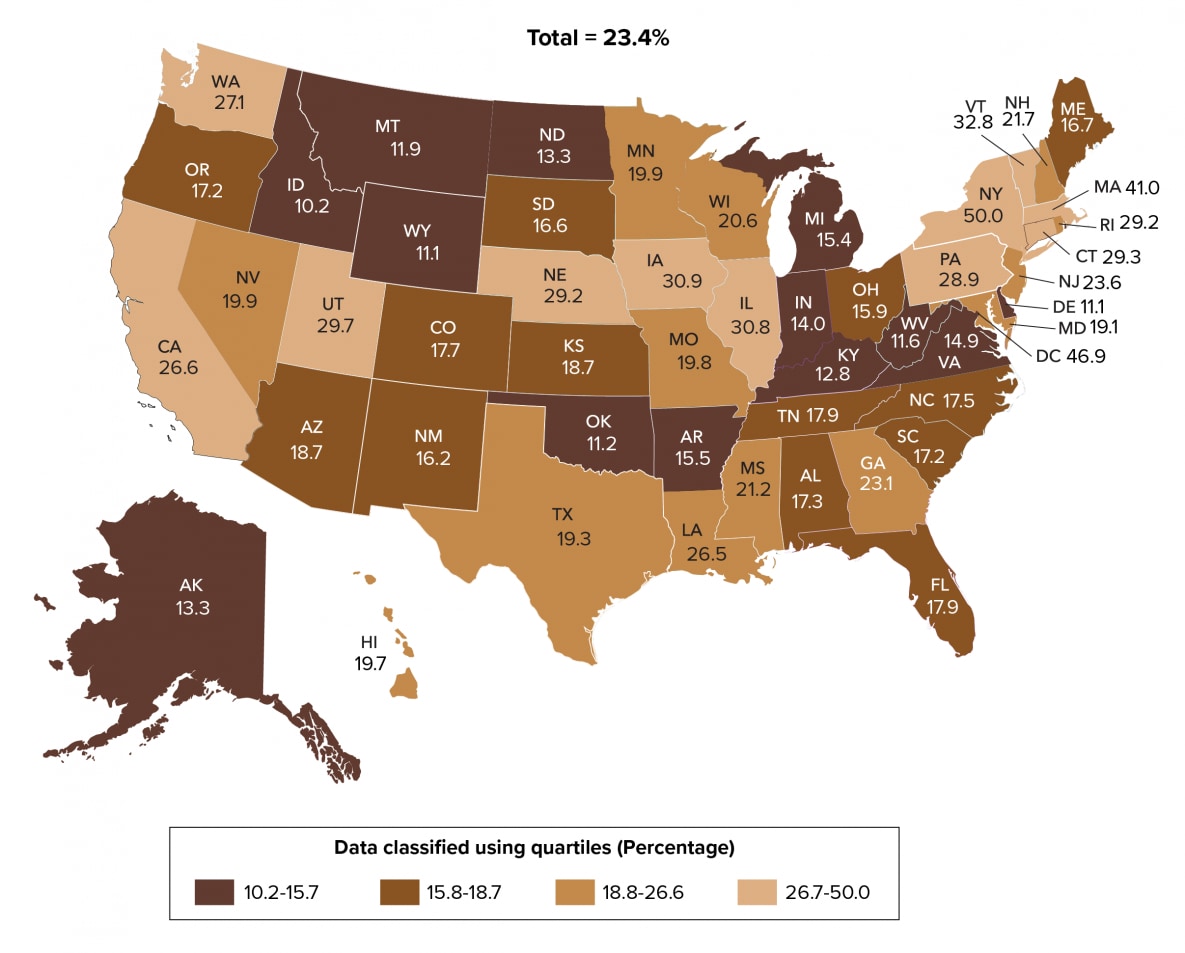
PrEP coverage varied by area of residence. Twelve states (California, Connecticut, Illinois, Iowa, Massachusetts, Nebraska, New York, Pennsylvania, Rhode Island, Utah, Vermont, and Washington) and the District of Columbia were in the top 25% and had the highest percentages (greater than or equal to 26.7%) of PrEP coverage. Thirteen states (Alaska, Arkansas, Delaware, Idaho, Indiana, Kentucky, Michigan, Montana, North Dakota, Oklahoma, Virginia, West Virginia, and Wyoming) in the lowest 25% had the lowest percentages (15.7%) of PrEP coverage.

Note. See Guide to Acronyms and Initialisms, Data Tables, and Technical Notes for more information on definitions and data specifications.
Download and Share This Infographicimage icon

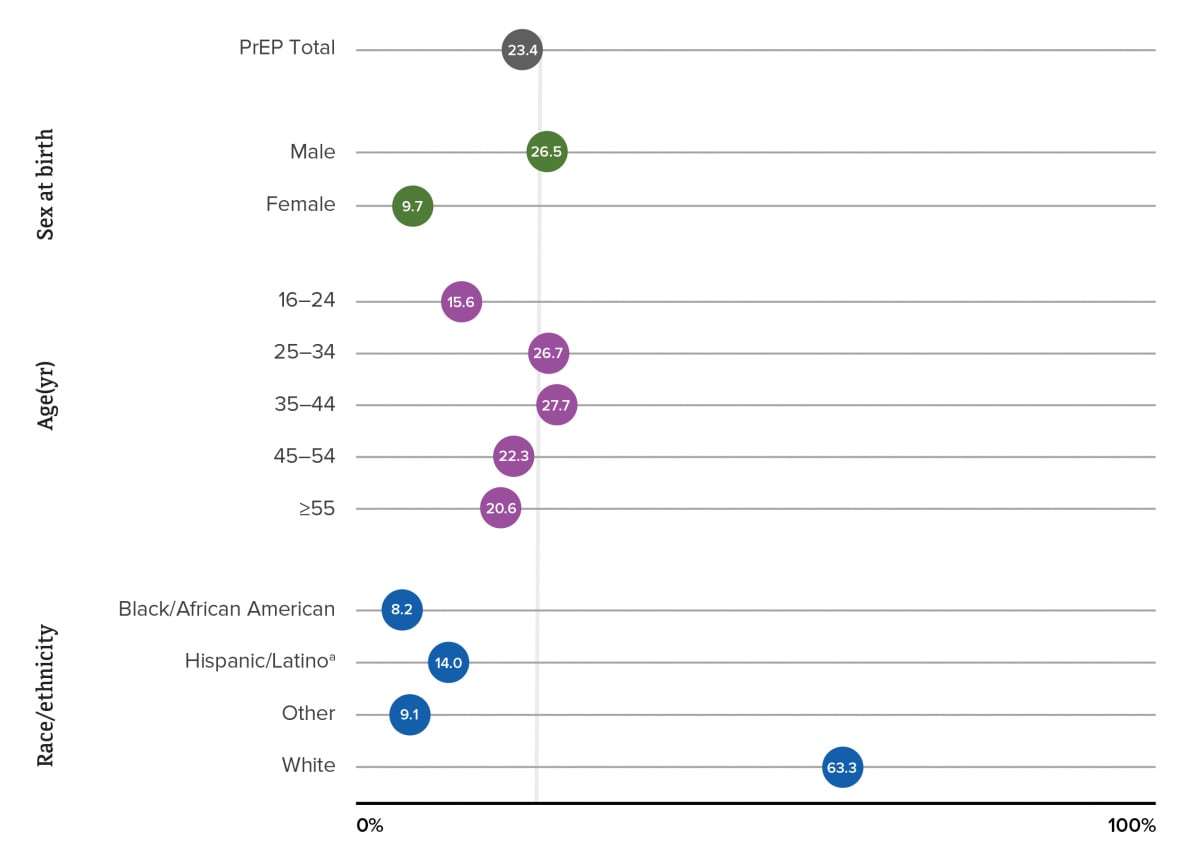
PrEP coverage was nearly three times as high among males (26.5%) as among females (9.7%). The highest percentages of PrEP coverage were for persons aged 25–44 years (25–34 years: 26.7%; 35–44 years: 27.7%). The lowest percentage was for persons aged 16–24 years (15.6%). In 2019, after adjusting for missing race/ethnicity, the highest percentage was for White persons (63.3%), followed by Hispanic/Latino (14.0%) and Black/African American persons (8.2%).

Note. See Guide to Acronyms and Initialisms, Data Tables, and Technical Notes for more information on definitions and data specifications. Race/ethnicity data were only available for < 40% of persons prescribed PrEP in each year. Number prescribed PrEP and PrEP coverage for race/ethnicity reported in the table were adjusted applying the distribution of records with known race/ethnicity to records with missing race/ethnicity.
aHispanic/Latino persons can be of any race.
Download and Share This Infographicimage icon

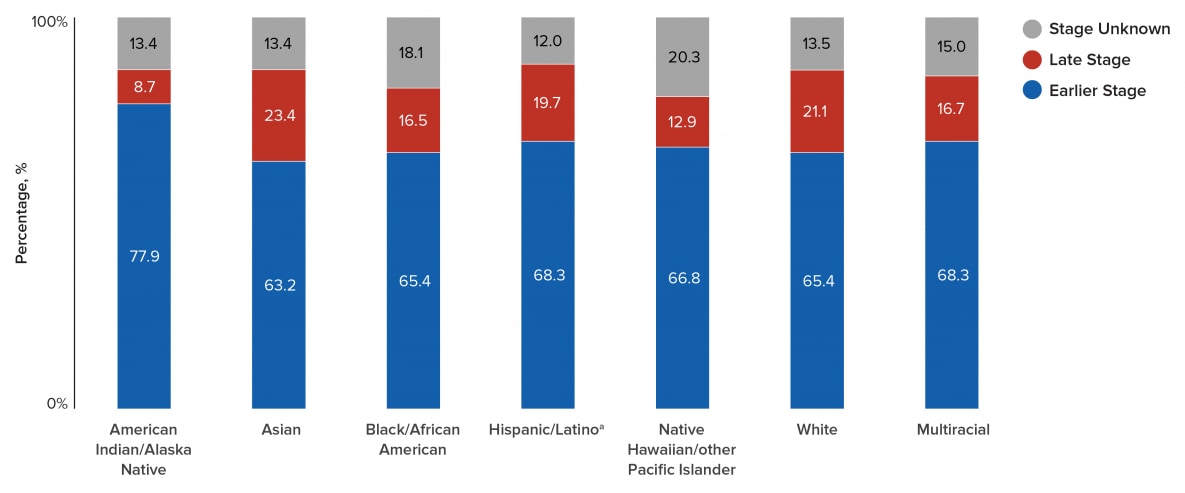
HIV care outcomes varied among MSM by race/ethnicity. For MSM of all racial/ethnic groups, greater than or equal to 63.2% of infections were diagnosed at an earlier stage. Yet, Asian (23.4%), White (21.1%), and Hispanic/Latino MSM (19.7%) had greater than or equal to 20% of infections classified as stage 3 (AIDS) at the time of diagnosis. Among Asian, White, and Hispanic/Latino MSM, infections classified as stage 3 (AIDS) increased with age at the time of diagnosis.

Note. See Guide on Acronyms and Initialisms, Data Tables, and Technical Notes for more information on Definitions and Data Specifications.
aHispanic/Latino persons can be of any race.
Download and Share This Infographicimage icon

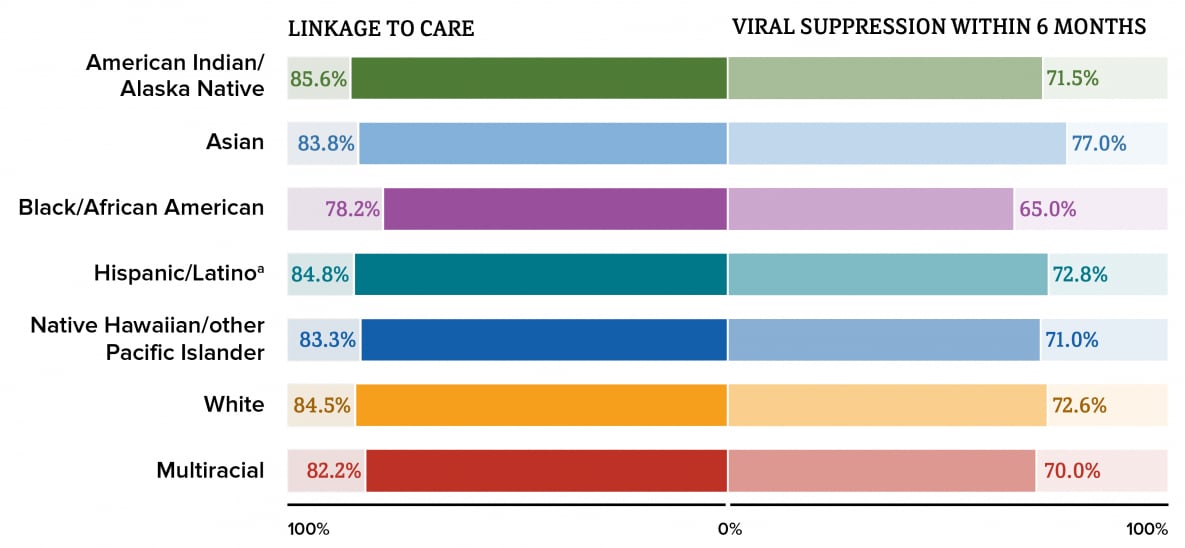
The highest percentage linked to care within 1 month of diagnosis was for American Indian/Alaska Native MSM (85.6%) and the lowest percentage linked to care within 1 month of diagnosis was for Black/African American MSM (78.2%). Among Black/African American MSM, persons aged 13–34 years had the lowest percentages linked to care within 1 month of diagnosis. The highest percentage for viral suppression within 6 months of diagnosis was for Asian MSM (77.0) and the lowest percentage for viral suppression within 6 months of diagnosis was for Black/African American MSM (65.0).

Note. See Guide on Acronyms and Initialisms, Data Tables, and Technical Notes for more information on Definitions and Data Specifications.
aHispanic/Latino persons can be of any race.
Download and Share This Infographicimage icon

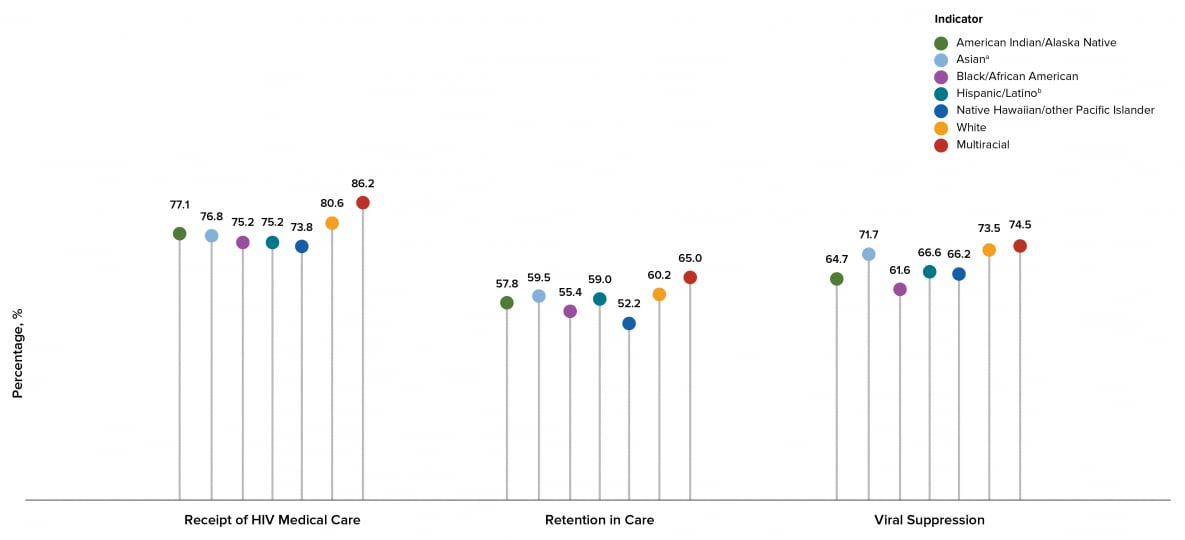
The highest percentage who received any HIV medical care was for Multiracial MSM (86.2%) and the lowest percentage was for Native Hawaiian/other Pacific Islander MSM (73.7%) (Table 3c, Figure 30). Among Native Hawaiian/other Pacific Islander MSM, persons aged 13–24 years had the lowest percentage who received any HIV medical care (68.0%) (Table 3d). The highest percentage retained in HIV medical care was for Multiracial MSM (65.0%) and the lowest percentage was for Native Hawaiian/other Pacific Islander MSM (52.0%). Among Native Hawaiian/other Pacific Islander MSM, persons aged 35–44 years had the lowest percentage retained in HIV medical care (47.5%) (Table 3d). The highest percentage who had viral suppression was for Multiracial MSM (74.5%) and the lowest percentage was for Black/African American MSM (61.6%).

Note. See Guide to Acronyms and Initialisms, Data Tables, and Technical Notes for more information on definitions and data specifications.
aIncludes Asian/Pacific Islander legacy cases.
bHispanic/Latino persons can be of any race.

Download and Share This Infographicimage icon

HIV care outcomes varied among PWID by sex at birth and race/ethnicity. Among persons with infection attributed to IDU by race/ethnicity, American Indian/Alaska Native males and White females had the highest percentages for persons diagnosed at an earlier stage and Asian males and African American females had the lowest percentages for persons diagnosed at an earlier stage at time of diagnosis. Among males with infection attributed to IDU, all racial/ethnic groups (except American Indian/Alaska Native and Native Hawaiian/other Pacific Islander persons) had over 20% of infections classified as stage 3 (AIDS) at time of diagnosis. Among females with infection attributed to IDU by race/ethnicity, Asian, African American/Black, and Hispanic/Latino persons had over 20% of infections classified as stage 3 (AIDS) at time of diagnosis.

Note. See Guide on Acronyms and Initialisms, Data Tables, and Technical Notes for more information on Definitions and Data Specifications.
aHispanic/Latino persons can be of any race.
*No cases diagnosed among this group.

Download and Share This Infographicimage icon

Among males with infection attributed to IDU by race/ethnicity, greater than or equal to 73.7% were linked to care within 1 month of diagnosis and greater than or equal to 41.0% had viral suppression within 6 months of diagnosis in 2019. Among females with infection attributed to IDU by race/ethnicity, greater than or equal to 67.7% were linked to care within 1 month of diagnosis and greater than or equal to 40.6% had viral suppression within 6 months of diagnosis in 2019.

Note. See Guide on Acronyms and Initialisms, Data Tables, and Technical Notes for more information on Definitions and Data Specifications.
aHispanic/Latino persons can be of any race.
*No cases diagnosed among this group.
Download and Share This Infographicimage icon

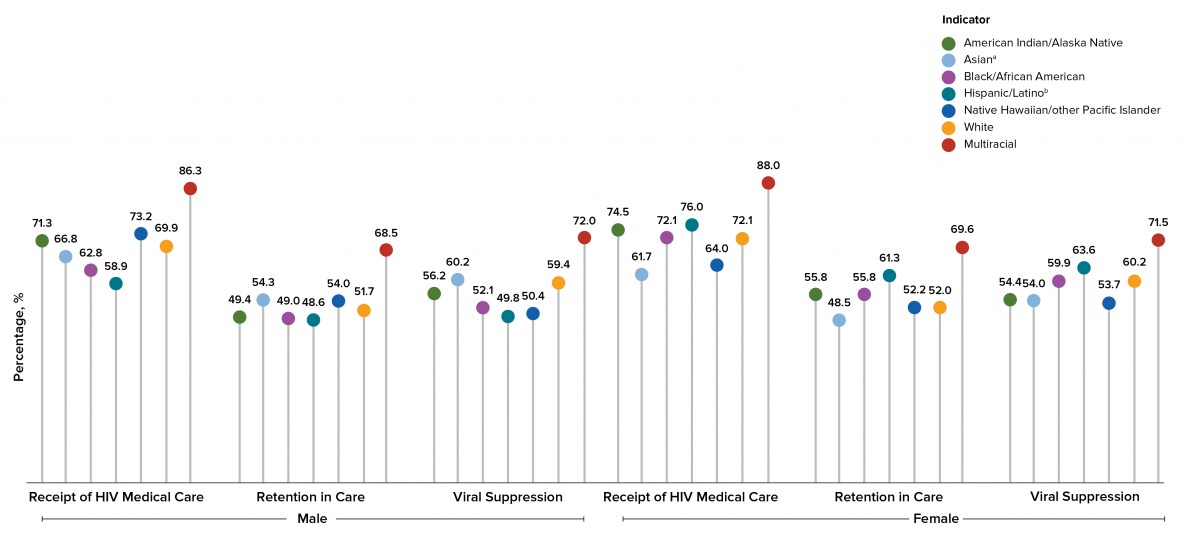
The highest percentage for PWID by sex at birth and race/ethnicity who received any HIV medical care was for Multiracial persons (males: 86.3%, females: 88.0%) and the lowest percentages were for Hispanic/Latino males (58.9%) and Asian females (61.7%). The highest percentage for PWID by sex at birth and race/ethnicity retained in HIV medical care was for Multiracial persons (males: 68.5%, females: 69.6%) and the lowest percentages were for Hispanic/Latino males (48.6%) and Asian females (48.5%). The highest percentage PWID by sex at birth and race/ethnicity who had viral suppression at the most recent viral load test was for Multiracial persons (males: 72.0%, females: 71.5%) and the lowest percentages were for Hispanic/Latino males (49.8%) and Native Hawaiian/other Pacific Islander females (53.7%).

Note. See Guide on Acronyms and Initialisms, Data Tables, and Technical Notes for more information on Definitions and Data Specifications.
aIncludes Asian/Pacific Islander legacy cases.
bHispanic/Latino persons can be of any race.
Download and Share This Infographicimage icon

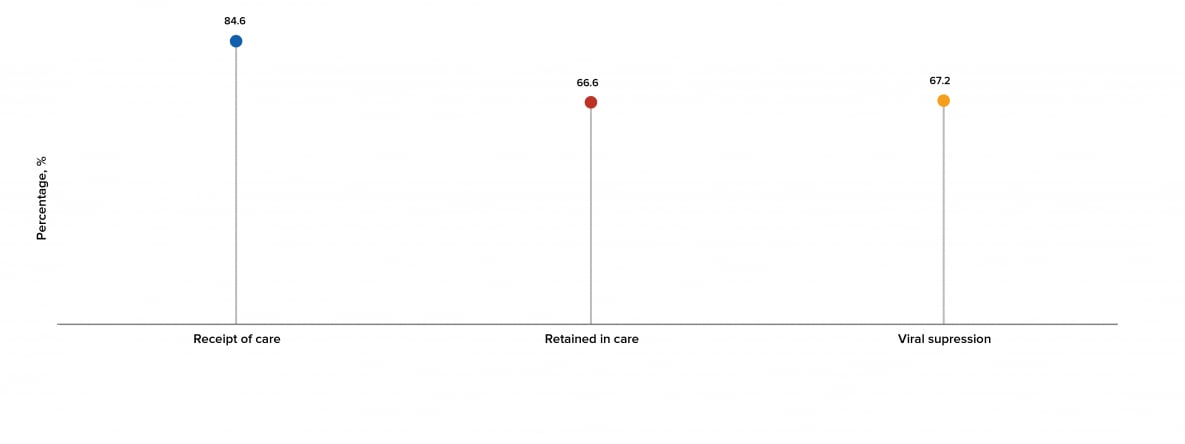
Among the 10,260 transgender persons and persons of additional gender identity living with diagnosed HIV, in 45 jurisdictions with complete laboratory reporting, 84.6% received HIV medical care, 66.6% were retained in HIV medical care, and 67.2% had viral suppression at their most recent test.

Note. See Guide to Acronyms and Initialisms, Data Tables, and Technical Notes for more information on definitions and data specifications.
Download and Share This Infographicimage icon

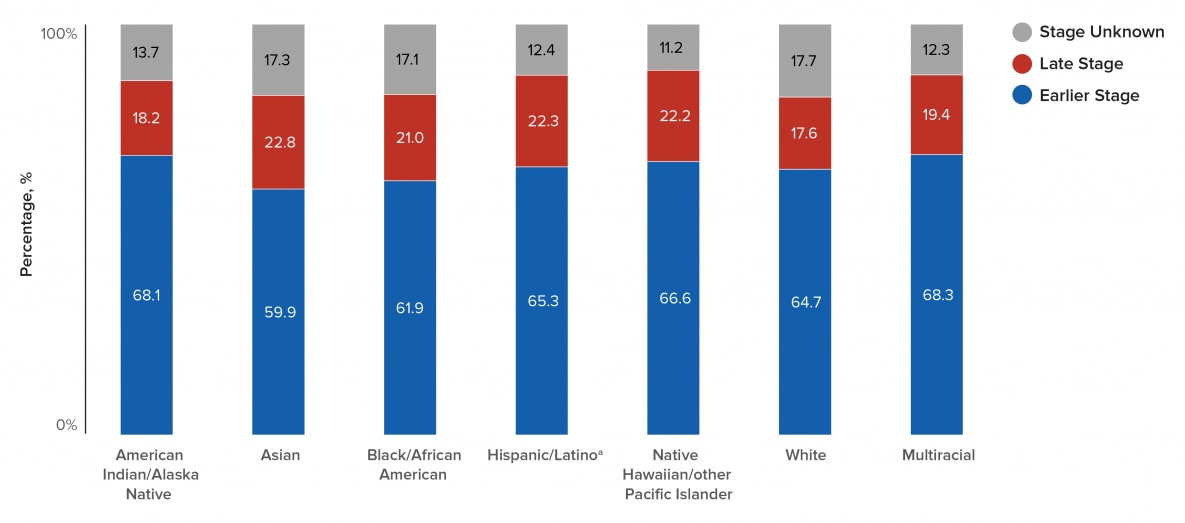
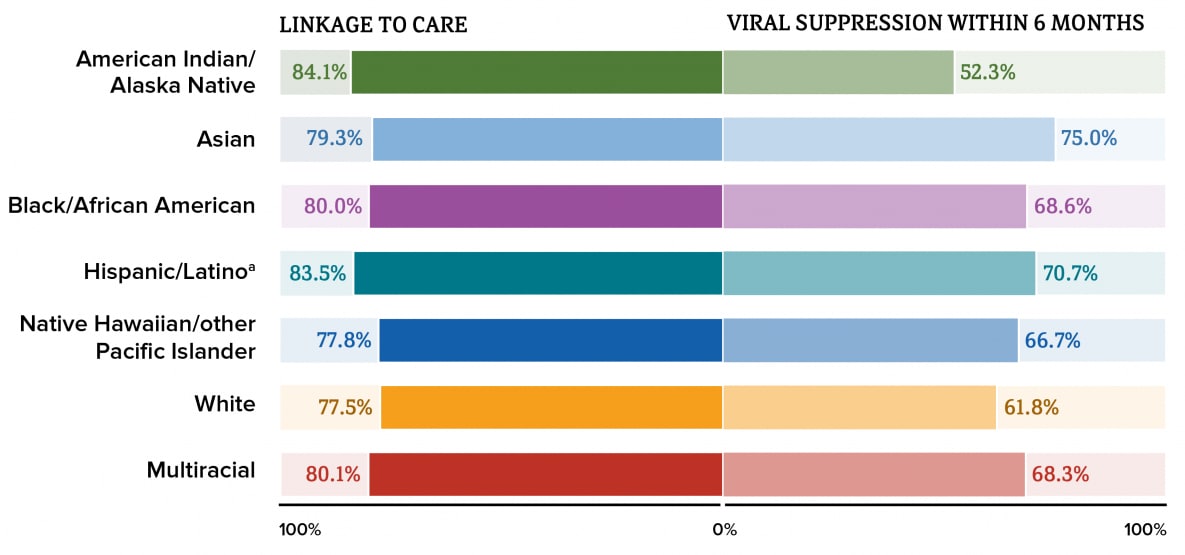
HIV care outcomes varied among women by race/ethnicity. For women of all racial/ethnic groups with diagnosed HIV, greater than or equal to 59.9% of infections were diagnosed at an earlier stage. Yet, Asian (22.8%), Hispanic/Latino (22.3%), Native Hawaiian/other Pacific Islander (22.2%), and Black/African American females (21.0%) had greater than or equal to 20% of infections classified as stage 3 (AIDS) at the time of diagnosis.

Note. See Guide on Acronyms and Initialisms, Data Tables, and Technical Notes for more information on Definitions and Data Specifications.
aHispanic/Latino persons can be of any race.
Download and Share This Infographicimage icon

The highest percentage linked to HIV medical care within 1 month of diagnosis was for American Indian/Alaska Native females (84.1%) and the lowest percentage linked to HIV medical care within 1 month of diagnosis was for White females (77.5%). The highest percentage for viral suppression within 6 months of diagnosis was for Asian females (75.0%) and the lowest percentage for viral suppression within 6 months of diagnosis was for American Indian/Alaska Native females (52.3%).

Note. See Guide on Acronyms and Initialisms, Data Tables, and Technical Notes for more information on Definitions and Data Specifications.
aHispanic/Latino persons can be of any race.
Download and Share This Infographicimage icon

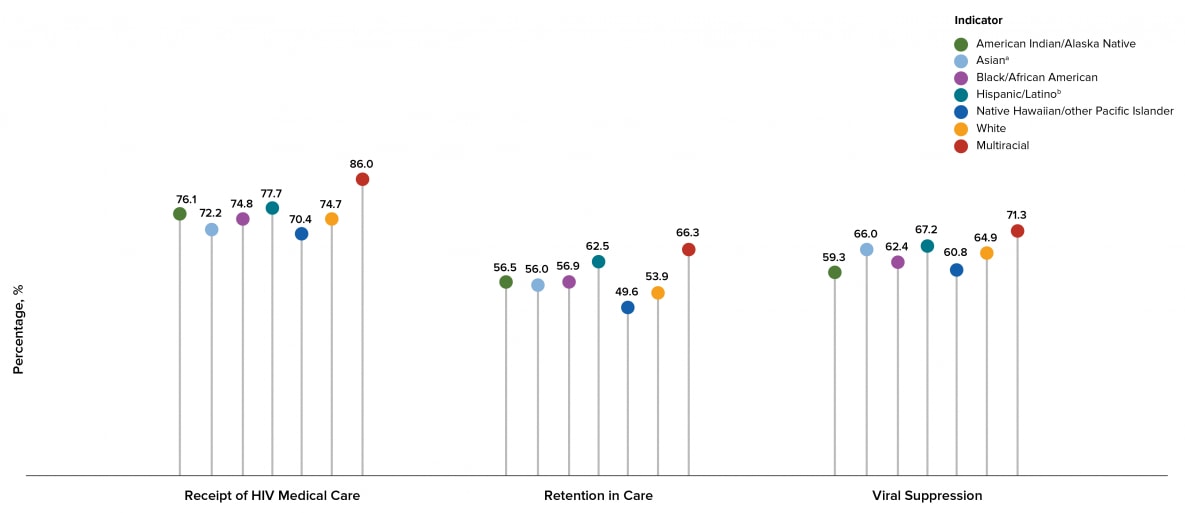
The highest percentage who received any HIV medical care was for multiracial females (86.0%) and the lowest percentage was for Native Hawaiian/other Pacific Islander females (70.4%). The highest percentage retained in HIV medical care was for multiracial females (66.3%) and the lowest percentage was for Native Hawaiian/other Pacific Islander females (49.6%). The highest percentage who had viral suppression was for multiracial females (71.3%) and the lowest percentage was for American Indian/Alaska Native females (59.3%).

Note. See Guide on Acronyms and Initialisms, Data Tables, and Technical Notes for more information on Definitions and Data Specifications.
aIncludes Asian/Pacific Islander legacy cases.
bHispanic/Latino persons can be of any race.
Download and Share This Infographicimage icon

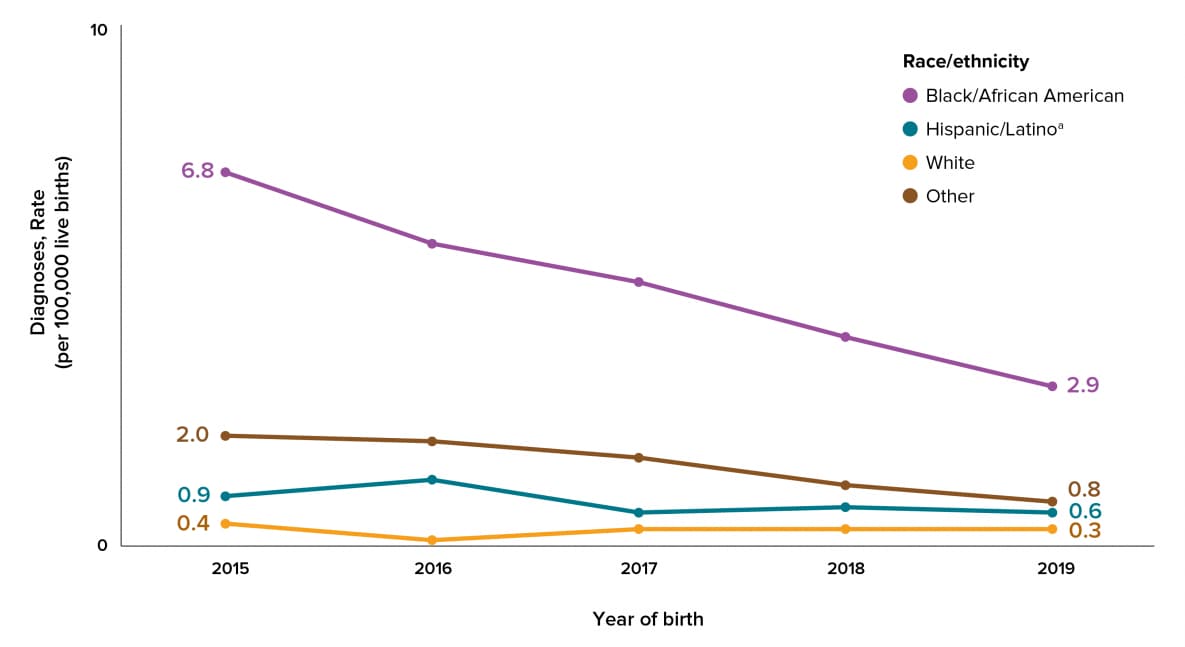
The overall annual rate of perinatally acquired HIV infections in the United States (regardless of place of birth) decreased from 1.6 per 100,000 live births in 2015 to 0.8 in 2019 (Table 10a). However, annual rates differed by race/ethnicity. Although the annual rate among Black/African American persons decreased from 6.8 in 2015 to 2.9 in 2019, the 2019 rate among Black/African American persons (2.9) was nearly 5 and 10 times the 2019 rates among Hispanic/Latino (0.6) and white persons (0.3).

Note. See Guide on Acronyms and Initialisms, Data Tables, and Technical Notes for more information on Definitions and Data Specifications.
aHispanic/Latino persons can be of any race.
Download and Share This Infographicimage icon

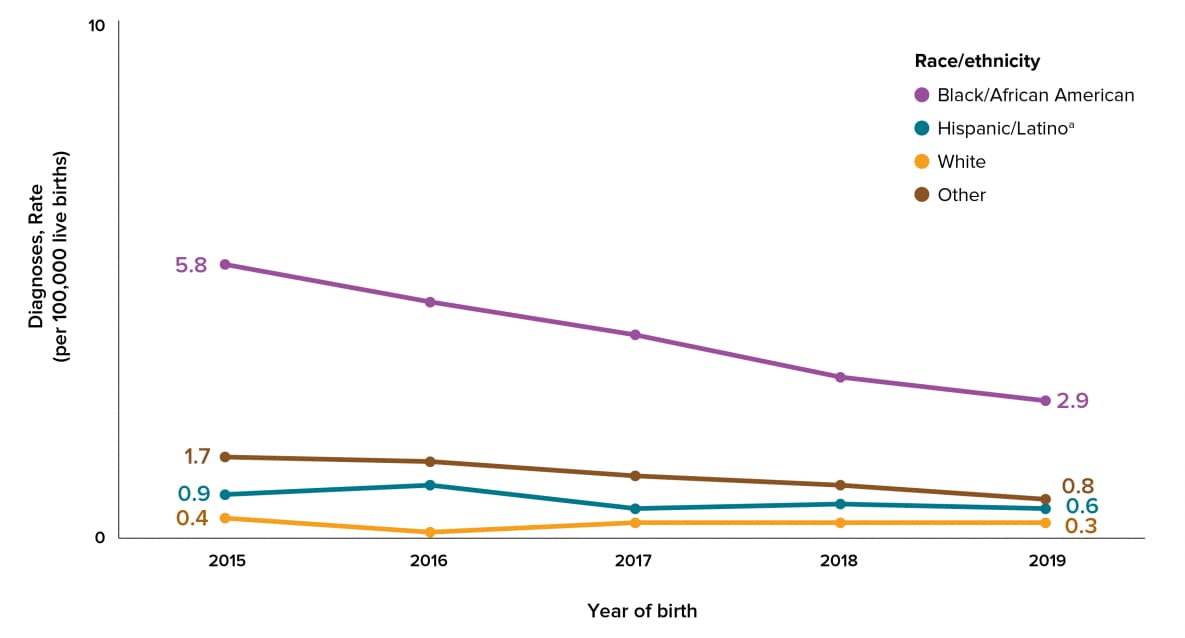
Among infants born in the United States, the overall annual rate of perinatally acquired HIV infections decreased from 1.4 per 100,000 live births in 2015 to 0.8 in 2019. However, annual rates differed by race/ethnicity. Although the annual rate among Black/African American persons decreased from 5.8 in 2015 to 2.9 in 2019, the 2019 rate among Black/African American persons (2.9) was nearly 5 and 10 times the 2019 rates among Hispanic/Latino (0.6) and white persons (0.3).

Note. See Guide on Acronyms and Initialisms, Data Tables, and Technical Notes for more information on Definitions and Data Specifications.
aHispanic/Latino persons can be of any race.
Download and Share This Infographicimage icon

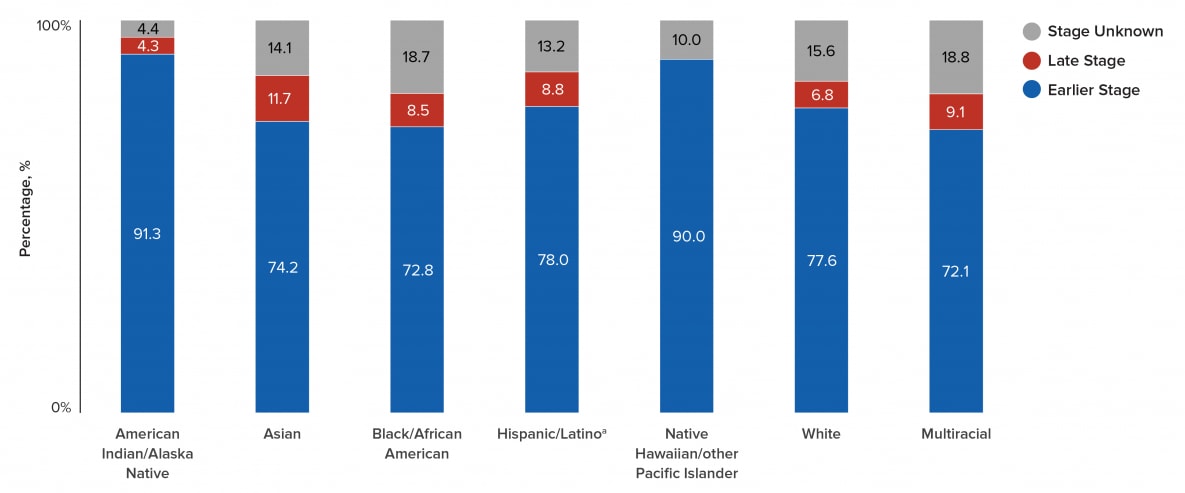
Although HIV care outcomes varied among young persons by race/ethnicity, greater than or equal to 72.1% of infections were diagnosed at an earlier stage for all racial/ethnic groups at time of diagnosis. Young Asian persons had the highest percentage of infections classified as stage 3 (AIDS) at time of diagnosis (11.7%) but no racial/ethnic group had  greater than 20% of infections classified as stage 3 (AIDS) at the time of diagnosis.

Note. See Guide on Acronyms and Initialisms, Data Tables, and Technical Notes for more information on Definitions and Data Specifications.
aHispanic/Latino persons can be of any race.
Download and Share This Infographicimage icon

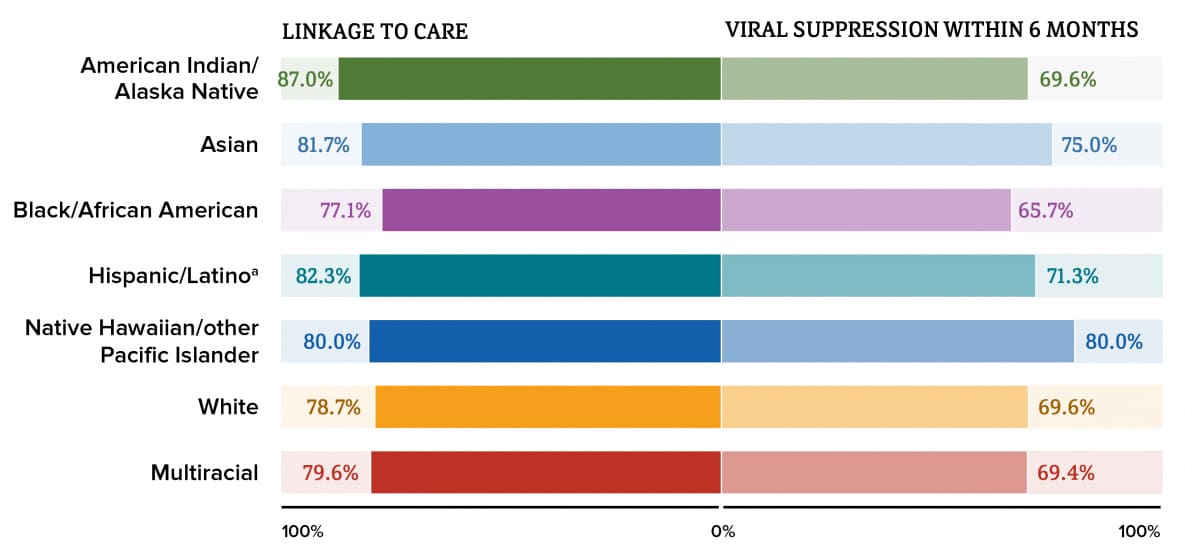
 The highest percentage linked to HIV medical care within 1 month of diagnosis was for American Indian/Alaska Native young persons (87.0%) and the lowest percentage linked to HIV medical care within 1 month of diagnosis was for Black/African American young persons (77.1%). The highest percentage for viral suppression within 6 months of diagnosis was for Native Hawaiian/other Pacific Islander young persons (80.0%) and the lowest percentage for viral suppression within 6 months of diagnosis was for Black/African American young persons (65.7%).

Note. See Guide on Acronyms and Initialisms, Data Tables, and Technical Notes for more information on Definitions and Data Specifications.
aHispanic/Latino persons can be of any race.
Download and Share This Infographicimage icon

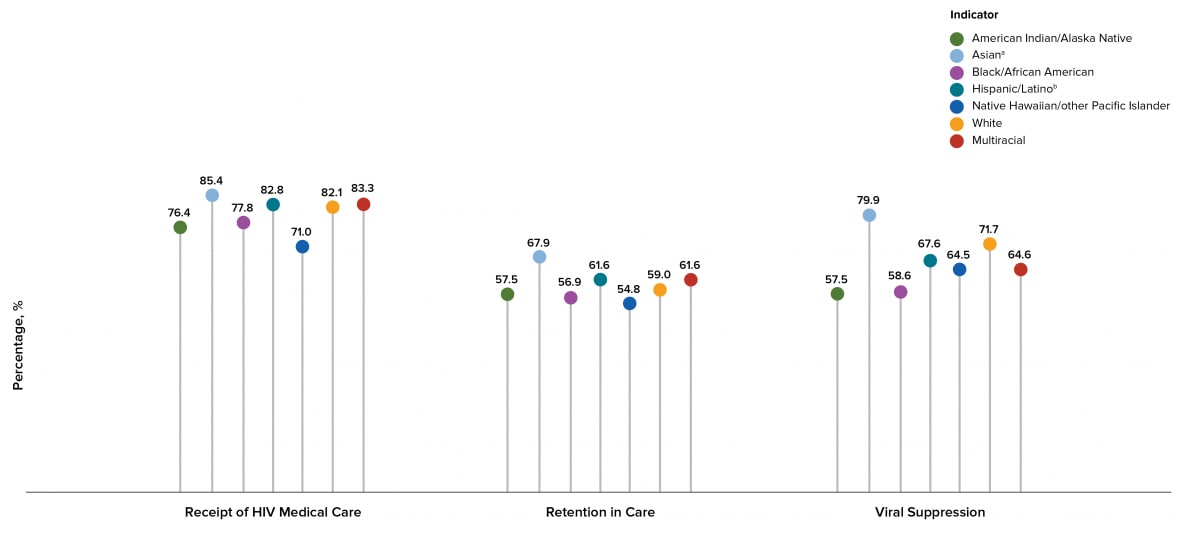
The highest percentage who received any HIV medical care was for Asian young persons (85.4%) and the lowest percentage was for Native Hawaiian/other Pacific Islander young persons (71.0%). The highest percentage retained in HIV medical care was for Asian young persons (67.9%) and the lowest percentage was for Native Hawaiian/other Pacific Islander young persons (54.8%). The highest percentage who had viral suppression at the most recent viral load test was for Asian young persons (79.9%) and the lowest percentage was for Black/African American young persons (58.6%).

Note. See Guide on Acronyms and Initialisms, Data Tables, and Technical Notes for more information on Definitions and Data Specifications.
aIncludes Asian/Pacific Islander legacy cases.
bHispanic/Latino persons can be of any race.
Download and Share This Infographicimage icon

By race/ethnicity, Hispanic/Latino persons were the closest to the target. The absolute percentage difference between the percentages for Hispanic/Latino persons (highest linkage to care group, 84.4%) and for Black/African American persons (lowest linkage to care group, 78.4%) was 6.0%. By transmission category, MMSC males were the closest to the target. IDU females were the farthest from the target. The percentages for MMSC males and IDU females were 0.864 and 0.791 times the 95% target respectively. By population area of residence, persons who resided in metropolitan areas were the closest to the targe. The percentages for persons who resided in metropolitan areas and in rural areas were 0.861 and 0.843 times the 95% target, respectively.

Note. See Guide on Acronyms and Initialisms, Data Tables, and Technical Notes for more information on Definitions and Data Specifications.
aHispanic/Latino persons can be of any race.
Download and Share This Infographicimage icon

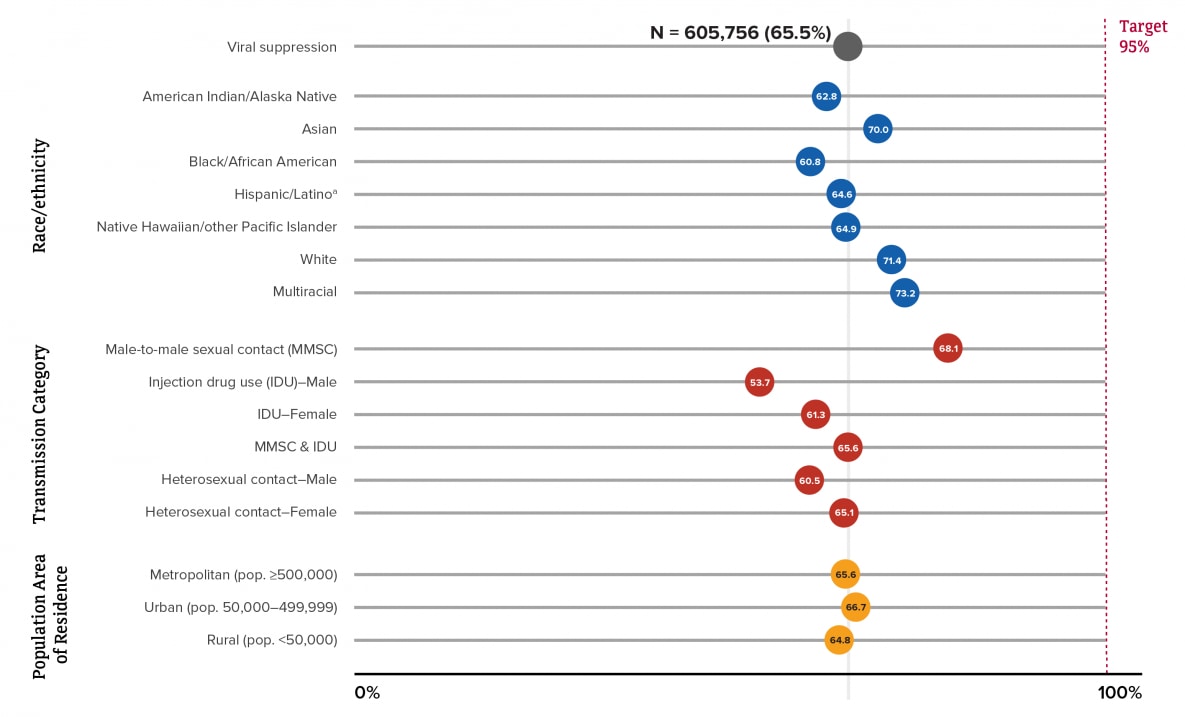
During 2019, 65.5% of persons living with diagnosed HIV infection at year-end were virally suppressed at the most recent test. Viral suppression was 29.5% from the 95% target (absolute percentage difference, 95.0%-65.5%) and was 0.689 times the 95% target (65.5/95.0). The 2019 status for viral suppression varied by race/ethnicity, transmission category, and population area of residence.

Note. See Guide on Acronyms and Initialisms, Data Tables, and Technical Notes for more information on Definitions and Data Specifications.
aHispanic/Latino persons can be of any race.

Download and Share This Infographicimage icon