At a glance

Background
Surveillance overview: national giardiasis case surveillance
Giardiasis is an illness caused by the protozoan parasite Giardia duodenalis (formerly called G. lamblia or G. intestinalis), which causes gastrointestinal symptoms such as diarrhea, abdominal cramps, bloating, weight loss, or malabsorption (1, 2). Each year in the United States, it is estimated that Giardia causes more than 1.2 million illnesses (3).

Giardiasis is a nationally notifiable disease; the first full year of reporting was 1993. National data are collected through passive surveillance. Healthcare providers and laboratories that diagnose confirmed giardiasis cases report to the local or state health departments. State and territorial health departments, the District of Columbia (DC), and the New York City health departments, in turn, voluntarily notify CDC of cases via the National Notifiable Disease Surveillance System (NNDSS). The number of health departments submitting can vary from year to year depending on which states have designated giardiasis as reportable in their jurisdictions.
State, District of Columbia, U.S. territory, and Freely Associated State public health agencies voluntarily notify CDC of giardiasis outbreaks via the National Outbreak Reporting System (NORS). NORS data are not presented here; however, summaries of data on waterborne disease outbreaks are published elsewhere.
Methods
Case definition
The definition of a confirmed case of giardiasis has changed over time. The first national case definition was published in 1997 (4), and a revised case definition was published in 2011 (5). The current (2011) case definition differs from the 1997 definition in clarifying that clinical symptoms are necessary for categorizing giardiasis cases as confirmed.
A confirmed case of giardiasis is defined as a case that meets the clinical description and the criteria for laboratory confirmation. Laboratory-confirmed giardiasis is defined as the detection of Giardia organisms, antigen, or DNA in stool, intestinal fluid, tissue samples, biopsy specimens, or other biological samples (5). Nonconfirmed cases of giardiasis include probable, suspected, and unknown cases. A probable case of giardiasis meets the clinical description and is epidemiologically linked to a confirmed case. A national case definition for suspected cases of giardiasis does not exist; the definition varies by state. Cases not classified as confirmed, probable, or suspect are classified as unknown.
Analysis
National giardiasis surveillance data for 2018 were analyzed using R version 3.6.1 and SAS 9.4. Data cleaning processes included case deduplication and the verification of case status (e.g., confirmed, nonconfirmed). Numbers, percentages, and incidence (cases per 100,000 population) of giardiasis were calculated in aggregate for the United States and separately for each reporting jurisdiction. Rates were calculated by dividing the number of giardiasis cases by each year's mid-year census estimates (6, 7) and multiplying by 100,000. Region and total population estimates included only jurisdictions that reported (Supplemental Table 1). In addition to analyzing data nationally and by reporting jurisdiction, data were analyzed by region (Northeast, Midwest, South, and West regions), as defined by the U.S. Census Bureau (8). To account for differences in the seasonal use of recreational water, the West region was further subdivided into Northwest and Southwest.
To examine reporting over time, giardiasis rates were calculated by year (1995 to 2018) and case status (confirmed or nonconfirmed). Average annual giardiasis rates were calculated by demographic variables (e.g., age and sex) and jurisdiction. Rates were not calculated for race, ethnicity, or month of onset due to large proportion of missing data for these variables (i.e., 27.9%, 42.2%, and 60.3%, respectively). Cases reported by territories were excluded from the analysis, because detailed demographic census data are not available to calculate rates by age and sex.
Acknowledgements
The authors gratefully acknowledge Julia Painter and Jonathan Yoder for their assistance in summarizing the annual reporting of giardiasis by state through previous work on the Domestic Epidemiology Team, Waterborne Disease Prevention Branch, CDC. This report is based on contributions by state and local epidemiologists and microbiologists.
Tables and Figures

*Cases per 100,000 population per year
§ Probable, suspect, and unknown cases
¶ First full year of national reporting
Since 2011, the incidence of reported, confirmed giardiasis cases has remained < 7.0 cases per 100,000 population. In 2018, there were 15,579 reported giardiasis cases in the United States (96.8% confirmed and 3.2% nonconfirmed).
| Region/Jurisdiction | No. | % | Incidence | No. of outbreak associated cases |
|---|---|---|---|---|
| Northeast | 4,164 | 26.7 | 7.5 | 46 |
| Connecticut | 197 | 1.3 | 5.5 | |
| Maine | 163 | 1.0 | 12.2 | |
| Massachusetts | 560 | 3.6 | 8.1 | 1 |
| New Hampshire | 124 | 0.8 | 9.1 | |
| New Jersey | 353 | 2.3 | 4.0 | |
| New York City ¶ | 1,114 | 7.2 | 13.3 | |
| New York State ¶ | 935 | 6.0 | 8.4 | 19 |
| Pennsylvania | 662 | 4.2 | 5.2 | 25 |
| Rhode Island | 56 | 0.4 | 5.3 | 1 |
| Vermont | NR | |||
| Midwest | 3,323 | 21.3 | 6.0 | 33 |
| Illinois | NR | |||
| Indiana | 239 | 1.5 | 3.6 | |
| Iowa | 260 | 1.7 | 8.2 | |
| Kansas | 128 | 0.8 | 4.4 | |
| Michigan | 459 | 2.9 | 4.6 | 4 |
| Minnesota | 508 | 3.3 | 9.1 | 22 |
| Missouri | 255 | 1.6 | 4.2 | |
| Nebraska | 126 | 0.8 | 6.5 | |
| North Dakota | 49 | 0.3 | 6.4 | 2 |
| Ohio | 509 | 3.3 | 4.4 | 5 |
| South Dakota | 114 | 0.7 | 12.9 | |
| Wisconsin | 676 | 4.3 | 11.6 | |
| South | 3,266 | 21.0 | 4.8 | 116 |
| Alabama | 218 | 1.4 | 4.5 | |
| Arkansas | 140 | 0.9 | 4.6 | |
| Delaware | 24 | 0.2 | 2.5 | |
| District of Columbia | 92 | 0.6 | 13.1 | |
| Florida | 1105 | 7.1 | 5.2 | 115 |
| Georgia | 651 | 4.2 | 6.2 | |
| Kentucky | NR | |||
| Louisiana | 222 | 1.4 | 4.8 | |
| Maryland | 165 | 1.1 | 2.7 | |
| Mississippi | NR | |||
| North Carolina | NR | |||
| Oklahoma | NR | |||
| South Carolina | 210 | 1.3 | 4.1 | 1 |
| Tennessee | NR | |||
| Texas | NR | |||
| Virginia | 334 | 2.1 | 3.9 | |
| West Virginia | 105 | 0.7 | 5.8 | |
| Northwest | 1,107 | 7.1 | 7.0 | 8 |
| Alaska | 71 | 0.5 | 9.6 | |
| Idaho | 138 | 0.9 | 7.9 | 7 |
| Montana | 89 | 0.6 | 8.4 | |
| Oregon | 323 | 2.1 | 7.7 | |
| Washington | 438 | 2.8 | 5.8 | 1 |
| Wyoming | 48 | 0.3 | 8.3 | |
| Southwest | 3,719 | 23.9 | 6.0 | 20 |
| Arizona | 149 | 1.0 | 2.1 | |
| California | 2,607 | 16.7 | 6.6 | |
| Colorado | 530 | 3.4 | 9.3 | 4 |
| Hawaii | 43 | 0.3 | 3.0 | 1 |
| Nevada | 80 | 0.5 | 2.6 | |
| New Mexico | 77 | 0.5 | 3.7 | |
| Utah | 233 | 1.5 | 7.4 | 15 |
| Total | 15,579 | 100 | 6.1 | 223 |
Abbreviation NR = Not Reportable
* Percentages might not total 100% because of rounding
§ Cases per 100,000 population
¶ New York State and New York City data are mutually exclusive
By jurisdiction, giardiasis incidence ranged from 2.1 per 100,000 population in Arizona to 13.3 per 100,000 population in New York City. By region, incidence of reported giardiasis cases ranged from 4.8 cases per 100,000 population in the South to 7.5 in the Northeast. Differences in incidence might reflect differences in risk factors or mode of transmission of Giardia; the magnitude of outbreaks; or the capacity or requirements to detect, investigate, and report cases.
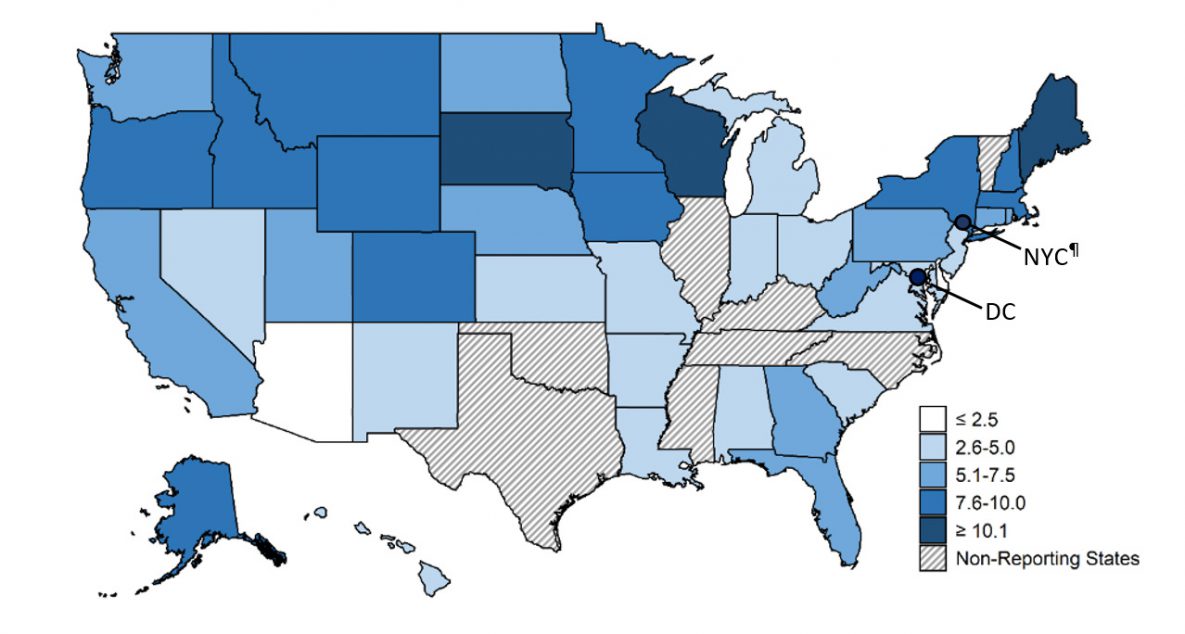
* Cases per 100,000 population
§ Non-reporting states included Illinois, Kentucky, Mississippi, North Carolina, Oklahoma, Tennessee, Texas, and Vermont
¶ New York State and New York City data are mutually exclusive
Giardiasis is geographically widespread across the United States. Although incidence rates appear to be consistently higher in the northern states, differences in incidence might reflect differences in risk factors or modes of transmission of Giardia; the magnitude of outbreaks; or the capacity or requirements to detect, investigate, and report cases.
| Characteristic | No. | % |
|---|---|---|
| Sex | ||
| Male | 9,561 | 61.4 |
| Female | 5,966 | 38.3 |
| Missing | 52 | 0.3 |
| Race | ||
| American Indian/Alaska Native | 94 | 0.6 |
| Asian/Pacific Islander | 374 | 2.4 |
| Black | 980 | 6.3 |
| White | 7,871 | 50.5 |
| Other | 1,917 | 12.3 |
| Missing | 4,343 | 27.9 |
| Ethnicity | ||
| Hispanic | 1,270 | 8.2 |
| Non-Hispanic | 7,731 | 49.6 |
| Missing | 6,578 | 42.2 |
| Total | 15,579 | 100.0 |
* Percentages might not total 100% because of rounding
During 2018, a total of 9,561 patients were male (61.4%) and 5,966 (38.3%) were female; 52 (0.3%) were missing data on sex. The majority of cases for whom data on race were available occurred among the classifications white (70.1%), black (8.7%), and Asian/Pacific Islander (3.3%). Data on race were not included for 27.9% of total annual case reports, and data on ethnicity were missing for 42.2% of case reports. The majority of patients for whom data on ethnicity were available were non-Hispanic (85.9%).

* Cases per 100,000 population
§ Age data missing for 10 patients
In 2018, the incidence of reported giardiasis cases was highest among patients aged 1-4 years, 25-29 years, and 55-59 years (incidence = 9.5, 7.5, and 7.2 cases per 100,000 population, respectively).

* Cases per 100,000 population
§ Age or sex data missing for 61 patients
Among both males and females, the highest incidence of giardiasis was among those ages 1–4 years (10.7 and 8.1 cases per 100,000 population, respectively). Rates were highest among males in every age group aside from the <1 year age group. The difference was most pronounced between sexes aged 25-29 years, with males presenting with 5.5 additional cases of giardiasis per 100,000 population compared to females.
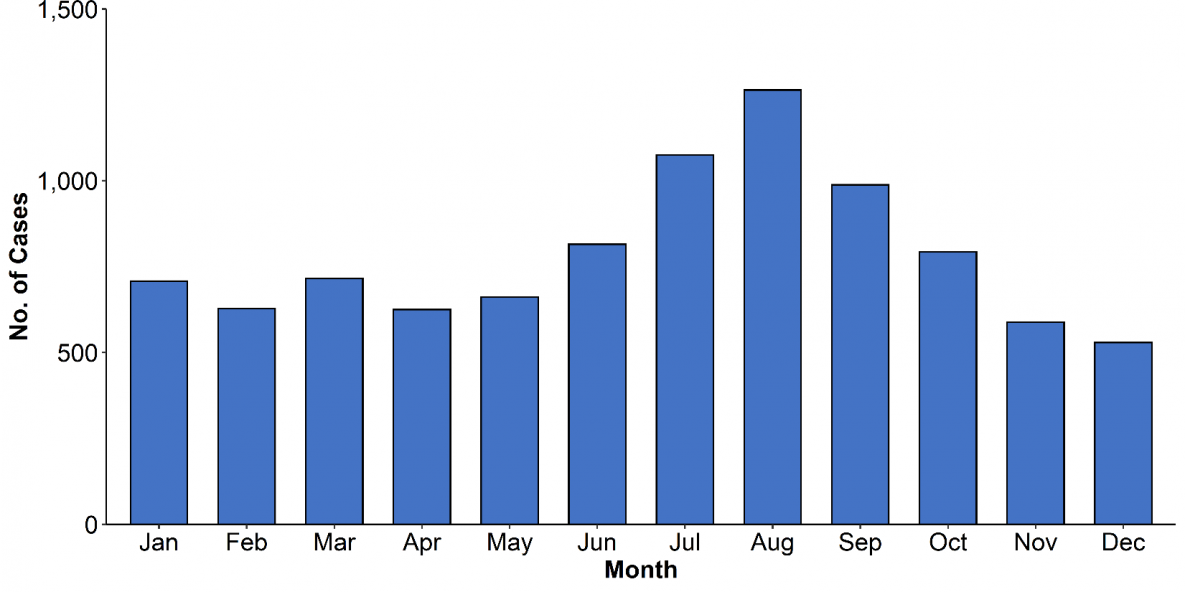
* Date of symptom onset data missing for 6,190 patients
In 2018, the majority of cases by symptom onset occurred between June and October, with a peak in August (n=1,264).
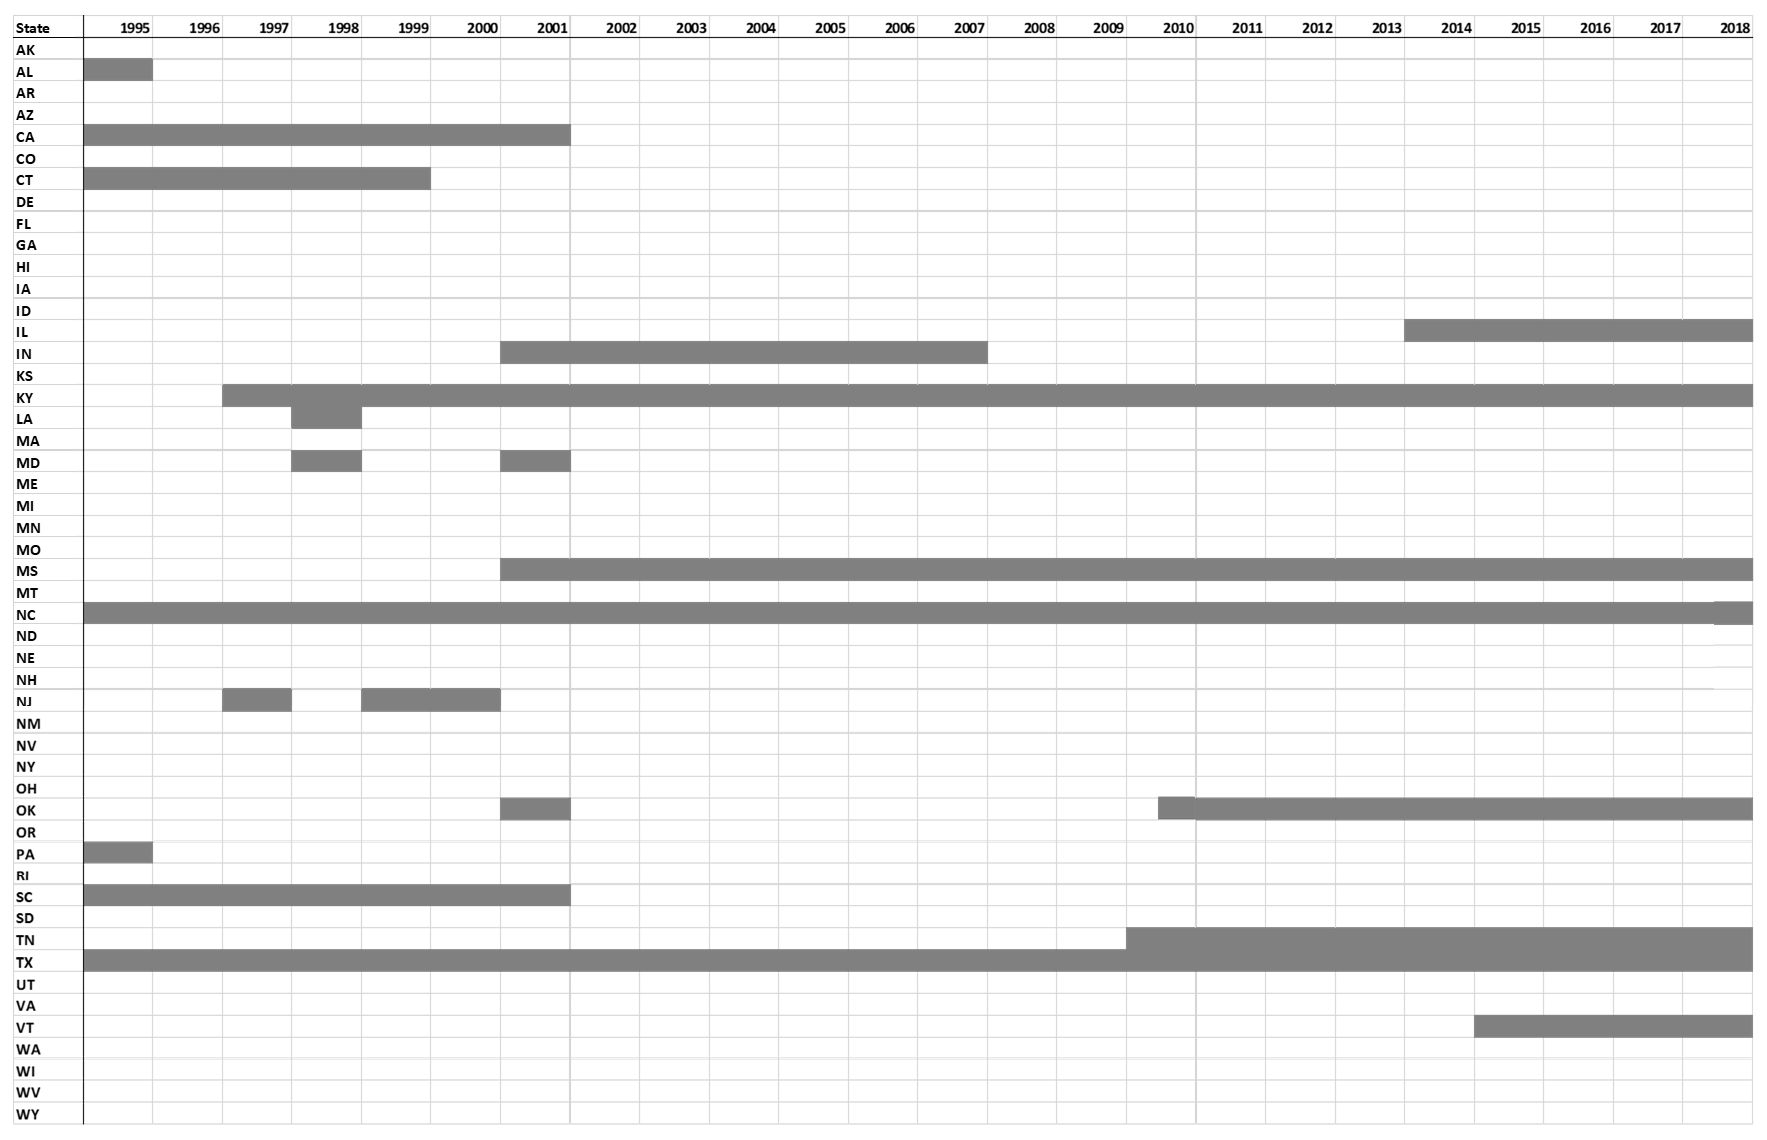
Table S1. Giardiasis reporting and non-reporting states (gray shading) — National Notifiable Diseases Surveillance System, United States, 1995–2018
- Huang DB, White AC. An updated review on Cryptosporidium and Giardia. Gastroenterol Clin North Am. 2006;35(2):291-314, viii. DOI: https://www.sciencedirect.com/science/article/pii/S0889855306000252?via%3Dihub
- Eberhard M, Gabrielli A, Montresor A, et al. Giardiasis (Giardia enteritis). In: Control of communicable diseases manual, 20th Heymann DL, Ed. Washington, DC; 2014:234-36.
- Scallan E, Hoekstra RM, Angulo FJ, et al. Foodborne illness acquired in the United States—major pathogens. Emerg Infect Dis 2011;17:7–15. DOI: 3201/eid1701.P11101.
- Giardiasis: 1997 case definition. Atlanta, GA: US Department of Health and Human Services, CDC; 1997. Available at https://ndc.services.cdc.gov/case-definitions/giardiasis-1997/.
- Giardiasis: 2011 case definition. Atlanta, GA: US Department of Health and Human Services, CDC; 2011. Available at https://ndc.services.cdc.gov/case-definitions/giardiasis-2011/.
- United States Department of Health and Human Services (US DHHS), Centers for Disease Control and Prevention (CDC), National Center for Health Statistics (NCHS), Bridged-Race Population Estimates, United States July 1st resident population by state, county, age, sex, bridged-race, and Hispanic origin. Compiled from 1990-1999 bridged-race intercensal population estimates (released by NCHS on 7/26/2004); revised bridged-race 2000-2009 intercensal population estimates (released by NCHS on 10/26/2012); and bridged-race Vintage 2018 (2010-2018) postcensal population estimates (released by NCHS on 6/25/2018). Available on CDC WONDER Online Database. Accessed at http://wonder.cdc.gov/bridged-race-v2018.html on Oct 16, 2019.
- US Census Bureau. Annual Estimates of the Resident Population for Incorporated Places of 50,000 or More, Ranked by July 1, 2018 Population: April 1, 2010 to July 1, 2018. Washington, DC: US Census Bureau; Release Date: May 2019. Available at https://www.census.gov/content/census/en/data/tables/time-series/demo/popest/2010s-total-cities-and-towns.html
- US Census Bureau. Census regions and divisions of the United States. Washington, DC: US Census Bureau. Available at https://www2.census.gov/geo/pdfs/maps-data/maps/reference/us_regdiv.pdf [PDF – 2 pages]