Key points
CDC collects and reports TBI data to understand: how many people are affected by this injury, who is most at risk, the leading ways a person may get a TBI, and whether programs to prevent TBI are working.
TBI in the United States
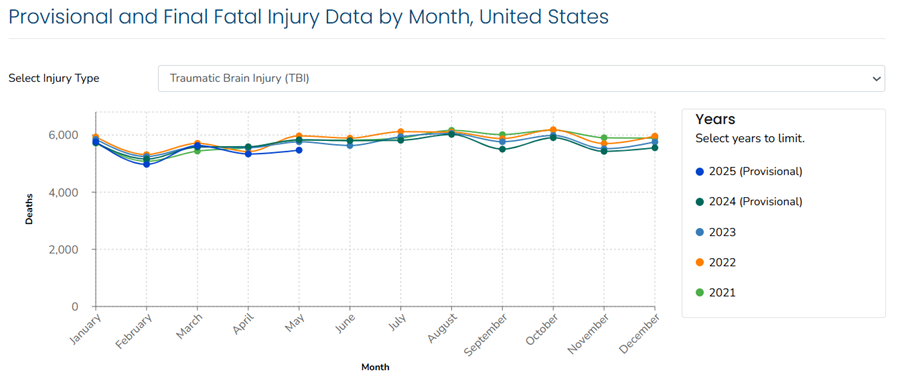
TBI is a major cause of death. This interactive chart shows the number of TBI-related deaths by month and year, including the most recent provisional data available.
Based on the most recent data:
- There were approximately 214,110 TBI-related hospitalizations in 2020A and 68,663 TBI-related deaths in 2023.1
- This represents more than 586 TBI-related hospitalizations and 190 TBI-related deaths per day.
- These estimates do not include the many TBIs that are only treated in the emergency department, primary care, urgent care, or those that go untreated.2
- People age 75 years and older had the highest numbers and rates of TBI-related hospitalizationsA and deaths.1 This age group accounts for about 32% of TBI-related hospitalizations and 28% of TBI-related deaths.
- Males were nearly two times more likely to be hospitalized (79.9 age-adjusted rate versus 43.7)A and three times more likely to die1 from a TBI than females (28.3 versus 8.4).
CDC reports
See the following CDC reports for more information on the leading causes of TBI and the groups of people at increased risk for TBI:
Surveillance and research to support data-driven solutions
CDC conducts research on preventing TBIs and reducing the chance for disability and other potential effects of these injuries.
- Read TBI research published by CDC.
- Learn more about the National Concussion Surveillance System, a state-of-the-art data collection effort designed to learn how many Americans (children and adults) get a concussion each year and the leading causes of this injury.
Content Source:
National Center for Injury Prevention and Control
- This rate was calculated using the weighted number of hospitalizations with a primary diagnosis of injury (ICD-10-CM diagnosis codes S00-S99; T07-T34; T36-T50 with a 6th character of 1, 2, 3, or 4; T36.9, T37.9, T39.9, T41.4, T42.7, T43.9, T45.9, T47.9, or T49.9 with a 5th character of 1, 2, 3, or 4; T51-T76; T79; O9A.2-O9A.5; T84.04; or M97) and an ICD-10-CM diagnosis code for an initial medical encounter of TBI (S02.0. S02.1, S02.80-S02.82, S02.91, S04.02, S04.03, S04.04, S06, S07.1, T74.4) in any diagnosis field and dividing it by the corresponding civilian non-institutionalized population per 100,000. Data source: Healthcare Cost and Utilization Project's National Inpatient Sample. 2020.
- Centers for Disease Control and Prevention, National Center for Injury Prevention and Control. Web-based Injury Statistics Query and Reporting System (WISQARS). Accessed April 2026. https://wisqars.cdc.gov/fatal-injury-trends/
- Bell JM, Breiding MJ, DePadilla L. CDC's efforts to improve traumatic brain injury surveillance. J Safety Res. 2017;62:253 -256.