Resources
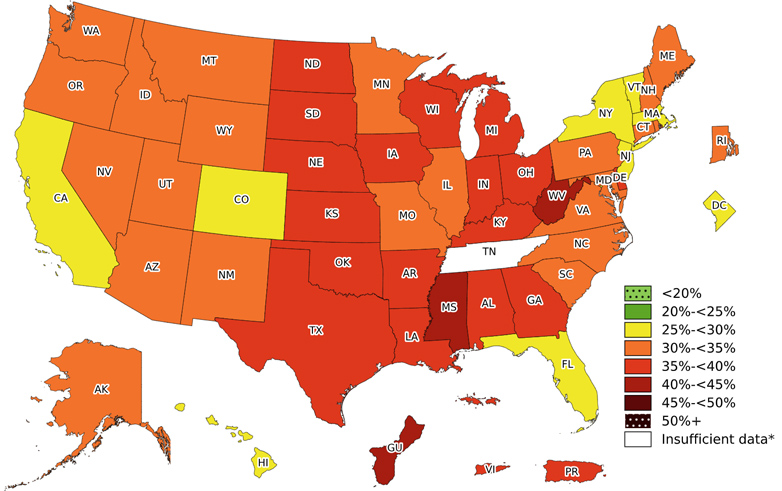
Includes obesity prevalence in states and territories. Prevalence varies by several factors.

Data and statistics on the prevalence of obesity among U.S. adults.

Data and statistics on the prevalence of obesity among US children and adolescents.

Facts about obesity prevalence and trends among young children enrolled in WIC.
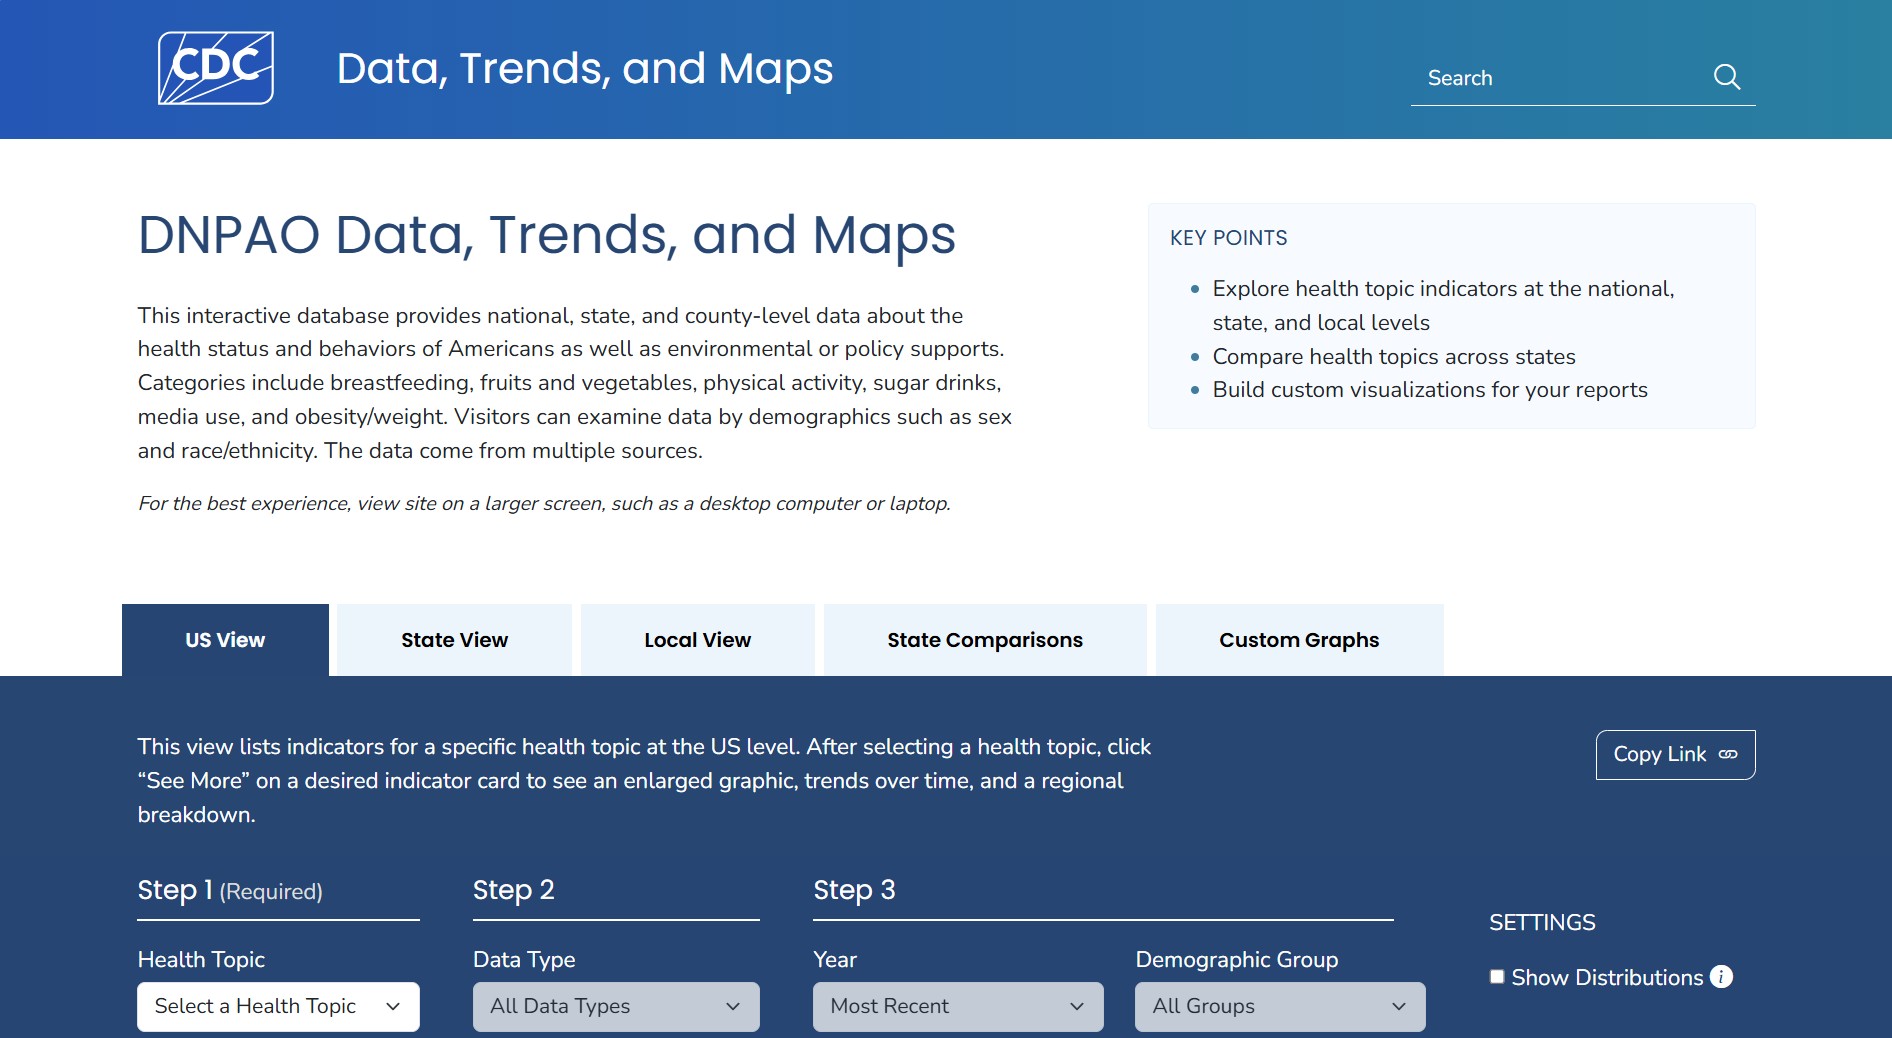
DNPAO's Data, Trends, and Maps of national and state health status and behaviors.
Additional resources

Overview of Community-Based Survey of Supports for Healthy Eating and Active Living (CBS HEAL).