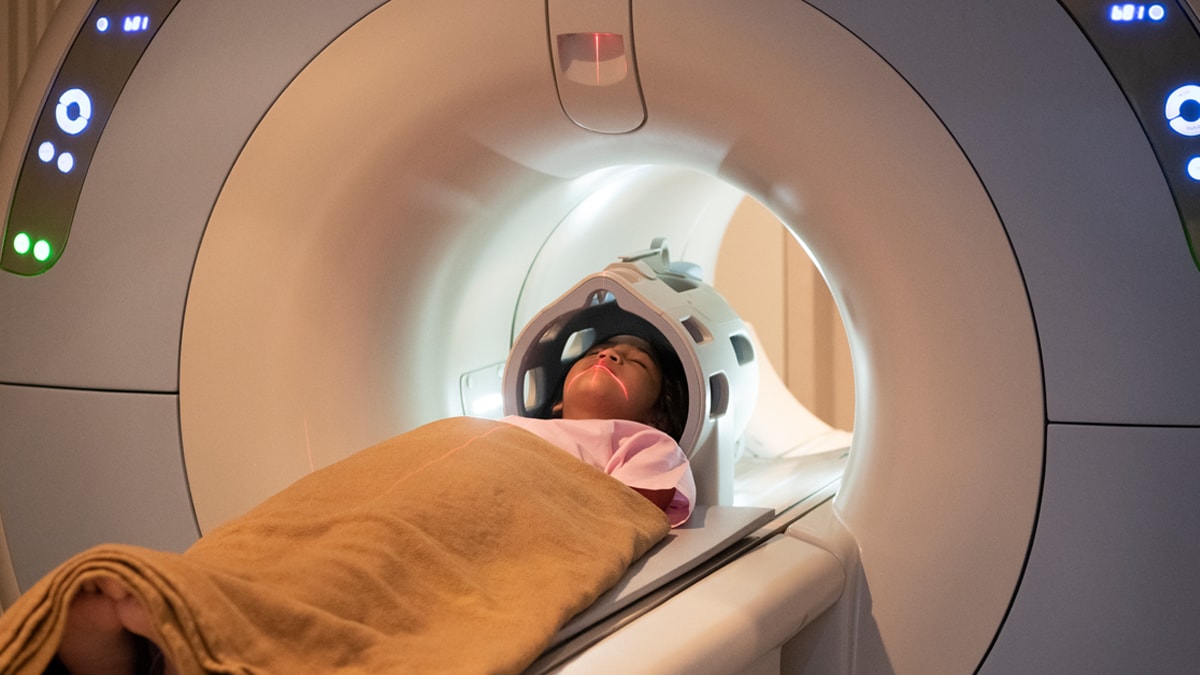
Information on testing, treatment, and recovery.
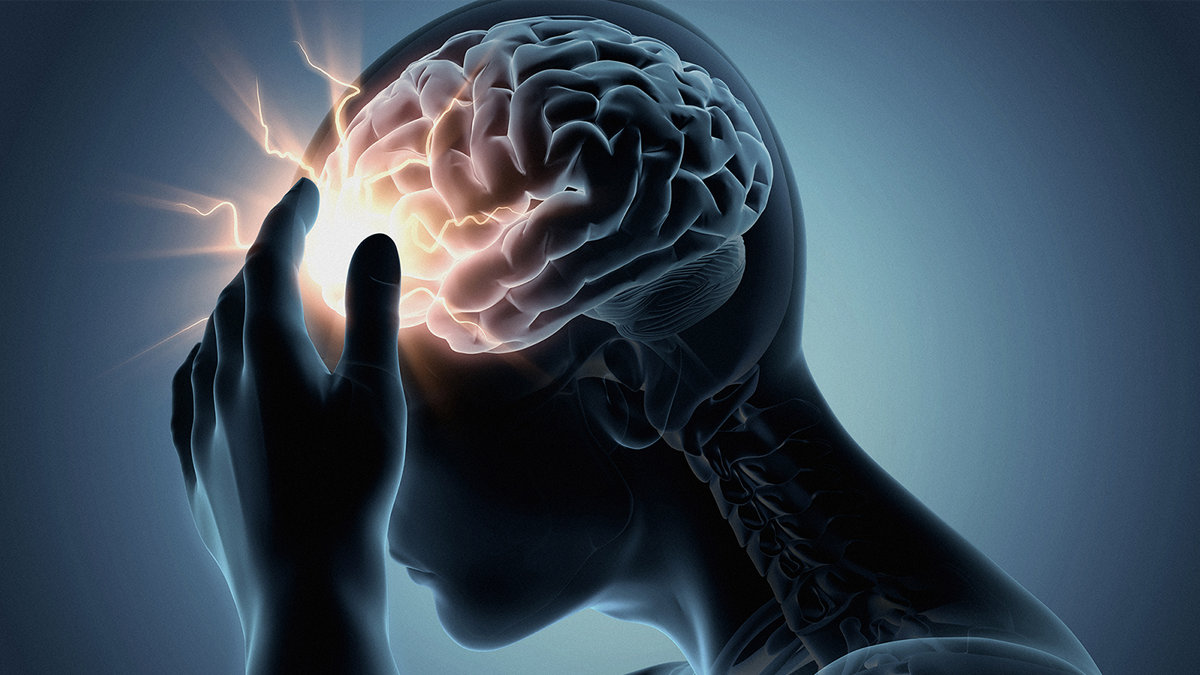
Information on potential health outcomes and causes.
Tips to prevent TBIs, including concussions.
Details on symptoms and danger signs.
Information about organizations that can help with care and recovery.
Learn about causes, groups at risk, and potential effects.
Get the latest TBI data.
For Medical Professionals

View recommendations for diagnosis and management of children with mild TBI.

View clinical recommendations for diagnosis and management of adults with mild TBI.
View resources to manage and prevent concussions.
CDC Programs
CDC HEADS UP is the go-to resource for concussion prevention.
Learn about HEADS UP online training courses to prevent concussions.

Learn about CDC's efforts to determine how many Americans get TBIs each year.
Learn about CDC's Core State Injury Prevention Program (CoreSIPP)