Teen Birth Rates for Urban and Rural Areas in the United States, 2007–2015
- Key findings
- Birth rates for teenagers declined across urban and rural counties from 2007 through 2015, with the largest declines in large urban counties.
- Declines in teen birth rates in all urban counties between 2007 and 2015 were largest in Arizona, Massachusetts, Connecticut, Minnesota, and Colorado.
- Declines in teen birth rates in rural counties between 2007 and 2015 were largest in Colorado and Connecticut.
- In 2015, teen birth rates were highest in rural counties and lowest in large urban counties for non-Hispanic white, non-Hispanic black, and Hispanic females aged 15–19.
- Summary
- Definitions
- Data sources and methods
- About the authors
- References
- Suggested citation
NCHS Data Brief No. 264, November 2016
PDF Version (392 KB)
Brady E. Hamilton, Ph.D., Lauren M. Rossen, Ph.D., and Amy M. Branum, Ph.D.
Key findings
Data from the National Vital Statistics System
- Birth rates for teenagers aged 15–19 declined in urban and rural counties from 2007 through 2015, with the largest declines in large urban counties and the smallest declines in rural counties.
- From 2007 through 2015, the teen birth rate was lowest in large urban counties and highest in rural counties.
- Declines in teen birth rates in all urban counties between 2007 and 2015 were largest in Arizona, Massachusetts, Connecticut, Minnesota, and Colorado, with 17 states experiencing a decline of 50% or more.
- Declines in teen birth rates in all rural counties between 2007 and 2015 were largest (50% or more) in Colorado and Connecticut.
- In 2015, teen birth rates were highest in rural counties and lowest in large urban counties for non-Hispanic white, non-Hispanic black, and Hispanic females.
Teen birth rates have demonstrated an unprecedented decline in the United States since 2007 (1). Declines occurred in all states and among all major racial and Hispanic-origin groups, yet disparities by both geography and demographic characteristics persist (2,3). Although teen birth rates and related declines have been described by state, patterns by urban–rural location have not yet been examined. This report describes trends in teen birth rates in urban (metropolitan) and rural (nonmetropolitan) areas in the United States overall and by state from 2007 through 2015 and by race and Hispanic origin for 2015.
Keywords: teen childbearing, geography, race and Hispanic origin, National Vital Statistics System
Birth rates for teenagers declined across urban and rural counties from 2007 through 2015, with the largest declines in large urban counties.
- From 2007 through 2015, teen birth rates fell 50% in large urban counties, from 38.1 births per 1,000 females aged 15–19 to 18.9 (Figure 1). Teen birth rates were lowest in large urban counties, with the rates in these counties lower than the overall rate for the United States.
- Teen birth rates for medium and small urban counties fell 44% from 2007 through 2015, to 24.3 births per 1,000 from 43.1. From 2007 through 2015, the rates in these counties were nearly the same as the U.S. teen birth rate.
- From 2007 through 2015, the rate in rural counties fell 37%, to 30.9 births per 1,000 from 49.1. Teen birth rates were highest in rural counties, with the rates in these counties greater than the national rate.
Figure 1. Teen birth rates, by urbanization level of county: United States, 2007–2015
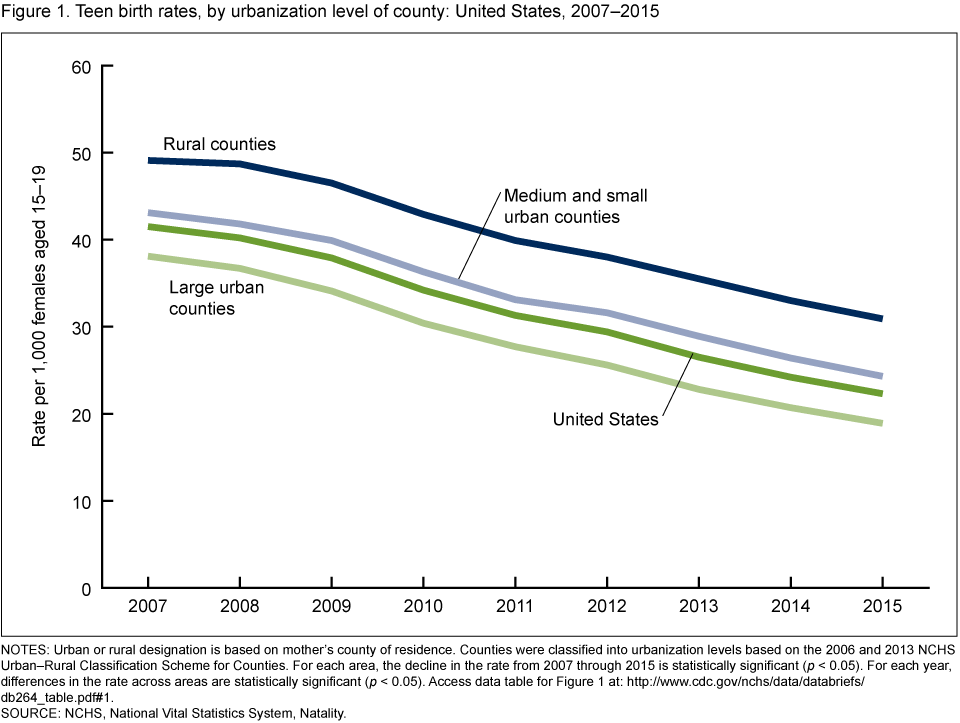
NOTES: Urban or rural designation is based on mother’s county of residence. Counties were classified into urbanization levels based on the 2006 and 2013 NCHS Urban–Rural Classification Scheme for Counties. For each area, the decline in the rate from 2007 through 2015 is statistically significant (p < 0.05). For each year, differences in the rate across areas are statistically significant (p < 0.05). Access data table for Figure 1.
SOURCE: NCHS, National Vital Statistics System, Natality.
Declines in teen birth rates in all urban counties between 2007 and 2015 were largest in Arizona, Massachusetts, Connecticut, Minnesota, and Colorado.
- Teen birth rates in all urban counties decreased for all states and the District of Columbia between 2007 and 2015 (Figure 2). Decreases ranged from 24% for teenagers in North Dakota to 57% for teenagers in Arizona.
- Decreases of 50% or more in teen birth rates among all urban counties occurred in 17 states (Arizona, California, Colorado, Connecticut, Florida, Georgia, Maryland, Massachusetts, Minnesota, Mississippi, New Jersey, New Mexico, North Carolina, Rhode Island, Utah, Vermont, and Virginia).
- Urban counties in two states, North Dakota and West Virginia, experienced decreases in teen birth rates of less than 30%.
Figure 2. Percent change in the teen birth rate for all urban counties: United States, each state, 2007 and 2015
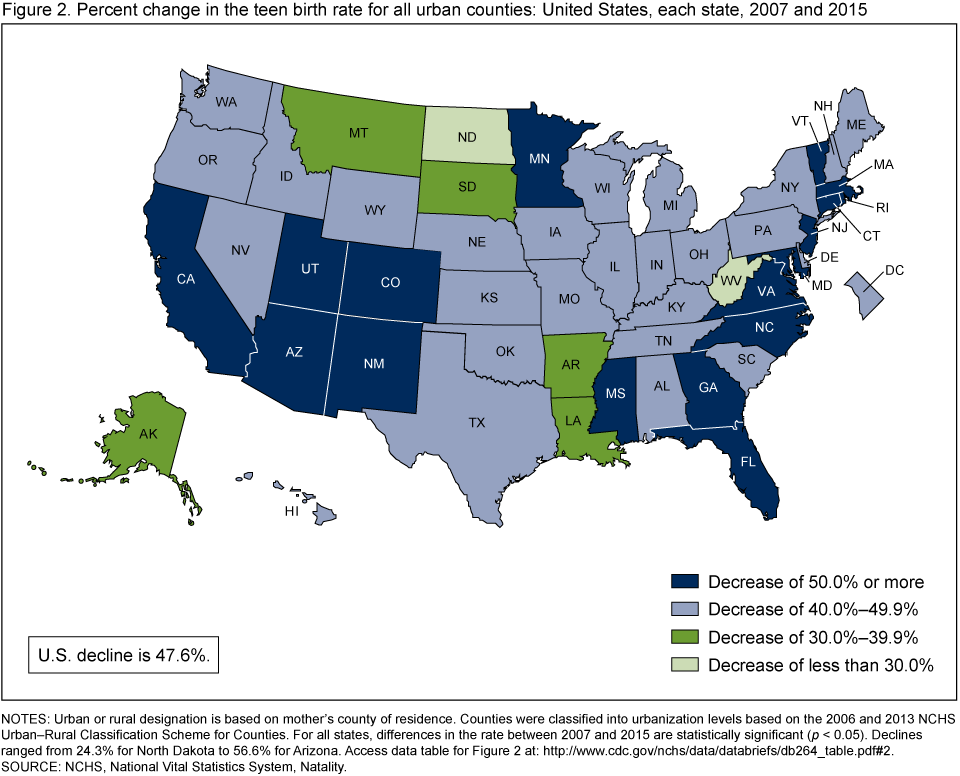
NOTES: Urban or rural designation is based on mother’s county of residence. Counties were classified into urbanization levels based on the 2006 and 2013 NCHS Urban–Rural Classification Scheme for Counties. For all states, differences in the rate between 2007 and 2015 are statistically significant (p < 0.05). Declines ranged from 24.3% for North Dakota to 56.6% for Arizona. Access data table for Figure 2.
SOURCE: NCHS, National Vital Statistics System, Natality.
Declines in teen birth rates in rural counties between 2007 and 2015 were largest in Colorado and Connecticut.
- Teen birth rates in rural counties decreased for 46 states between 2007 and 2015 (Figure 3). Decreases ranged from 18% for teenagers in Alaska to 73% for teenagers in Connecticut. Rural county rates in two states were unreliable, and two states and the District of Columbia have no rural counties according to the classification method used.
- Decreases of 50% or more in the rural teen birth rate occurred in Colorado and Connecticut.
- Decreases of 40%–49% occurred in Georgia, Mississippi, New Hampshire, North Carolina, South Carolina, Utah, Vermont, Virginia, Washington, and Wisconsin.
- Maryland, Montana, North Dakota, and Pennsylvania had the smallest decreases (less than 30%).
Figure 3. Percent change in the teen birth rate for rural counties: United States, each state, 2007 and 2015
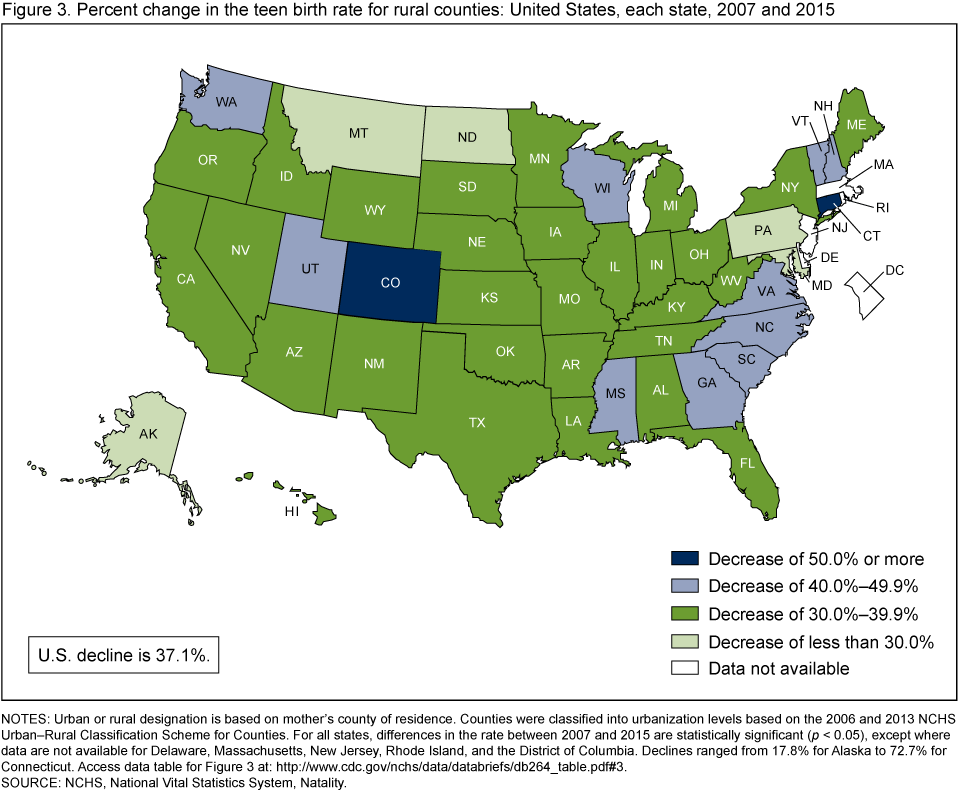
NOTES: Urban or rural designation is based on mother’s county of residence. Counties were classified into urbanization levels based on the 2006 and 2013 NCHS Urban–Rural Classification Scheme for Counties. For all states, differences in the rate between 2007 and 2015 are statistically significant (p < 0.05), except where data are not available for Delaware, Massachusetts, New Jersey, Rhode Island, and the District of Columbia. Declines ranged from 17.8% for Alaska to 72.7% for Connecticut. Access data table for Figure 3.
SOURCE: NCHS, National Vital Statistics System, Natality.
In 2015, teen birth rates were highest in rural counties and lowest in large urban counties for non-Hispanic white, non-Hispanic black, and Hispanic females aged 15–19.
- In 2015, the teen birth rate among non-Hispanic white females was lowest in large urban counties (10.5 births per 1,000) (Figure 4). The rate was 68% higher in medium and small urban counties (17.6 births per 1,000), and more than 2.5 times higher in rural counties (26.8 per 1,000) than in large urban counties.
- In 2015, teen birth rates among non-Hispanic black females ranged from a low of 29.1 births per 1,000 females in large urban counties to a high of 39.6 in rural counties.
- In 2015, the teen birth rate among Hispanic females was lowest in large urban counties (31.4 births per 1,000). The rates among Hispanic females were 27% higher in medium and small urban counties (40.0 births per 1,000) and 50% higher in rural counties (47.0 births per 1,000).
Figure 4. Teen birth rates, by selected race and Hispanic origin of mother and urbanization level of county: United States, 2015
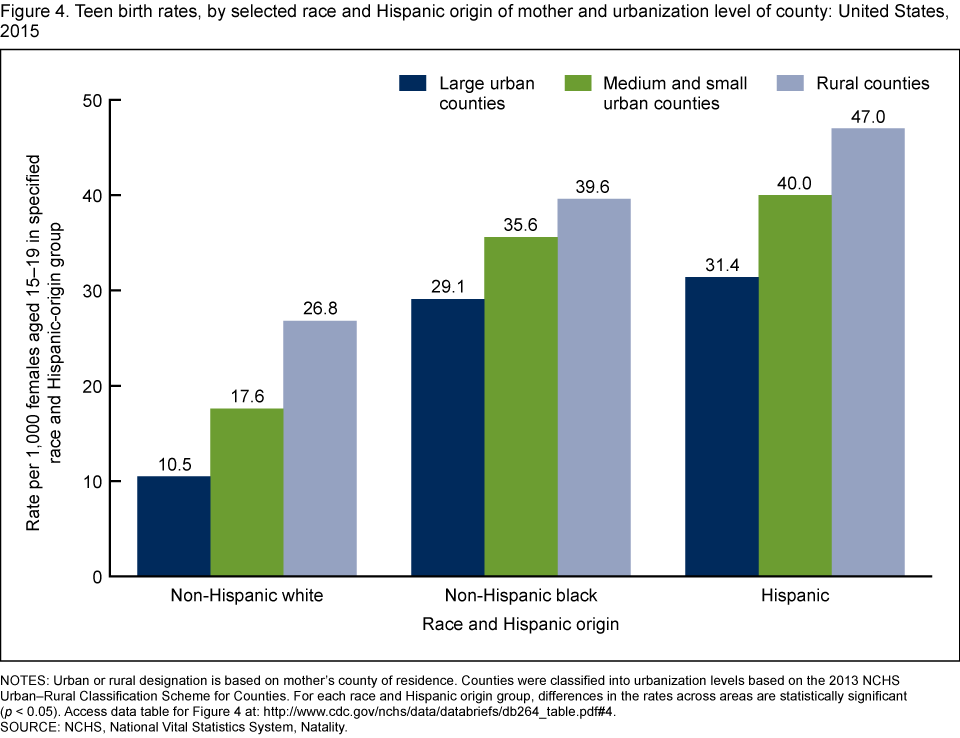
NOTES: Urban or rural designation is based on mother’s county of residence. Counties were classified into urbanization levels based on the 2013 NCHS Urban–Rural Classification Scheme for Counties. For each race and Hispanic origin group, differences in the rates across areas are statistically significant (p < 0.05). Access data table for Figure 4.
SOURCE: NCHS, National Vital Statistics System, Natality.
Summary
Patterns of unprecedented declines in teen birth rates have occurred in the United States in recent years in both urban and rural areas. From 2007 through 2015, teen birth rates declined 50% in large urban counties, 44% in medium and small urban counties, and 37% in rural counties. These declines generally occurred among all states, although to varying degrees. Colorado and Connecticut experienced the greatest declines in teen birth rates among rural counties, whereas overall urban declines were greatest in Arizona, Massachusetts, Connecticut, Minnesota, and Colorado.
Although teen birth rates have declined among non-Hispanic white, non-Hispanic black, and Hispanic females, some disparities still exist among these groups at the national level and within urban and rural counties (4). Teen birth rates differ according to urbanization status, with the highest rates occurring in rural counties and the lowest rates occurring in large urban counties; this pattern is consistent among non-Hispanic white, non-Hispanic black, and Hispanic females.
Definitions
Teen birth rate: The number of births to females aged 15–19 per 1,000 females aged 15–19.
Urban and rural county: Urban or rural designation is based on the county of maternal residence (5). Counties were classified according to their metropolitan status using the National Center for Health Statistics (NCHS) Urban–Rural Classification Scheme (https://www.cdc.gov/nchs/data_access/urban_rural.htm), by merging the county of maternal residence geographic federal information processing standard (FIPS) codes with county-level FIPS codes from either the 2006 (for births in 2007–2012) or 2013 (for births in 2013–2015) NCHS Urban–Rural Classification Scheme data set. Counties identified as metropolitan were considered to be urban, and all other counties (nonmetropolitan) were considered to be rural. Metropolitan counties include large central cities, the fringes of large cities (suburbs), medium cities, and small cities. Nonmetropolitan counties include micropolitan statistical areas, noncore areas, and include open countryside, rural towns (populations of less than 2,500), and areas with populations of 2,500–49,999 that are not part of larger labor market areas (metropolitan areas). Due to the range in size of urban counties, counties designated as urban were subdivided into two levels, large (which includes large central and the fringes of large cities) and medium and small urban (which includes medium and small cities), for comparative purposes in this report. Research has confirmed that these categories are meaningful for analyzing birth data (6). There are no counties designated as rural in New Jersey, Rhode Island, and the District of Columbia according to the NCHS urban–rural classification.
Race and Hispanic origin: Race and Hispanic origin are reported separately on birth certificates. Persons of Hispanic origin may be of any race. Persons of non-Hispanic ancestry are further classified by race because there are substantial differences in fertility and maternal characteristics between Hispanic and non-Hispanic persons. Multiple-race data reported since 2003 were bridged to single-race categories for comparability among states and for trend analyses (1).
Data sources and methods
This report contains data from the birth data set, which is part of the National Vital Statistics System, and from the NCHS Urban–Rural Classification Scheme. The birth data set is the primary data set for analyzing birth trends and patterns in the United States. Birth data sets are available from: https://www.cdc.gov/nchs/data_access/vitalstatsonline.htm.
The NCHS Urban–Rural Classification Scheme data provide geographic FIPS codes and NCHS urban–rural classification scheme information for all counties in the United States and are available from: https://www.cdc.gov/nchs/data_access/urban_rural.htm.
Population data for computing birth rates were provided by the U.S. Census Bureau and are based on the April 1, 2000, and April 1, 2010, censuses (7).
Rates based on fewer than 20 births in the numerator are considered not statistically reliable [and an asterisk (*) is shown in place of the rate]. There were two areas with unreliable rates: rural counties in Delaware in 2015 and rural counties in Massachusetts in 2007.
References to increases or decreases in rates indicate that differences are statistically significant at the 0.05 level. Trends in the rates at the national level were evaluated using the Joinpoint Regression Program (8).
About the authors
Brady E. Hamilton, Lauren M. Rossen, and Amy M. Branum are with the National Center for Health Statistics, Division of Vital Statistics, Reproductive Statistics Branch.
References
- Martin JA, Hamilton BE, Osterman MJK, Driscoll AK. Births: Final data for 2015. National vital statistics reports. Hyattsville, MD: National Center for Health Statistics. 2016 [Forthcoming].
- Ventura SJ, Hamilton BE, Mathews TJ. National and state patterns of teen births in the United States, 1940–2013. National vital statistics reports; vol 63 no 4. Hyattsville, MD: National Center for Health Statistics. 2014.
- Romero L, Pazol K, Warner L, Cox S, Kroelinger C, Besera G, et al. Reduced disparities in birth rates among teens aged 15–19 years—United States, 2006–2007 and 2013–2014. MMWR Morb Mortal Wkly Rep 65(16):409–14. 2016.
- Hamilton BE, Mathews TJ. Continued declines in teen births in the United States, 2015. NCHS data brief, no 259. Hyattsville, MD: National Center for Health Statistics. 2016.
- Hall MJ, Owings M. Rural and urban hospitals’ role in providing inpatient care, 2010. NCHS data brief, no 147. Hyattsville, MD: National Center for Health Statistics. 2014.
- Ingram DD, Franco SJ. NCHS urban–rural classification scheme for counties. National Center for Health Statistics. Vital Health Stat 2(154). 2012.
- National Center for Health Statistics. U.S. Census populations with bridged-race categories.
- National Cancer Institute. Joinpoint Regression Program (Version 4.0.1) [computer software]. 2013.
Suggested citation
Hamilton BE, Rossen LM, Branum AM. Teen birth rates for urban and rural areas in the United States, 2007–2015. NCHS data brief, no 264. Hyattsville, MD: National Center for Health Statistics. 2016.
Copyright information
All material appearing in this report is in the public domain and may be reproduced or copied without permission; citation as to source, however, is appreciated.
National Center for Health Statistics
Charles J. Rothwell, M.S., M.B.A., Director
Jennifer H. Madans, Ph.D., Associate Director for Science
Division of Vital Statistics
Delton Atkinson, M.P.H, M.P.H, P.M.P, Director
Hanyu Ni, Ph.D., M.P.H., Associate Director for Science