
NCHS Data Visualization Gallery
Mortality Data Dashboards
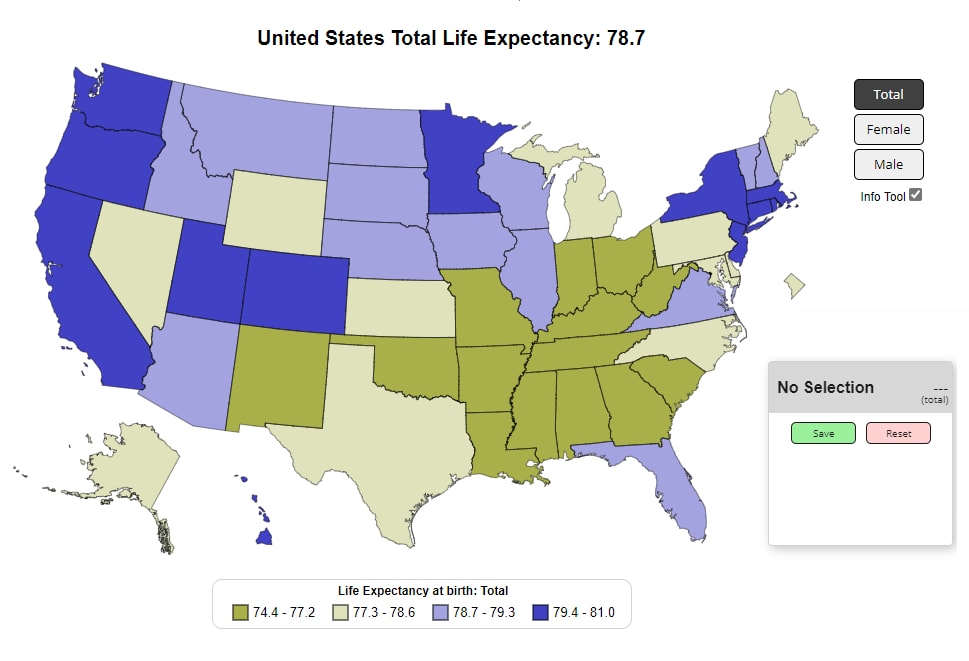
U.S. Life Expectancy at Birth by State and Sex for 2020
|
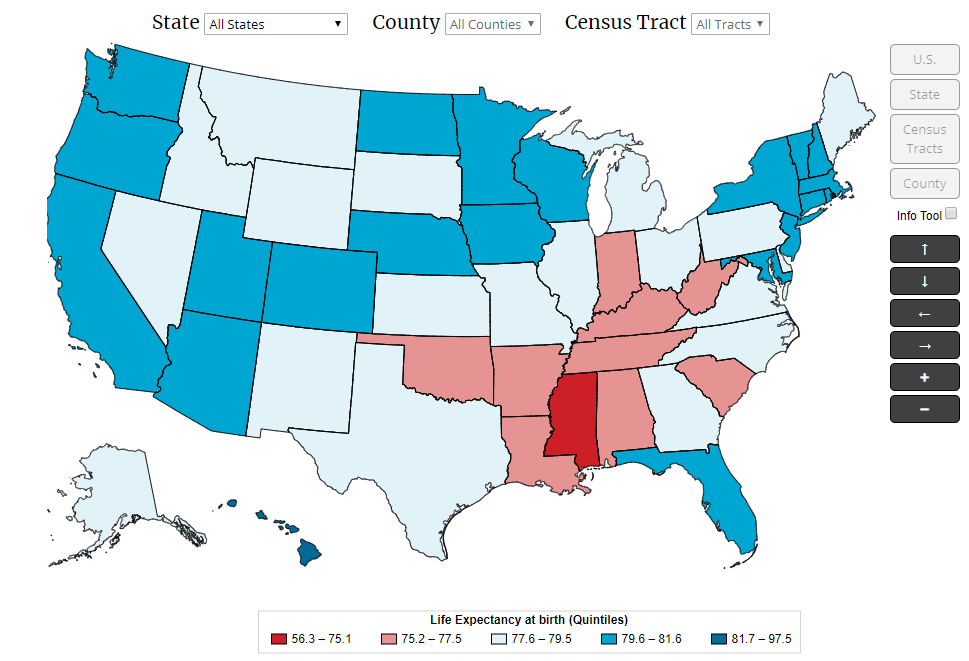
Life Expectancy at Birth for U.S. States and Census Tracts, 2010–2015
|
Drug Overdose Mortality: United States,
2003–2020 |
Potentially Excess Deaths, United States,
2010–2017 |
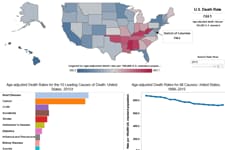
Leading Causes of Death, United States,
1999–2017 |
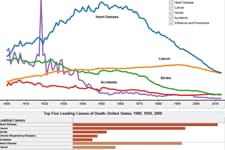
Mortality Trends, United States,
1900–2018 |
Natality Data Dashboards
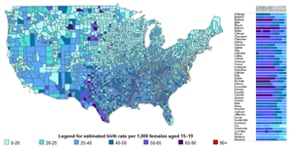
Teen Birth Rates in the United States by County, 2003–2020
|
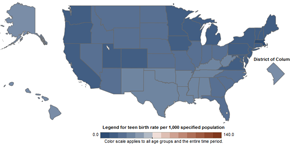
U.S. and State Trends on Teen Births,
1990–2019 |
Natality Trends,
United States, 1909–2018 |
Provisional Data Dashboards

Drug Overdose - Provisional Death Counts (Monthly)
|
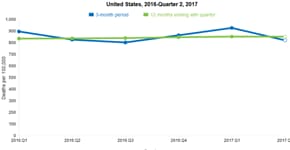
Mortality - Provisional Estimates (Quarterly)
|
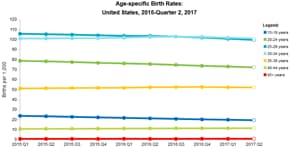
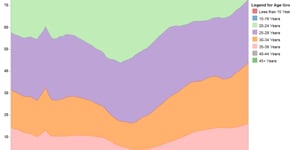
Natality - Provisional Estimates (Quarterly)
|
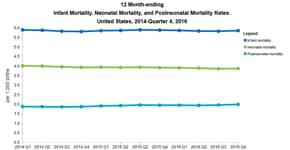
Infant Mortality - Provisional Estimates (Quarterly)
|
Page last reviewed: September 1, 2022
Content source: National Center for Health Statistics