Age Differences in Visits to Office-based Physicians by Adults With Hypertension: United States, 2013
- Key findings
- The percentage of all adult visits to office-based physicians made by adults with hypertension increased with age.
- In 2013, the frequency of office-based physician visits made by adults with hypertension increased with age.
- In 2013, hypertensive medications were provided, prescribed, or continued at 62% of office-based physician visits made by adults with hypertension, and the percentage of visits that included hypertensive medications increased with age.
- In 2013, adults with hypertension who visited office-based physicians were likely to have multiple chronic conditions, and the percentage of visits made by adults with multiple chronic conditions increased with age.
- For one-quarter of all office-based physician visits made by adults with hypertension, the primary diagnosis was a circulatory system disease, and the percentage of visits with this diagnosis increased with age in 2013.
- Summary
- Definitions
- Data source and methods
- About the authors
- References
- Suggested citation
NCHS Data Brief No. 263, November 2016
PDF Version (344 KB)
Jill J. Ashman, Ph.D., Pinyao Rui, M.P.H., and Susan M. Schappert, M.A.
Key findings
Data from the National Ambulatory Medical Care Survey
- The percentage of all adult visits to office-based physicians made by adults with hypertension increased with age, from 9% for those aged 18–44 to 58% for those aged 75 and over.
- Hypertensive medications were provided, prescribed, or continued at 62% of visits made by adults with hypertension.
- Eighty-two percent of visits by adults with hypertension were made by those with multiple chronic conditions, and the number of chronic conditions increased with age.
- Diseases of the circulatory system increased as age increased, from 23% for those aged 18–44 to 29% for those aged 75 and over.
Hypertension is a chronic condition that affects 31% of adults in the United States (1). The prevalence of hypertension increases with age, from 7% among those aged 18–39 to 65% among those aged 60 and over (2). This report describes age differences for chronic conditions mentioned, hypertensive medications prescribed, doctor visits in the past year, and selected primary diagnoses for office-based physician visits made by adults with hypertension. Adults with hypertension were defined as those aged 18 and over who have been diagnosed with hypertension, regardless of the diagnosis for the current visit. In 2013, there were 258.5 million visits made by such patients, representing 34% of all office-based physician visits by adults (3).
Keywords: National Ambulatory Medical Care Survey
The percentage of all adult visits to office-based physicians made by adults with hypertension increased with age.
- The percentage of all adult visits to office-based physicians that were made by adults with hypertension increased with age, from 9% for those aged 18–44 to 58% for those aged 75 and over (Figure 1).
- Visits by men with hypertension (37%) accounted for a higher percentage of overall visits to office-based physicians compared with visits made by women with hypertension (31%).
- The percentage of all visits made by women with hypertension increased with age, ranging from 7% for those aged 18–44 to 60% for those aged 75 and over.
- The percentage of all visits made by men with hypertension also increased with age. But unlike women, visits made by men aged 75 and over (55%) were not significantly higher than visits made by men aged 65–74 (53%).
Figure 1. Percentage of visits to office-based physicians for adults with hypertension, by age and sex: United States, 2013
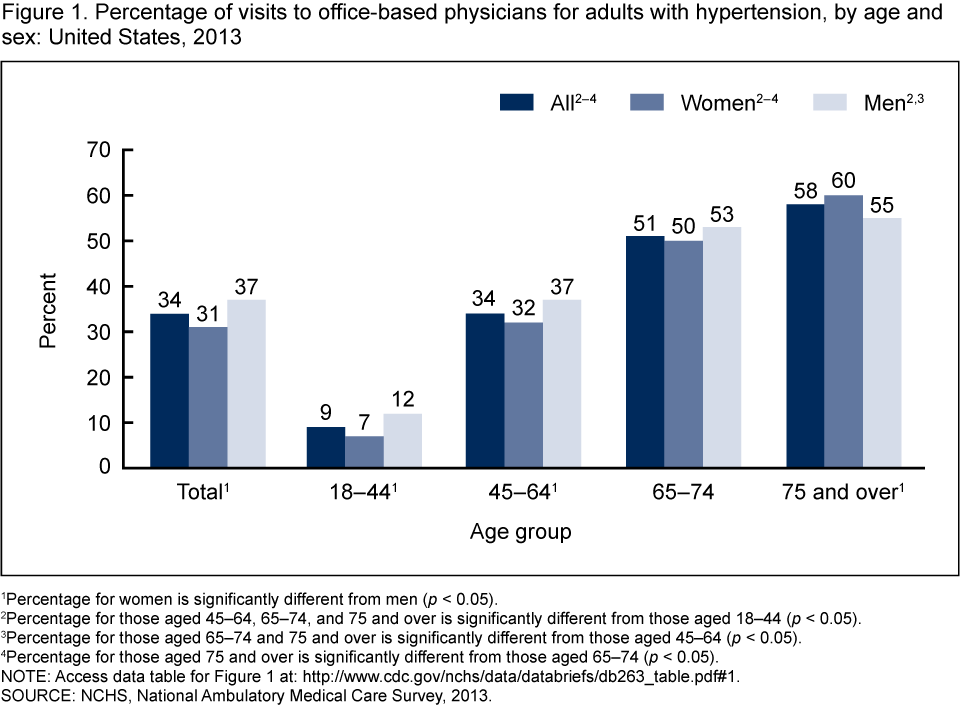
1Percentage for women is significantly different from men (p < 0.05).
2Percentage for those aged 45–64, 65–74, and 75 and over is significantly different from those aged 18–44 (p < 0.05).
3Percentage for those aged 65–74 and 75 and over is significantly different from those aged 45–64 (p < 0.05).
4Percentage for those aged 75 and over is significantly different from those aged 65–74 (p < 0.05).
NOTE: Access data table for Figure 1.
SOURCE: NCHS, National Ambulatory Medical Care Survey, 2013.
In 2013, the frequency of office-based physician visits made by adults with hypertension increased with age.
- About 80% of visits by adults with hypertension were made by those making multiple trips to a sampled doctor (Figure 2).
- The percentage of visits by adults with hypertension who made only one visit to a sampled doctor declined as age increased, from 26% for those aged 18–44 to 17% for those aged 75 and over.
- Almost one-half of all visits by adults with hypertension (47%) were made by those who had an office visit to a sampled doctor four or more times in the past 12 months. This percentage increased with age, ranging from 43% for those aged 18–44 to 53% for those aged 75 and over.
Figure 2. Percent distribution of number of office-based physician visits in the past 12 months for adults with hypertension, by age: United States, 2013
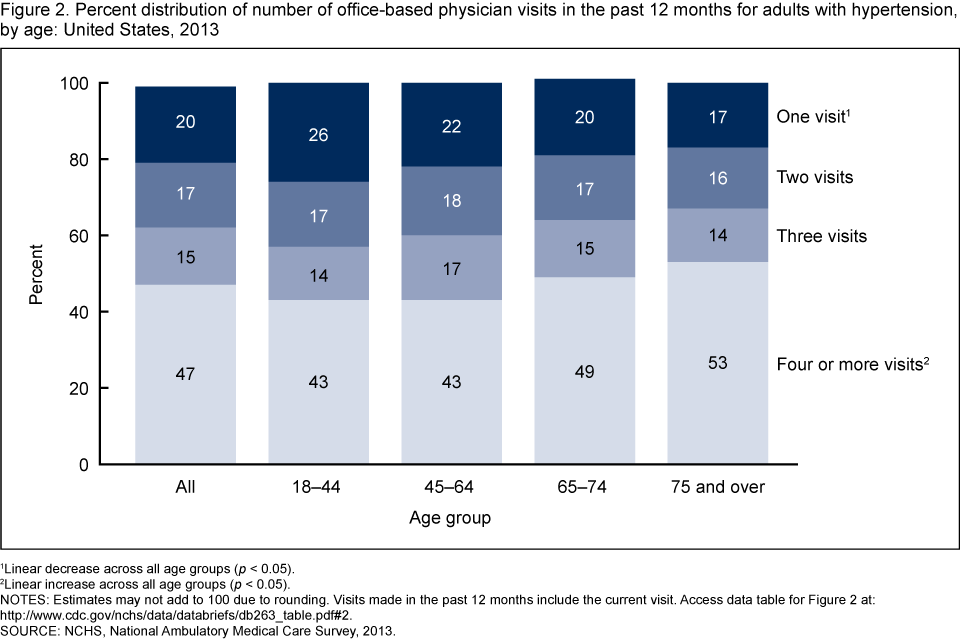
1Linear decrease across all age groups (p < 0.05).
2Linear increase across all age groups (p < 0.05).
NOTES: Estimates may not add to 100 due to rounding. Visits made in the past 12 months include the current visit. Access data table for Figure 2.
SOURCE: NCHS, National Ambulatory Medical Care Survey, 2013.
In 2013, hypertensive medications were provided, prescribed, or continued at 62% of office-based physician visits made by adults with hypertension, and the percentage of visits that included hypertensive medications increased with age.
- Hypertensive medications were provided, prescribed, or continued at 50% of all visits made by adults aged 18–44 with hypertension (Figure 3). This percentage increased with age, reaching 64% for those aged 75 and over.
- Visits by adults aged 18–44 with hypertension were more likely to have no or one hypertensive medication provided, prescribed, or continued compared with all other age groups.
- The percentage of visits made by adults with hypertension receiving three or more hypertensive medications increased with age, from 5% for those aged 18–44 to 18% for those aged 75 and over.
Figure 3. Percent distribution of number of hypertensive medications provided, prescribed, or continued at office-based physician visits for adults with hypertension, by age: United States, 2013
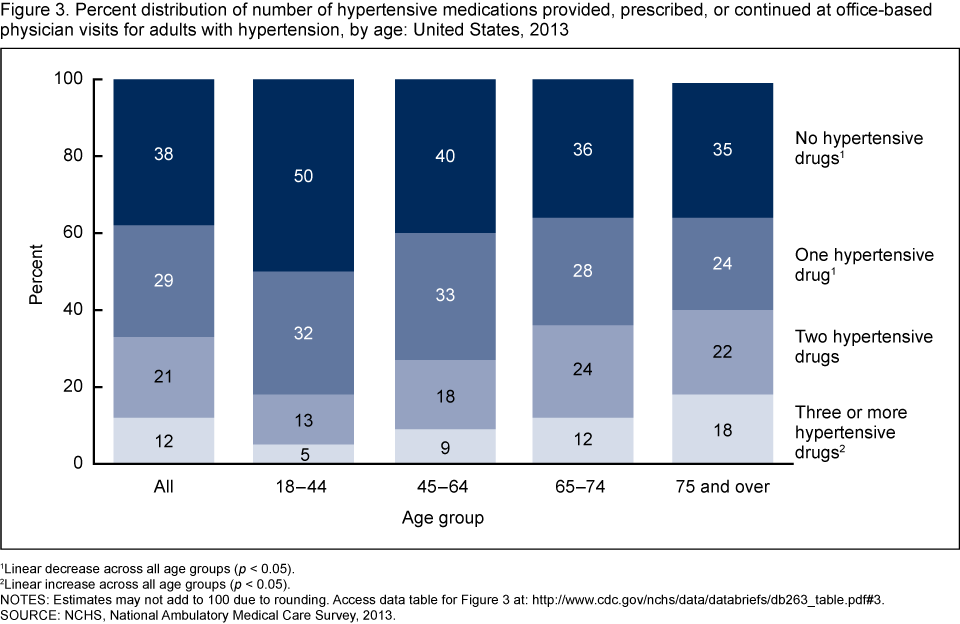
1Linear decrease across all age groups (p < 0.05).
2Linear increase across all age groups (p < 0.05).
NOTES: Estimates may not add to 100 due to rounding. Access data table for Figure 3.
SOURCE: NCHS, National Ambulatory Medical Care Survey, 2013.
In 2013, adults with hypertension who visited office-based physicians were likely to have multiple chronic conditions, and the percentage of visits made by adults with multiple chronic conditions increased with age.
- Hypertension was the only diagnosed chronic condition for 18% of all visits made by adults with hypertension (Figure 4). This percentage decreased as age increased, with hypertension being the only diagnosed chronic condition for 39% of visits made by adults aged 18–44, 19% for those aged 45–64, and 14% each for the two oldest age groups.
- Eighteen percent of visits by adults aged 18–44 with hypertension were made by adults with three chronic conditions. This number increased to 26% for adults aged 45–64, 28% for those aged 65–74, and 29% for those aged 75 and over.
- Only 10% of visits by adults aged 18–44 with hypertension were made by those with four or more chronic conditions. This number more than doubled to 23% for those aged 45–64 and almost tripled to 28% each for the two oldest age groups.
Figure 4. Percent distribution of number of diagnosed chronic conditions at office-based physician visits for adults with hypertension, by age: United States, 2013
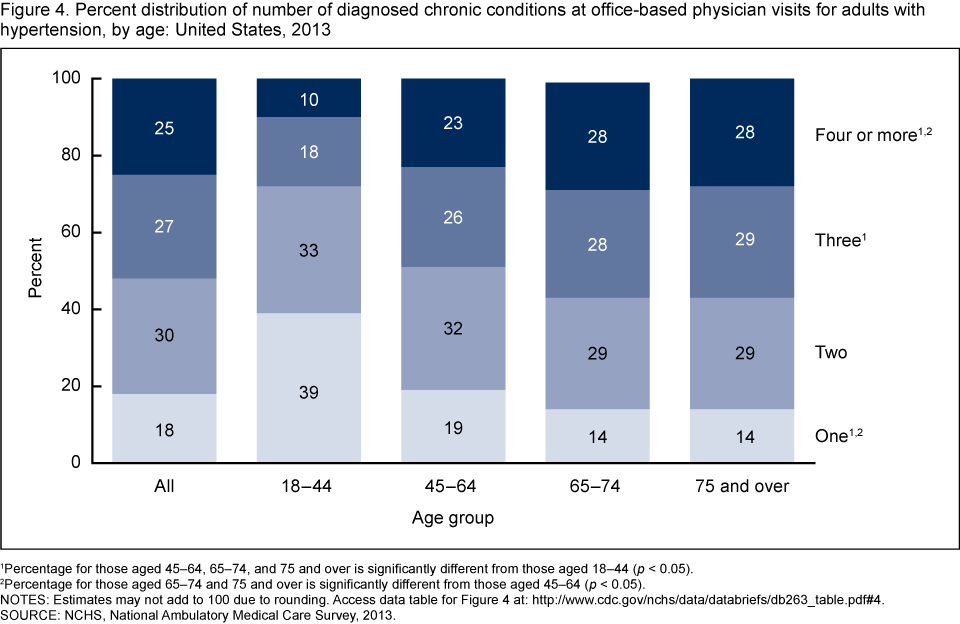
1Percentage for those aged 45–64, 65–74, and 75 and over is significantly different from those aged 18–44 (p < 0.05).
2Percentage for those aged 65–74 and 75 and over is significantly different from those aged 45–64 (p < 0.05).
NOTES: Estimates may not add to 100 due to rounding. Access data table for Figure 4.
SOURCE: NCHS, National Ambulatory Medical Care Survey, 2013.
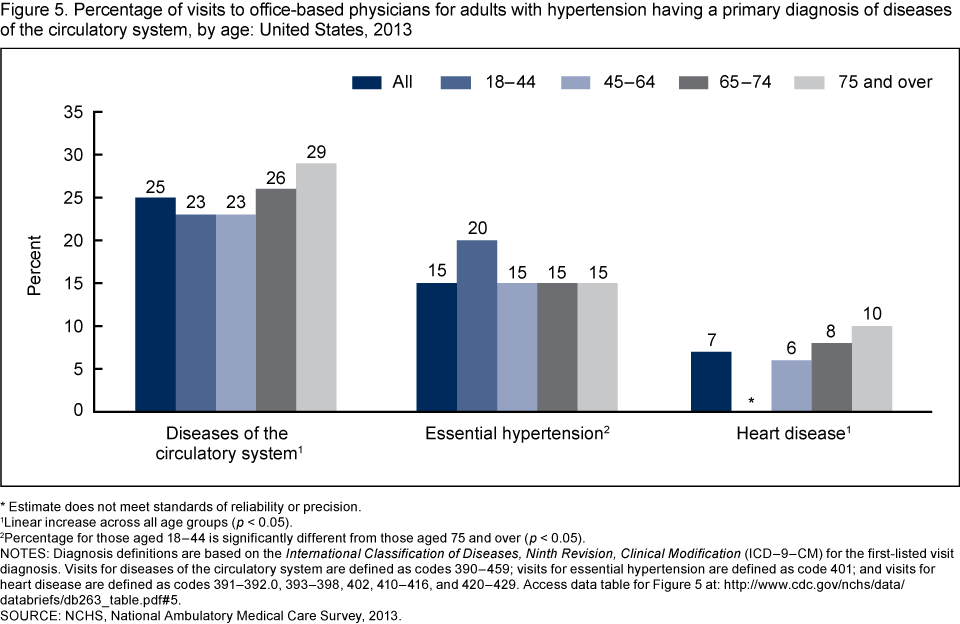
For one-quarter of all office-based physician visits made by adults with hypertension, the primary diagnosis was a circulatory system disease, and the percentage of visits with this diagnosis increased with age in 2013.
- The primary diagnosis for 23% of visits made by adults aged 18–44 with hypertension was a disease of the circulatory system. This percentage increased as age increased, reaching 29% for those aged 75 and over (Figure 5).
- Essential hypertension was the primary diagnosis for 20% of visits made by adults aged 18–44 with hypertension. This percentage dropped to 15% for all other age groups.
- Heart disease was the primary diagnosis for 7% of all visits made by adults with hypertension. This percentage increased with age, ranging from 6% for those aged 45–64 to 10% for those aged 75 and over.
Figure 5. Percentage of visits to office-based physicians for adults with hypertension having a primary diagnosis of diseases of the circulatory system, by age: United States, 2013
* Estimate does not meet standards of reliability or precision.
1Linear increase across all age groups (p < 0.05).
2Percentage for those aged 18–44 is significantly different from those aged 75 and over (p < 0.05).
NOTES: Diagnosis definitions are based on the International Classification of Diseases, Ninth Revision, Clinical Modification (ICD–9–CM) for the first-listed visit diagnosis. Visits for diseases of the circulatory system are defined as codes 390–459; visits for essential hypertension are defined as code 401; and visits for heart disease are defined as codes 391–392.0, 393–398, 402, 410–416, and 420–429. Access data table for Figure 5.
SOURCE: NCHS, National Ambulatory Medical Care Survey, 2013.
Summary
Hypertension is not the only health concern for the majority of adults with this condition. In 2013, 82% of visits to office-based physicians by adults with hypertension were made by those who had additional chronic conditions. Visits by older adults were more likely to be made by those with multiple chronic conditions compared with visits by younger adults. Regardless of age, adults with hypertension used extensive health resources, which was evidenced by their frequent visits to physicians (47% having visited the same doctor four or more times in the past year) and extensive use of hypertensive medications. A total of 62% of all such visits included the provision, prescription, or continuation of one or more hypertensive medications. Visits by older adults were more likely than visits by younger adults to include three or more hypertensive drugs. Diseases of the circulatory system, including essential hypertension and heart disease, were listed as the primary diagnosis at 25% of all visits made by adults with hypertension, thus providing further evidence of the complex health care needs of this population.
Definitions
Diagnosed hypertension and other chronic conditions: Since 2005, the National Ambulatory Medical Care Survey (NAMCS) has asked, “Regardless of the diagnosis for the current visit, does the patient now have (mark all that apply): hypertension, arthritis, asthma, cancer, cerebrovascular disease, chronic obstructive pulmonary disease, chronic renal failure, congestive heart failure, depression, diabetes, hyperlipidemia, ischemic heart disease, obesity, and osteoporosis.” Diagnosis codes for the visit were not used to define hypertension. Instead, this report includes all visits by adults whose medical record included a diagnosis of hypertension. Managing hypertension is the reason for some of these visits, but many other reasons, such as a respiratory infection or an injury, are also included.
Diseases of the circulatory system: Based on the following International Classification of Diseases, Ninth Revision, Clinical Modification (ICD–9–CM) (4) codes: 390–459.
- Essential hypertension: Based on the ICD–9–CM (4) code: 401.
- Heart disease: Based on the following ICD–9–CM (4) codes: 391–392.0, 393–398, 402, 410–416, and 420–429.
Hypertensive medications: A comprehensive list of 102 hypertensive medications was compiled by a pharmacist at the National Center for Health Statistics (NCHS). Any hypertensive medication included on the patient record as having been provided, prescribed, or continued at a visit was included. Up to 10 drug mentions were collected per visit in 2013. For a complete list of the 102 medications, please contact the Ambulatory and Hospital Care Statistics Branch at (301) 458–4600.
Visits in the past 12 months: All visits to the sampled doctor over the past 12 months are counted, including the sampled visit. New adult patients (13% of visits made by patients with hypertension) are included in the one-visit category.
Data source and methods
All estimates are from the 2013 NAMCS, a nationally representative survey of visits to non-federal, office-based physicians. The survey is conducted annually by NCHS, Division of Health Care Statistics. NAMCS uses a stratified two-stage sample, with physicians selected in the first stage and visits in the second stage. The survey data are inflated or weighted to produce national annual estimates of office visits. The unweighted visit response rate for the 2013 survey was 41.1% (40.4% weighted) (5).
Percentage estimates in Figure 1 are based on a sample of 44,739 office-based physician visits made by adults aged 18 and over, representing a weighted total of 771.6 million visits. Percentage estimates in Figures 2–5 are based on a sample of 14,146 office-based physician visits made by adults aged 18 and over with diagnosed hypertension, representing a weighted total of 258.5 million visits (34% of all visits).
Differences among subgroups were evaluated using two-tailed t tests (p < 0.05). The Joinpoint Program (6) was used to test for linear trends. Data analyses were performed using the statistical packages SAS version 9.4 (SAS Institute, Cary, N.C.) and SUDAAN version 9.0 (RTI International, Research Triangle Park, N.C.).
About the authors
Jill J. Ashman and Susan M. Schappert are with the National Center for Health Statistics, Division of Health Care Statistics. Pinyao Rui is with Global Evaluation & Applied Research Solutions (GEARS), Inc.
References
- National Center for Health Statistics. Health, United States, 2015: With special feature on racial and ethnic health disparities. Table 53. Hyattsville, MD. 2016.
- Yoon SS, Fryar CD, Carroll MD. Hypertension prevalence and control among adults: United States, 2011–2014. NCHS data brief, no 220. Hyattsville, MD: National Center for Health Statistics. 2015.
- Hing E, Rui P, Palso K. National Ambulatory Medical Care Survey: 2013 state and national summary tables.
- U.S. Department of Health and Human Services, Centers for Disease Control and Prevention, Centers for Medicare and Medicaid Services. Official version: International Classification of Diseases, Ninth Revision, Clinical Modification, Sixth Edition. DHHS Pub No.(PHS) 06–1260).
- National Center for Health Statistics. 2013 NAMCS microdata file documentation. Hyattsville, MD. 2016.
- National Cancer Institute. Joinpoint Regression Program (Version 4.3.1.0) [computer software]. 2016.
Suggested citation
Ashman JJ, Rui P, Schappert SM. Age differences in visits to office-based physicians by adults with hypertension: United States, 2013. NCHS data brief, no 263. Hyattsville, MD: National Center for Health Statistics. 2016.
Copyright information
All material appearing in this report is in the public domain and may be reproduced or copied without permission; citation as to source, however, is appreciated.
National Center for Health Statistics
Charles J. Rothwell, M.S., M.B.A., Director
Jennifer H. Madans, Ph.D., Associate Director for Science
Division of Health Care Statistics
Denys T. Lau, Ph.D., Acting Director
Alexander Strashny, Ph.D., Associate Director for Science