Radiation is energy that comes from a source and travels through space at the speed of light.
Radiation safety
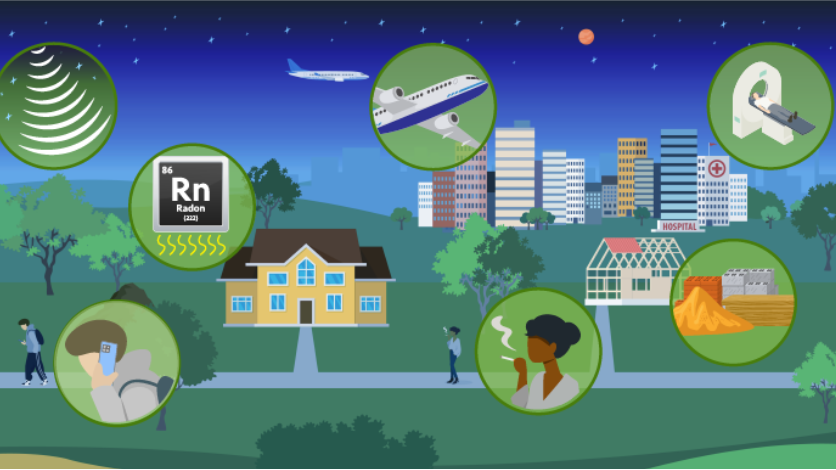
Information about natural and manmade radiation sources in daily life.
Learn about strategies that can help you stay safe from radiation.
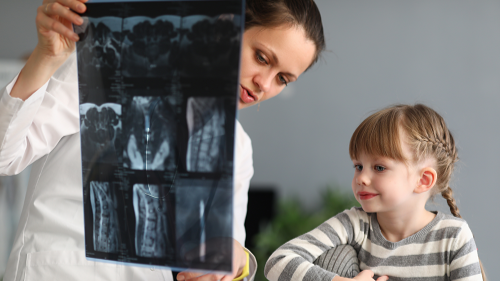
Learn about ionizing radiation and its medical applications such as diagnostic testing.
Read about sources of non-ionizing radiation.
Learn about the potential health effects of radiation exposure.
Learn how to how to self-decontaminate after being exposed to radioactive material.
Radiation in your life
Discuss your options with your healthcare provider and take steps to limit radiation exposure.
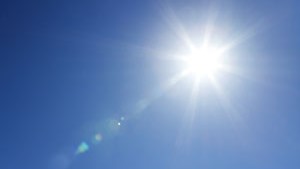
Ultraviolet (UV) radiation is non-ionizing and is emitted by both natural and artificial sources.
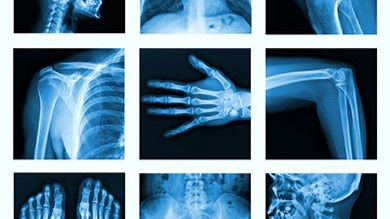
X-rays allow healthcare providers and dentists to see if there are problems with minimal radiation.
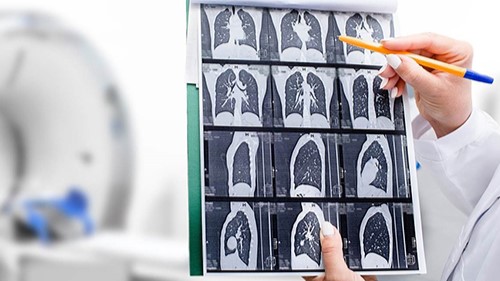
CT scans require more exposure than x-rays, but allow your provider to see more detailed images.

Radioactive materials are all around us and can be naturally found in the earth.

The amount of radiation people get from air travel is low.