Persons using assistive technology might not be able to fully access information in this file. For assistance, please send e-mail to: mmwrq@cdc.gov. Type 508 Accommodation and the title of the report in the subject line of e-mail.
Binge Drinking — United States, 2011
Corresponding author: Dafna Kanny, Division of Population Health, National Center for Chronic Disease Prevention and Health Promotion, CDC. Telephone: 770-488-5411; E-mail: dkk3@cdc.gov.
Introduction
During 2001–2005, excessive alcohol use accounted for an estimated average of 80,000 deaths and 2.3 million years of potential life lost (YPLL) in the United States each year, and an estimated $223.5 billion in economic costs in 2006 (1). Binge drinking, defined as consuming four or more alcoholic drinks on one or more occasions for women and five or more drinks on one or more occasions for men, was responsible for more than half of these deaths, two-thirds of the YPLL (2), and three quarters of the economic costs (1). Reducing the prevalence of binge drinking among adults is also a leading health indicator in Healthy People 2020 (objective SA-14.3) (3).
The binge drinking prevalence, frequency, and intensity analysis, and discussion that follows is part of the second CDC Health Disparities and Inequalities Report (CHDIR) (4). The 2011 CHDIR (5) was the first CDC report to assess disparities across a wide range of diseases, behavioral risk factors, environmental exposures, social determinants, and health-care access. The topic presented in this report is described in the criteria for the 2013 CHDIR Introduction (6). This report provides more current information on binge drinking measures, and updates information on the status of evidence-based strategies recommended to prevent binge drinking presented in the 2011 CHDIR. The purposes of this report are to discuss and raise awareness of differences in the characteristics of people who binge drink, and to prompt actions to reduce these disparities.
Methods
To examine sociodemographic disparities in binge drinking nationwide and by state, CDC analyzed 2011 data from the Behavioral Risk Factor Surveillance System (BRFSS). BRFSS is a state-based, random-digit–dialed landline and cellular telephone survey of the noninstitutionalized civilian U.S. adults that is conducted monthly in all states, the District of Columbia (DC), and three U.S. territories. BRFSS collects data on leading health conditions and health risk behaviors, including binge drinking. For this report, responses to questions regarding the prevalence, frequency, and largest number of drinks consumed by binge drinkers (a measure of the intensity of binge drinking) were analyzed, beginning with the question, "Considering all types of alcoholic beverages, how many times during the past 30 days did you have X [X = 5 for men; X = 4 for women] or more drinks on an occasion?" Respondents then were asked, "During the past 30 days, what is the largest number of drinks you had on any occasion?" Responses to this question were assessed for binge drinkers only. A more detailed description of BRFSS methods has been published (4,7). In 2011, the median survey response rate* was 49.7%, ranging from 33.8% to 64.1%. After excluding 48,912 persons who reported 'don't know/not sure' or 'refused,' those with missing information, and respondents from the U.S. territories, data from 457,555 respondents in the 50 states and DC were used for analysis.
This report describes binge drinking prevalence, frequency (i.e., the average number of binge drinking episodes), and intensity (i.e., the average largest number of drinks consumed by binge drinkers). Sociodemographic characteristics analyzed included sex, age group, race/ethnicity, education level, income level, and disability status. Race was defined as white, black, Asian/Pacific Islander, and American Indian/Alaska Native. Ethnicity was defined as Hispanic or non-Hispanic. Annual household income was defined as follows: <$25,000, $25,000–$49,999, $50,000–$74,999, and ≥$75,000. Educational attainment was defined as follows: less than high school, high school or equivalent, some college, and college graduate. Disability status was defined as respondents reporting limited activities in any way because of physical, mental, or emotional problems.
Binge drinking prevalence was calculated by dividing the total number of respondents who reported at least one binge drinking episode during the preceding 30 days by the total number of BRFSS respondents in all 50 states and DC. Frequency of binge drinking (i.e., the number of binge drinking episodes) was calculated by averaging the number of episodes reported by all binge drinkers during the preceding 30 days. Intensity of binge drinking was calculated by averaging the largest number of drinks consumed by binge drinkers during the past 30 days. BRFSS data were weighted to adjust for several demographic variables (e.g., educational attainment, marital status, home ownership, and telephone source) (7). Data were age- and sex-adjusted to the 2000 U.S. Census standard population to provide estimates for race/ethnicity, educational attainment, annual household income level, and disability status. We calculated 95% confidence intervals for binge drinking prevalence. Two-tailed t-tests were used to determine differences between subgroups.
Results
In 2011, the overall prevalence of binge drinking among adults in the 50 states and DC was 18.4% (Table). On average, binge drinkers reported a frequency of 4.1 binge drinking episodes during the preceding 30 days and an intensity of 7.7 drinks per occasion during the past 30 days. Binge drinking prevalence was significantly higher among persons aged 18–24 years (30.0%) and 25–34 years (29.7%) than among those in older age groups. Similarly, the intensity of binge drinking was highest among binge drinkers aged 18–24 and 25–34 (8.9 and 8.2 drinks, respectively); however, the frequency of binge drinking was highest among binge drinkers aged ≥65 years (4.9 episodes). The prevalence of binge drinking was also significantly higher among non-Hispanic whites (21.1%) than among all other race/ethnicity categories, but the intensity of binge drinking was highest among American Indians/Alaska Natives (8.4 drinks). Those with household incomes ≥$75,000 had significantly higher binge drinking prevalence (22.2%) than those with lower household incomes. In contrast, binge drinkers with household incomes <$25,000 reported the highest frequency (4.3 episodes) and intensity (7.1 drinks) of binge drinking.
Respondents who did not graduate from high school reported significantly lower binge drinking prevalence (16.8%) than those with high school or higher education. However, binge drinkers with less than high school education had the highest frequency (4.7 episodes) and intensity (7.4 drinks) of binge drinking. Respondents with disabilities also had a significantly lower prevalence of binge drinking (16.9%), but those who binge drank had a higher frequency (4.5 episodes) and intensity (7.2 drinks) of binge drinking, compared with those without disabilities.
Overall, areas with the highest age- and sex-adjusted prevalence of binge drinking were states in the Midwest, as well as DC and Hawaii (Figure 1). States with the highest intensity of binge drinking were generally located in the Midwest, and included some states (e.g. Oklahoma, Arkansas, Kentucky, West Virginia, and Utah) that had a lower prevalence of binge drinking (Figure 2).
Discussion
Binge drinking is a risk factor for many adverse health and social outcomes, including unintentional injuries (e.g., motor vehicle crashes); violence; suicide; hypertension; acute myocardial infarction; sexually transmitted diseases; unintended pregnancy; fetal alcohol syndrome; and sudden infant death syndrome (8). This report indicates that in 2011 binge drinking was common among U.S. adults, and persons who binge drank tended to do so frequently (average of four times per month) and with high intensity (average of eight drinks on occasion), placing themselves and others at a significantly greater risk for alcohol-attributable harms (8). In a number of states with a lower prevalence of binge drinking, those who binge drank did so with high intensity.
The groups at highest risk for binge drinking (i.e., persons aged 18–34 years, males, whites, non-Hispanics, and persons with higher household incomes), and those who reported the highest binge drinking frequency (i.e., binge drinkers aged ≥65 years) and intensity (i.e., persons aged 18–24 years) are consistent with previous reports (4,9), and might reflect differences in state and local laws on the marketing of alcoholic beverages (e.g., price and availability) (10), as well as other cultural and religious factors (11). These differences are reflected in state measures of the prevalence and intensity of binge drinking, and highlight that states with a lower prevalence of binge drinking might still include subgroups that binge drink with high intensity. Furthermore, unlike other leading health risks (e.g., smoking and obesity) binge drinking has not been widely recognized as a health risk or subjected to intense prevention efforts (12).
Limitations
The findings in this analysis are subject to at least three limitations. First, BRFSS data are self-reported; alcohol consumption, generally, and excessive drinking, in particular, is underreported in surveys because of recall bias, social desirability response bias, and nonresponse bias (13). A recent study reported that BRFSS identifies 22%–32% of presumed alcohol consumption in states when compared with alcohol sales data (14). However, a strong correlation existed between BRFSS estimates of alcohol consumption and per capita alcohol sales in states, suggesting that BRFSS data are still a useful measure of alcohol consumption even after taking into account known underreporting (14). Second, response rates for BRFSS were low, which can increase response bias. Third, BRFSS does not collect information from persons living in institutional settings (e.g., on college campuses), so findings might not be representative of those populations.
Conclusion
Binge drinking is common among U.S. adults, and persons who binge drink tend to do so frequently and with high intensity. The Community Preventive Services Task Force has recommended several population-level, evidence-based strategies to reduce binge drinking and related harms (15). These include 1) limiting alcohol outlet density (http://www.thecommunityguide.org/alcohol/outletdensity.html) (i.e., the concentration of retail alcohol establishments, including bars and restaurants and liquor or package stores, in a given geographic area), 2) holding alcohol retailers liable for harms related to the sale of alcoholic beverages to minors and intoxicated patrons (dram shop liability), 3) measures increasing the price of alcohol, 4) maintaining existing limits on the days and hours when alcohol is sold, 5) avoiding further privatization of alcohol sales in states with government-operated or contracted liquor stores, and 6) electronic screening and brief interventions (eSBI), including interventions delivered using computers, telephones, or mobile devices in the clinical setting. Despite the array of strategies that have been recommended, efforts are needed to implement them to a point of measurable success toward reducing binge drinking. The frequency and intensity of binge drinking also should be monitored routinely to support the implementation and evaluation of Community Guide recommendations for reducing binge drinking and to monitor changes in this behavior among groups at greater risk.
References
- Bouchery EE, Harwood HJ, Sacks JJ, Simon CJ, Brewer RD. Economic costs of excessive alcohol consumption in the United States, 2006. Am J Prev Med 2011;41:516–24.
- CDC. Alcohol attributable deaths and years of potential life lost—United States, 2001. MMWR 2004;53:866–70.
- US Department of Health and Human Services. SA–14.3 Reduce the proportion of persons engaging in binge drinking during the past 30 days—adults aged 18 years and older. Healthy People 2020. Washington, DC: US Department of Health and Human Services; 2011. Available at http://healthypeople.gov/2020/lhi/substanceabuse.aspx.
- CDC. Binge drinking—United States, 2009. MMWR 2011;60(Suppl; January 14, 2011).
- CDC. CDC health disparities and inequalities report—United States, 2011. MMWR 2011; 60(Suppl; January 14, 2011).
- CDC. Introduction: CDC health disparities and inequalities report—United States, 2013. MMWR 2013; 62(Suppl; No. 3).
- CDC. Methodologic changes in the behavioral risk factor surveillance system in 2011 and potential effects on prevalence estimates. MMWR 2012;61;410–3.
- National Institute of Alcohol Abuse and Alcoholism. Tenth special report to the US Congress on alcohol and health. Bethesda, MD: National Institutes of Health; 2000.
- CDC. Vital signs: binge drinking prevalence, frequency, and intensity among adults—United States, 2010. MMWR 2012;61:14–9.
- National Institute on Alcohol Abuse and Alcoholism. Alcohol policy information system. Rockville, MD: US Department of Health and Human Services, National Institutes of Health. Available at http://www.alcoholpolicy.niaaa.nih.gov.
- Holt JB, Miller JW, Naimi TS, Sui DZ. Religious affiliation and alcohol consumption in the United States. Geog Rev 2006;96:523–42.
- Brewer RD, Swan MH. Binge drinking and violence. JAMA 2005;294:616–8.
- Stockwell T, Donath S, Cooper-Stanbury M, et al. Under-reporting of alcohol consumption in household surveys: a comparison of quantity-frequency, graduated-frequency and recent recall. Addiction 2004;99:1024–33.
- Nelson DE, Naimi TS, Brewer RD, Roeber J. US state alcohol sales compared to survey data, 1993–2006. Addiction 2010;105:1589–96.
- Task Force on Community Preventive Services. Preventing excessive alcohol use. Atlanta, GA: Task Force on Community Preventive Services; Available at http://www.thecommunityguide.org/alcohol/index.html.
* Response rates for BRFSS are calculated using standards set by the American Association of Public Opinion Research (AAPOR) response rate formula no. 4, available at http://www.aapor.org/standard_definitions2.htm. The response rate is the number of respondents who completed the survey as a proportion of all eligible and likely eligible persons. Additional information is available at http://cdc.gov/brfss/pdf/2011_Summary_Data_Quality_Report.pdf.
FIGURE 1. Prevalence* of binge drinking† — Behavioral Risk Factor Surveillance System, United States,§ 2011
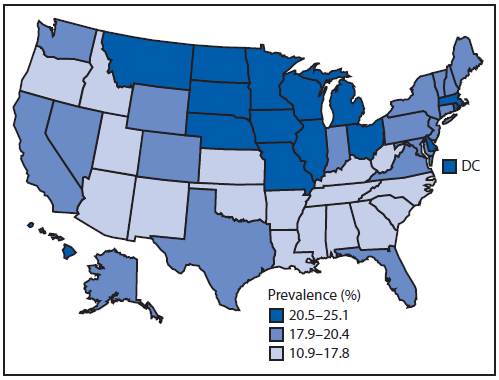
* Total number of respondents who reported at least one binge drinking episode during the preceding 30 days divided by the total number of respondents.
† Consuming ≥4 alcoholic drinks on ≥1 occasion for women and ≥5 drinks on ≥1 occasion for men.
§ States are divided into tertiles.
Alternate Text: This figure is a map of the United States that presents the prevalence (the total number of respondents who reported at least one binge episode during the preceding 30 days divided by the total number of respondents), by state, during 2011, as reported by the Behavior Risk Factor Surveillance System (BRFSS).
FIGURE 2. Intensity* of binge drinking† — Behavioral Risk Factor Surveillance System, United States,§ 2011
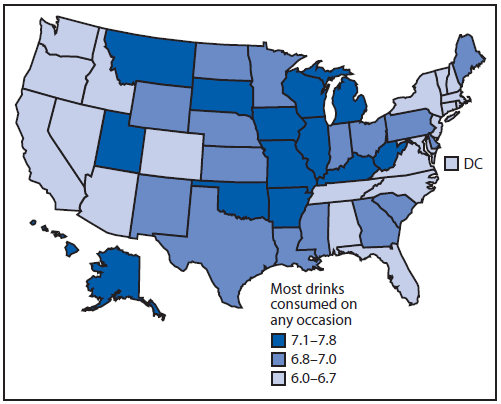
* Average largest number of drinks consumed by binge drinkers on any occasion during the past 30 days.
† Consuming ≥4 alcoholic drinks on ≥1 occasion for women and ≥5 drinks on ≥1 occasion for men.
§ States are divided into tertiles.
Alternate Text: This figure is a map of the United States that presents the intensity (the average largest number of drinks consumed by binge drinkers on any occasion during the past 30 days), by state, during 2011, as reported by the Behavioral Risk Factor Surveillance System (BRFSS).
Use of trade names and commercial sources is for identification only and does not imply endorsement by the U.S. Department of
Health and Human Services.
References to non-CDC sites on the Internet are
provided as a service to MMWR readers and do not constitute or imply
endorsement of these organizations or their programs by CDC or the U.S.
Department of Health and Human Services. CDC is not responsible for the content
of pages found at these sites. URL addresses listed in MMWR were current as of
the date of publication.
All MMWR HTML versions of articles are electronic conversions from typeset documents.
This conversion might result in character translation or format errors in the HTML version.
Users are referred to the electronic PDF version (http://www.cdc.gov/mmwr)
and/or the original MMWR paper copy for printable versions of official text, figures, and tables.
An original paper copy of this issue can be obtained from the Superintendent of Documents, U.S.
Government Printing Office (GPO), Washington, DC 20402-9371;
telephone: (202) 512-1800. Contact GPO for current prices.
**Questions or messages regarding errors in formatting should be addressed to
mmwrq@cdc.gov.
