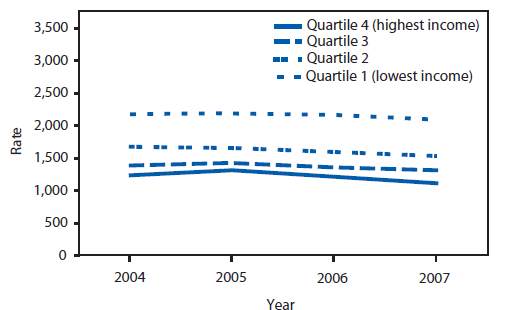
FIGURE 1. Preventable hospitalization rates* among adults, by area income --- Agency for Healthcare Research and Quality, Prevention Quality Indicators, United States, 2004--2007
Persons using assistive technology might not be able to fully access information in this file. For assistance, please send e-mail to: mmwrq@cdc.gov. Type 508 Accommodation and the title of the report in the subject line of e-mail.
Potentially Preventable Hospitalizations --- United States, 2004--2007
When patients seek prompt attention from primary care providers for acute illnesses (e.g., pneumonia) or worsening of chronic conditions (e.g., diabetes), hospitalization often can be avoided. Hospitalizations that better primary care could have prevented are termed "potentially preventable hospitalizations." Although not all such hospitalizations can be avoided, rates of potentially preventable hospitalizations vary; communities with poorer access to coordinated primary care tend to have higher rates of potentially preventable hospitalizations (1).
Because hospitalizations tend to be more costly than outpatient primary care, potentially preventable hospitalizations also are used often as markers of the efficiency of the health-care system. The number and cost of excess potentially preventable hospitalizations can be calculated by comparing rates for a group with an ideal rate. These estimates can help communities identify potential cost savings associated with improving primary care and reducing potentially preventable hospitalizations.
To identify trends in a composite measure of potentially preventable hospitalizations among persons in the United States aged ≥18 years, the Agency for Healthcare Research and Quality (AHRQ) analyzed data for 2004--2007 from AHRQ's Healthcare Cost and Utilization Project (HCUP). Disparities related to race/ethnicity and income were examined. In addition, the impact of reducing preventable hospitalizations to a best rate was estimated in terms of numbers of admissions and associated costs.
HCUP is a family of health-care databases and related software tools and products developed through a federal-state-industry partnership and sponsored by AHRQ. HCUP databases combine the data-collection efforts of state data organizations, hospital associations, private data organizations, and the federal government to create a national information resource of discharge-level health-care data. HCUP includes the largest collection of longitudinal hospital care data in the United States with all-payer, encounter-level information, beginning with 1988. These databases enable research on different health policy topics, including cost and quality of health-care services, medical practice patterns, access to health-care programs, and outcomes of treatments at the national, state, and local levels. AHRQ's Prevention Quality Indicators (PQIs) are a set of measures that can be used with hospital inpatient discharge data to identify quality of care for ambulatory care-sensitive conditions (2). This analysis used version 3.1 of AHRQ's PQIs. The PQI composite includes adult admissions for diabetes (i.e., short-term complications, long-term complications, uncontrolled diabetes, and lower-extremity amputations), hypertension, congestive heart failure, angina without procedure, asthma, dehydration, bacterial pneumonia, and urinary infections. Admissions for chronic obstructive pulmonary disease were excluded because of International Classification of Diseases (Ninth Revision, Clinical Modification) coding changes that cause incompatibility across data years. Rates were adjusted by age group and sex, with the total U.S. population for 2000 used as the standard population.
Information regarding the socioeconomic status of patients typically is unavailable in hospital administrative data; therefore, a commonly used proxy is area income, which is based on the income of the neighborhood in which a patient lives. A patient's address is matched with that area's income derived from the 2000 U.S. Census. In this analysis, patients are divided into income quartiles on the basis of the median household income of the zip code of the patient's residence (3). Quartile cut-points were assigned on the basis of the population distribution in the United States. Quartile 1 refers to the lowest income communities, and quartile 4 refers to the wealthiest communities. Analyses by area income use the HCUP Nationwide Inpatient Sample. This database approximates a 20% stratified sample of U.S. community hospitals.
HCUP databases maintain a combined categorization of race and ethnicity. When a state and its hospitals collect data on Hispanic ethnicity separately from race, HCUP assigns the data to the combined race/ethnicity categorization and uses Hispanic ethnicity to override any other race category. Not all state hospital administrative data include information regarding race/ethnicity. To generate estimates by race/ethnicity for the national health-care quality and disparities reports, special State Inpatient Databases (SID) disparities analytic files were created (3). These files are designed to provide national estimates of disparities by using weighted records from a stratified sample of hospitals in multiple SIDs. For 2004, SIDs from 23 states (Arizona, Arkansas, California, Colorado, Connecticut, Florida, Georgia, Hawaii, Kansas, Maryland, Massachusetts, Michigan, Missouri, New Hampshire, New Jersey, New York, Rhode Island, South Carolina, Tennessee, Texas, Vermont, Virginia, and Wisconsin) were used. In 2005, the Oklahoma SID was added to the sampling frame, and a SID from Virginia was unavailable. In 2006, Utah and Virginia SID were added to the frame. In 2007, the Wyoming SID was added, for a total of 26 states in the sampling frame. Estimates are generated for non-Hispanic whites, non-Hispanic blacks, Asians/Pacific Islanders (A/PIs), and Hispanics. Estimates for American Indians/Alaskan Natives (AI/ANs) cannot be reported because of inconsistently available information on these discharges in the HCUP databases.
Numbers of excess preventable hospitalizations were estimated for 2007 by comparing adjusted rates of the AHRQ PQI composite between groups. For area income comparisons, each group was compared with residents of the highest income quartile neighborhood, which had the lowest hospitalization rate. For example, for excess preventable hospitalizations to be calculated for the lowest income quartile, the difference between the lowest and highest income quartiles was multiplied by the number of persons in the lowest income quartile.
For race/ethnicity comparisons, each group was compared with non-Hispanic whites. Although A/PIs have lower hospitalization rates, because the population is limited and estimates have larger standard errors, they were not selected as the comparison group. Differences between two groups were considered statistically significant when p≤0.05 on a two-tailed z-test, and all differences reported here meet this criterion for statistical significance. Similarly, changes over time were considered statistically significant if the difference between the first and last years met this criterion.
Costs associated with excess preventable hospitalizations were estimated by multiplying numbers of excess hospitalizations for a group by the average cost per case for that group. Total hospital charges were converted to costs by using HCUP's cost-to-charge ratios, which are based on hospital accounting reports from the Centers for Medicare and Medicaid Services. Costs are for the hospital cost of producing the services and do not include physician costs associated with the hospital stay.
During 2004--2007, the AHRQ PQI composite rate of hospitalizations declined from 1,617 to 1,510 per 100,000 adults (Figure 1), perhaps reflecting greater attention to care coordination by hospitals and primary care providers. Adjusted rates of preventable hospitalizations did not change for any area income quartile. During this period, the rate of preventable hospitalizations was higher among residents of the two lower-income quartile neighborhoods (quartiles 1 and 2), compared with residents of the highest income quartile neighborhood (quartile 4).
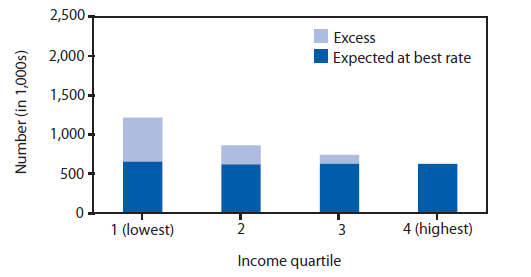
Comparisons with the AHRQ PQI composite rate of hospitalizations for residents of the highest income quartile neighborhoods in 2007 were made to estimate excess preventable hospitalizations by area income (Figure 2). If residents of the lowest income quartile neighborhoods had had the same adjusted rate of preventable hospitalizations as residents of the highest income quartile neighborhoods, they would have had >560,000 fewer hospitalizations. Instead of costing $8.8 billion during 2007, preventable hospitalizations among income quartile 1 residents would have cost only $4.8 billion, saving $4.0 billion. If residents of income quartile 2 neighborhoods had had the same adjusted rate of preventable hospitalizations as residents of the highest income quartile neighborhoods, they would have had >240,000 fewer hospitalizations. Instead of costing $6.3 billion during 2007, preventable hospitalizations among income quartile 2 residents would have cost $4.5 billion, saving $1.8 billion. If residents of income quartile 3 neighborhoods had had the same adjusted rate of preventable hospitalizations as residents of the highest-income quartile neighborhoods, they would have had >110,000 fewer hospitalizations. Instead of costing $5.7 billion during 2007, preventable hospitalizations among income quartile 3 residents would have cost $4.8 billion, saving $900 million.
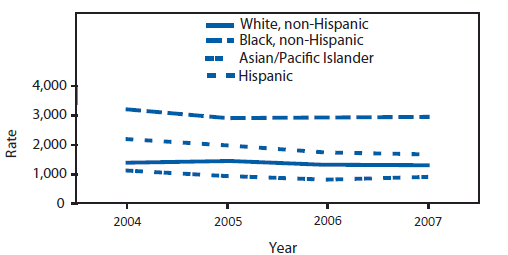
During 2004--2007, statistically significant declines in the AHRQ PQI composite rate of hospitalizations were observed among non-Hispanic whites, A/PIs, and Hispanics (Figure 3). During all years, the adjusted rate of preventable hospitalizations was higher among non-Hispanic blacks and Hispanics, compared with non-Hispanic whites. In addition, the adjusted rate was lower among non-Hispanic A/PIs, compared with non-Hispanic whites.
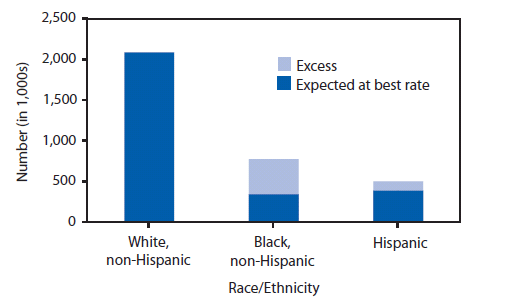
Comparisons with the AHRQ PQI composite rate of hospitalizations for non-Hispanic whites during 2007 were made to estimate excess preventable hospitalizations by race/ethnicity (Figure 4). If non-Hispanic blacks had had the same adjusted rate of preventable hospitalizations as non-Hispanic whites, they would have had approximately 430,000 fewer hospitalizations. Instead of costing $6.1 billion during 2007, preventable hospitalizations among non-Hispanic blacks would have cost $2.7 billion, saving $3.4 billion. If Hispanics had had the same adjusted rate of preventable hospitalizations as non-Hispanic whites, they would have had approximately 110,000 fewer hospitalizations. Instead of costing $4.2 billion during 2007, preventable hospitalizations among Hispanics would have cost $3.3 billion, saving $900 million.
The findings presented in this report are subject to at least four limitations. First, hospital administrative data might be incomplete. Second, data from only half of the 50 states were usable in this analysis, and individual states might differ in how conditions and race/ethnicity are coded. Third, although data analysis can examine disparities related to sex and geography, data were unavailable regarding patients' educational level or disability status and were insufficient to provide estimates for certain populations (i.e., AI/ANs, Native Hawaiians and Other Pacific Islanders, and persons of multiple races). Finally, cost estimates only capture hospital facility costs during the inpatient stay and do not include costs of inpatient physician visits or follow-up care.
Analyses of potentially preventable hospitalizations can be used by communities in multiple ways. Communities with high overall rates can seek opportunities to improve primary care delivery. For example, CareOregon has implemented a medical home program that encouraged primary care practices to provide multidisciplinary, coordinated, comprehensive care to patients; this program enhanced access to care and reduced potentially preventable hospitalization rates (4).
Communities with large differences in rates across populations can examine whether specific groups face larger barriers to primary care, including barriers related to culture, language, and literacy. For example, the Commonwealth Care Alliance of Boston, Massachusetts, focuses on low-income elders and provides them with primary care teams that include physicians, nurse practitioners, and geriatric social workers; these teams provide care and care coordination and have led to reduced rates of potentially preventable hospitalizations and emergency department visits (5).
Communities also can examine rates to determine whether primary care needs to be improved for specific conditions. For example, Intermountain Healthcare assigned care managers to seniors with multiple chronic conditions; care managers developed individualized care plans to each plan and helped coordinate care through electronic health records. Among seniors with diabetes, hospitalizations, complications, and mortality were all reduced (6).
Moreover, estimates of the excess costs associated with potentially preventable hospitalizations can help communities justify investments in primary care that ultimately lead to reduced hospitalizations. Savings on preventable hospitalizations more than offset program costs in the Commonwealth Care Alliance and Intermountain Healthcare interventions (5,6).
Acknowledgment
This report is based in part on data provided by the partner organizations that participated in the HCUP Nationwide Inpatient Sample and the State Inpatient Databases. A list of these organizations is available at http://www.hcup-us.ahrq.gov/db/hcupdatapartners.jsp.
References
-
Bindman AB, Grumbach K, Osmond D, et al. Preventable hospitalizations and access to health care. JAMA 1995;274:305--11.
-
Agency for Healthcare Research and Quality. Guide to prevention quality indicators: hospital admission for ambulatory care sensitive conditions. Rockville, MD: US Department of Health and Human Services, Agency for Healthcare Research and Quality; 2007. Available at http://qualityindicators.ahrq.gov/downloads/pqi/pqi_guide_v31.pdf.
-
Coffey R, Barrett M, Houchens R, et al. Methods applying AHRQ quality indicators to Healthcare Cost and Utilization Project (HCUP): data for the Seventh (2009) National Healthcare Quality Report. Rockville, MD: US Department of Health and Human Services, Agency for Healthcare Research and Quality; 2009. Available at http://www.hcup-us.ahrq.gov/reports/2009_01.pdf.
-
Agency for Healthcare Research and Quality Healthcare Innovations Exchange. Clinics adopting plan-supported medical home model enhance access, improve quality, and reduce admissions among medicaid managed care enrollees. Rockville, MD: US Department of Health and Human Services, Agency for Healthcare Research and Quality; 2009. Available at http://www.innovations.ahrq.gov/content.aspx?id=2584.
-
Agency for Healthcare Research and Quality Healthcare Innovations Exchange. Plan-funded team coordinates enhanced primary care and support services to at-risk seniors, reducing hospitalizations and emergency department visits. Rockville, MD: US Department of Health and Human Services, Agency for Healthcare Research and Quality; 2008. Available at http://www.innovations.ahrq.gov/content.aspx?id=2243.
-
Agency for Healthcare Research and Quality Healthcare Innovations Exchange. Primary care managers supported by information technology systems improve outcomes, reduce costs for patients with complex conditions. Rockville, MD: US Department of Health and Human Services, Agency for Healthcare Research and Quality; 2008. Available at http://www.innovations.ahrq.gov/content.aspx?id=264.
Source: Agency for Healthcare Research and Quality, Healthcare Cost and Utilization Project, Nationwide Inpatient Sample, 2004--2007.
* Per 100,000 population.
Alternate Text: The figure depicts hospitalization rates during 2004-2007among adults per 100,000 population, by area income (divided into four quartiles).
FIGURE 2. Number of excess potentially preventable hospitalizations, by area income --- Agency for Healthcare Research and Quality, Prevention Quality Indicators, United States, 2007
Source: Agency for Healthcare Research and Quality, Healthcare Cost and Utilization Project, Nationwide Inpatient Sample, 2007.
Alternate Text: The figure depicts the number of excess potentially preventable hospitalizations in the United States for 2007, by area income (divided into four quartiles).
FIGURE 3. Preventable hospitalization composite rates* among adults, by race/ethnicity --- United States, Agency for Healthcare Research and Quality, Prevention Quality Indicators, 2004--2007
Source: Agency for Healthcare Research and Quality, Healthcare Cost and Utilization Project, State Inpatient Databases disparities analytic file, 2004--2007.
* Per 100,000 population.
Alternate Text: The figure depicts the composite rate per 100,000 population of preventable hospitalizations in the United States for 2004-2007, by race/ethnicity.
FIGURE 4. Number of excess potentially preventable hospitalizations, by race/ethnicity --- United States, Agency for Healthcare Research and Quality, Prevention Quality Indicators, 2007
Source: Agency for Healthcare Research and Quality, Healthcare Cost and Utilization Project, State Inpatient Databases disparities analytic file, 2007.
Alternate Text: The figure depicts the number of excess potentially preventable hospitalizations in the United States for 2007, by race/ethnicity.
Use of trade names and commercial sources is for identification only and does not imply endorsement by the U.S. Department of
Health and Human Services.
References to non-CDC sites on the Internet are
provided as a service to MMWR readers and do not constitute or imply
endorsement of these organizations or their programs by CDC or the U.S.
Department of Health and Human Services. CDC is not responsible for the content
of pages found at these sites. URL addresses listed in MMWR were current as of
the date of publication.
All MMWR HTML versions of articles are electronic conversions from typeset documents.
This conversion might result in character translation or format errors in the HTML version.
Users are referred to the electronic PDF version (http://www.cdc.gov/mmwr)
and/or the original MMWR paper copy for printable versions of official text, figures, and tables.
An original paper copy of this issue can be obtained from the Superintendent of Documents, U.S.
Government Printing Office (GPO), Washington, DC 20402-9371;
telephone: (202) 512-1800. Contact GPO for current prices.
**Questions or messages regarding errors in formatting should be addressed to
mmwrq@cdc.gov.
