Persons using assistive technology might not be able to fully access information in this file. For assistance, please send e-mail to: mmwrq@cdc.gov. Type 508 Accommodation and the title of the report in the subject line of e-mail.
Youth Risk Behavior Surveillance --- United States, 2009
Danice K. Eaton, PhD,1 Laura Kann, PhD,1 Steve Kinchen,1 Shari Shanklin, MS,1 James Ross, MS,2 Joseph Hawkins, MA,3
William A. Harris, MM,1 Richard Lowry, MD,1 Tim McManus, MS,1 David Chyen, MS,1 Connie Lim, MPA,1
Lisa Whittle, MPH,1 Nancy D. Brener, PhD,1 Howell Wechsler, EdD1
1Division of Adolescent and School Health, National Center for Chronic Disease Prevention and Health Promotion, CDC
2ICF Macro, Calverton, Maryland
3Westat, Rockville, Maryland
Corresponding author: Danice K. Eaton, PhD, Division of Adolescent and School Health, National Center for Chronic Disease Prevention and Health Promotion, MS K-33, 4770 Buford Hwy, NE, Atlanta, GA 30341. Telephone: 770-488-6143; Fax: 770-488-6156; E-mail: dhe0@cdc.gov.
Abstract
Problem: Priority health-risk behaviors, which are behaviors that contribute to the leading causes of morbidity and mortality among youth and adults, often are established during childhood and adolescence, extend into adulthood, and are interrelated and preventable.
Reporting Period Covered: September 2008--December 2009.
Description of the System: The Youth Risk Behavior Surveillance System (YRBSS) monitors six categories of priority health-risk behaviors among youth and young adults: 1) behaviors that contribute to unintentional injuries and violence; 2) tobacco use; 3) alcohol and other drug use; 4) sexual behaviors that contribute to unintended pregnancy and sexually transmitted diseases (STDs), including human immunodeficiency virus (HIV) infection; 5) unhealthy dietary behaviors; and 6) physical inactivity. In addition, YRBSS monitors the prevalence of obesity and asthma. YRBSS includes a national school-based Youth Risk Behavior Survey (YRBS) conducted by CDC and state and local school-based YRBSs conducted by state and local education and health agencies. This report summarizes results from the 2009 national survey, 42 state surveys, and 20 local surveys conducted among students in grades 9--12.
Results: Results from the 2009 national YRBS indicated that many high school students are engaged in behaviors that increase their likelihood for the leading causes of death among persons aged 10--24 years in the United States. Among high school students nationwide, 9.7% rarely or never wore a seat belt when riding in a car driven by someone else. During the 30 days before the survey, 28.3% of high school students rode in a car or other vehicle driven by someone who had been drinking alcohol, 17.5% had carried a weapon, 41.8% had drunk alcohol, and 20.8% had used marijuana. During the 12 months before the survey, 31.5% of high school students had been in a physical fight and 6.3% had attempted suicide. Substantial morbidity and social problems among youth also result from unintended pregnancies and STDs, including HIV infection. Among high school students nationwide, 34.2% were currently sexually active, 38.9% of currently sexually active students had not used a condom during their last sexual intercourse, and 2.1% of students had ever injected an illegal drug. Results from the 2009 YRBS also indicated that many high school students are engaged in behaviors associated with the leading causes of death among adults aged ≥25 years in the United States. During 2009, 19.5% of high school students smoked cigarettes during the 30 days before the survey. During the 7 days before the survey, 77.7% of high school students had not eaten fruits and vegetables five or more times per day, 29.2% had drunk soda or pop at least one time per day, and 81.6% were not physically active for at least 60 minutes per day on all 7 days. One-third of high school students attended physical education classes daily, and 12.0% were obese.
Interpretation: Since 1991, the prevalence of many health-risk behaviors among high school students nationwide has decreased. However, many high school students continue to engage in behaviors that place them at risk for the leading causes of morbidity and mortality. The prevalence of most risk behaviors does not vary substantially among cities and states.
Public Health Action: YRBS data are used to measure progress toward achieving 15 national health objectives for Healthy People 2010 and three of the 10 leading health indicators, to assess trends in priority health-risk behaviors among high school students, and to evaluate the impact of broad school and community interventions at the national, state, and local levels. More effective school health programs and other policy and programmatic interventions are needed to reduce risk and improve health outcomes among youth.
Introduction
In the United States, 74% of all deaths among youth and young adults aged 10--24 years result from four causes: motor-vehicle crashes (30%), other unintentional injuries (16%), homicide (16%), and suicide (12%) (1). Substantial morbidity and social problems also result from the approximately 757,000 pregnancies among women aged 15--19 years (2), the estimated 9.1 million cases of sexually transmitted diseases (STDs) among persons aged 15--24 years (3), and the estimated 6,610 cases of human immunodeficiency virus/acquired immunodeficiency syndrome (HIV/AIDS) among persons aged 15--24 years (4) that occur annually. Among adults aged ≥25 years, 59% of all deaths in the United States result from cardiovascular disease (35%) and cancer (24%) (1). These leading causes of morbidity and mortality among youth and adults in the United States are related to six categories of priority health-risk behaviors: 1) behaviors that contribute to unintentional injuries and violence; 2) tobacco use; 3) alcohol and other drug use; 4) sexual behaviors that contribute to unintended pregnancy and STDs, including human immunodeficiency virus (HIV) infection; 5) unhealthy dietary behaviors; and 6) physical inactivity. These behaviors frequently are interrelated and are established during childhood and adolescence and extend into adulthood.
To monitor priority health-risk behaviors in each of these six categories and obesity and asthma among youth and young adults, CDC developed the Youth Risk Behavior Surveillance System (YRBSS) (5). YRBSS includes school-based national, state, and local Youth Risk Behavior Surveys (YRBS) conducted among representative samples of students in grades 9--12. National, state, and local surveys have been conducted biennially since 1991 (Table 1).
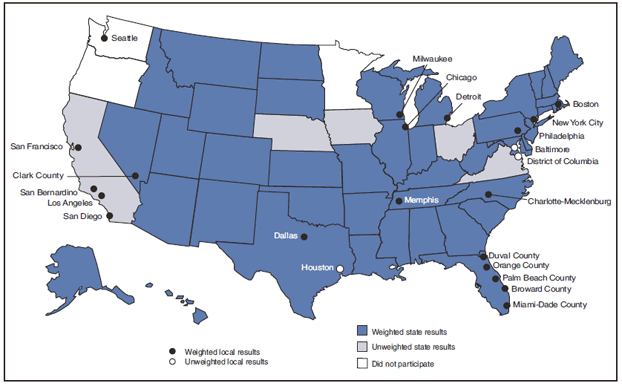
This report summarizes results from the 2009 national YRBS and trends in risk behaviors during 1991--2009. Data from the 42 state and 20 local surveys with weighted data for the 2009 YRBSS cycle (Figure 1) also are included in this report. Data from the remaining five state surveys and three local surveys with unweighted data are not included. One local survey was conducted during fall 2008; the national survey, 39 weighted state surveys, and 18 weighted local surveys were conducted during spring 2009; and three of the weighted state surveys and one of the weighted local surveys were conducted during fall 2009.
Methods
Detailed information about the national, state, and local YRBSs has been described elsewhere (5). Information also is available at http://www.cdc.gov/yrbs.
Sampling
National Youth Risk Behavior Survey
The sampling frame for the 2009 national YRBS consisted of all regular public and private schools with students in at least one of grades 9--12 in the 50 states and the District of Columbia. The sampling frame was obtained from the Market Data Retrieval (MDR), formerly Quality Education Data (QED), Inc., database (6). The MDR database includes information on both public and private schools and the most recent data from the Common Core of Data from the National Center for Education Statistics (7). A three-stage cluster sample design produced a nationally representative sample of students in grades 9--12 who attend public and private schools. The first-stage sampling frame consisted of 1,276 primary sampling units (PSUs), consisting of counties, subareas of large counties, or groups of smaller, adjacent counties. The 1,276 PSUs were categorized into 16 strata according to their metropolitan statistical area (MSA) status (i.e., urbanicity) and the percentages of black and Hispanic students in the PSUs. From the 1,276 PSUs, 57 were sampled with probability proportional to overall school enrollment size for the PSU.
In the second stage of sampling, 196 schools with any of grades 9--12 were sampled with probability proportional to school enrollment size. The third stage of sampling consisted of randomly sampling in each of grades 9--12, one or two classrooms from either a required subject (e.g., English or social studies) or a required period (e.g., homeroom or second period). All students in sampled classes were eligible to participate. Schools, classes, and students that refused to participate were not replaced.
To enable a separate analysis of data for black and Hispanic students, three strategies were used to oversample these students: 1) larger sampling rates were used to select PSUs that were in high-black and high-Hispanic strata; 2) a modified measure of size was used to increase the probability of sampling schools with a disproportionately high minority enrollment; and 3) two classes per grade, rather than one, were sampled in schools with a high minority enrollment.
State and Local Youth Risk Behavior Surveys
In 2009, each state and local school-based survey used a two-stage cluster sample design to produce a representative sample of public school students in grades 9--12 in their jurisdiction. In the first sampling stage, schools with any of grades 9--12 were sampled with probability proportional to school enrollment size in 40 states and six cities; all schools with any of grades 9--12 were sampled in two states and 14 cities. In the second sampling stage, in 41 states and 20 cities, intact classes from either a required subject (e.g., English or social studies) or a required period (e.g., homeroom or second period) were sampled randomly, and all students in the sampled classes were eligible to participate. In one state, all students in sampled schools were eligible to participate.
Data Collection Procedures and Questionnaires
Survey procedures for the national, state, and local surveys were designed to protect students' privacy by allowing for anonymous and voluntary participation. Before survey administration, local parental permission procedures were followed. Students completed the self-administered questionnaire during one class period and recorded their responses directly on a computer-scannable booklet or answer sheet. CDC's Institutional Review Board approved the protocol for the national YRBS.
The 2009 standard questionnaire contained 87 questions. States and cities could add or delete questions from the standard questionnaire. For the national questionnaire, 11 questions were added to the standard questionnaire. Skip patterns were not included in any YRBS questionnaire to protect students' privacy by ensuring all students took about the same amount of time to complete the questionnaire. For state and local surveys, only data from standard questions are presented in this report. Information about the reliability of the standard questionnaire has been published elsewhere (8).
Data Processing Procedures and Response Rates
For the 2009 national YRBS, 16,460 questionnaires were completed in 158 schools. The national data set was cleaned and edited for inconsistencies. Missing data were not statistically imputed. Among the 16,460 completed questionnaires from the national YRBS, 50 failed quality control* and were excluded from analysis, leaving 16,410 usable questionnaires (Table 2). The school response rate was 81%; the student response rate was 88%; the overall response rate was 71%† (Table 2).
In 2009, data from 42 state and 20 local surveys were weighted. Data from each state and local data set also were cleaned and edited for inconsistencies with the same procedures used for the national data set. The number of completed questionnaires that failed quality control checks and were excluded from analysis from the state and local surveys ranged from 0 to 374 (median: 7). The student sample sizes ranged from 965 to 14,870 (Table 2). School response rates ranged from 73% to 100%; student response rates ranged from 61% to 94%; and overall response rates ranged from 60% to 94%.
Race/ethnicity was computed from two questions: 1) "Are you Hispanic or Latino?" (response options were "yes" or "no"), and 2) "What is your race?" (response options were "American Indian or Alaska Native," "Asian," "black or African American," "Native Hawaiian or other Pacific Islander," or "white"). For the second question, students could select more than one response option. For this report, students were classified as "Hispanic/Latino" and are referred to as "Hispanic" if they answered "yes" to the first question, regardless of how they answered the second question. Students who answered "no" to the first question and selected only "black or African American" to the second question were classified as "black or African American" and are referred to as "black." Students who answered "no" to the first question and selected only "white" to the second question were classified, and are referred to, as "white." Race/ethnicity was classified as missing for students who did not answer the first question and for students who answered "no" to the first question but did not answer the second question.
Students were classified as obese or overweight based on their body mass index (kg/m2) (BMI), which was calculated from self-reported height and weight. The BMI values were compared with sex- and age-specific reference data from the 2000 CDC growth charts (9). Obese was defined as a BMI of ≥95th percentile for age and sex. Overweight was defined as a BMI of ≥85th percentile and <95th percentile for age and sex. These classifications are not intended to diagnose obesity or overweight in individual students, but to provide estimates of obesity and overweight for the population of students surveyed.
Weighting
For the national YRBS, a weight based on student sex, race/ethnicity, and grade was applied to each record to adjust for school and student nonresponse and oversampling of black and Hispanic students. The overall weights were scaled so that the weighted count of students equals the total sample size, and the weighted proportions of students in each grade match the national population proportions. Therefore, weighted estimates are representative of all students in grades 9--12 attending public and private school in the United States.
State and local surveys that had a representative sample of students, appropriate documentation, and an overall response rate of 60% or higher were weighted. A weight was applied to each record to adjust for student nonresponse and the distribution of students by grade, sex, and race/ethnicity in each jurisdiction. Therefore, weighted state and local estimates are representative of all students in grades 9--12 attending public schools in each jurisdiction.
Analytic Methods
Statistical analyses were conducted on weighted data using SAS(r) (10) and SUDAAN (11) software to account for the complex sampling designs. Prevalence estimates and confidence intervals were computed for all variables and all data sets. In addition, for the national YRBS data, t tests were used to determine pairwise differences between subpopulations and temporal changes during 2007--2009 (12). Differences between prevalence estimates were considered statistically significant if the t test p value was <0.05 for main effects (sex, race/ethnicity, and grade), for interactions (sex by race/ethnicity, sex by grade, race/ethnicity by sex, and grade by sex), and for changes over time. Only statistically significant differences in prevalence estimates are reported in the results section in the following order: sex, sex by race/ethnicity, sex by grade, race/ethnicity, race/ethnicity by sex, grade, and grade by sex.
For the national YRBS data, temporal changes from the earliest year of data collection for each variable to 2009 were analyzed using logistic regression analyses that controlled for sex, grade, and race/ethnicity and that simultaneously assessed linear and quadratic time effects (12). Quadratic trends indicate a significant but nonlinear trend in the data over time. Trends that include significant linear and quadratic components demonstrate nonlinear variation (e.g., leveling off or change in direction) in addition to an overall increase or decrease over time. Trends are described only for variables with significant temporal changes from the earliest year of data collection to 2009 or during 2007--2009.
Results
Behaviors that Contribute to Unintentional Injuries
Rarely or Never Wore a Seat Belt
Nationwide, 9.7% of students had rarely or never worn a seat belt when riding in a car driven by someone else (Table 3). Overall, the prevalence of having rarely or never worn a seat belt was higher among male (11.5%) than female (7.7%) students; higher among white male (11.2%) and black male (14.8%) than white female (7.6%) and black female (8.3%) students, respectively; and higher among 10th-grade male (11.7%), 11th-grade male (11.2%), and 12th-grade male (12.0%) than 10th-grade female (6.8%), 11th-grade female (6.0%), and 12th-grade female (8.0%) students, respectively. The prevalence of having rarely or never worn a seat belt was higher among black male (14.8%) than Hispanic male (9.8%) students. Overall, the prevalence of having rarely or never worn a seat belt was higher among 9th-grade (10.6%) than 11th-grade (8.7%) students and higher among 9th-grade female (9.8%) than 10th-grade female (6.8%) and 11th-grade female (6.0%) students. Prevalence of having rarely or never worn a seat belt ranged from 5.7% to 18.7% across state surveys (median: 11.4%) and from 4.1% to 28.7% across local surveys (median: 10.9%) (Table 4).
Rarely or Never Wore a Bicycle Helmet
Among the 69.5% of students nationwide who had ridden a bicycle during the 12 months before the survey, 84.7% had rarely or never worn a bicycle helmet (Table 3). Overall, the prevalence of having rarely or never worn a bicycle helmet was higher among black (92.8%) and Hispanic (89.1%) than white (82.3%) students; higher among black (92.8%) than Hispanic (89.1%) students; higher among black female (92.7%) and Hispanic female (88.4%) than white female (80.2%) students; higher among black female (92.7%) than Hispanic female (88.4%) students; and higher among black male (92.9%) than white male (83.9%) students. Overall, the prevalence of having rarely or never worn a bicycle helmet was higher among 11th-grade (85.9%) than 12th-grade (82.1%) students; higher among 9th-grade female (85.3%) and 10th-grade female (82.8%) than 12th-grade female (79.4%) students; and higher among 11th-grade male (87.9%) than 12th-grade male (84.1%) students. Prevalence of having rarely or never worn a bicycle helmet among students who had ridden a bicycle during the 12 months before the survey ranged from 62.4% to 94.4% across state surveys (median: 86.7%) and from 51.7% to 95.8% across local surveys (median: 89.1%) (Table 4).
Rarely or Never Wore a Motorcycle Helmet
Among the 26.1% of students nationwide who had ridden a motorcycle during the 12 months before the survey, 31.9% had rarely or never worn a motorcycle helmet (Table 5). Overall, the prevalence of having rarely or never worn a motorcycle helmet was higher among male (36.8%) than female (24.3%) students; higher among white male (30.6%) than white female (16.0%) students; and higher among 10th-grade male (35.3%), 11th-grade male (35.1%), and 12th-grade male (34.0%) than 10th-grade female (21.4%), 11th-grade female (20.4%), and 12th-grade female (20.5%) students, respectively. Overall, the prevalence of having rarely or never worn a motorcycle helmet was higher among black (49.0%) and Hispanic (48.3%) than white (24.6%) students; higher among black female (40.5%) and Hispanic female (46.1%) than white female (16.0%) students; and higher among black male (53.9%) and Hispanic male (49.7%) than white male (30.6%) students. Overall, the prevalence of having rarely or never worn a motorcycle helmet was higher among 9th-grade (38.6%) than 10th-grade (29.8%), 11th-grade (28.9%), and 12th-grade (28.2%) students and higher among 9th-grade female (34.2%) than 10th-grade female (21.4%), 11th-grade female (20.4%), and 12th-grade female (20.5%) students.
Rode with a Driver Who Had Been Drinking Alcohol
During the 30 days before the survey, 28.3% of students nationwide had ridden one or more times in a car or other vehicle driven by someone who had been drinking alcohol (Table 6). The prevalence of having ridden with a driver who had been drinking alcohol was higher among 9th-grade female (30.0%) than 9th-grade male (25.3%) students. Overall, the prevalence of having ridden with a driver who had been drinking alcohol was higher among black (30.0%) and Hispanic (34.2%) than white (26.2%) students; higher among Hispanic (34.2%) than black (30.0%) students; higher among Hispanic female (34.9%) than white female (26.9%) and black female (28.7%) students; and higher among black male (31.2%) and Hispanic male (33.5%) than white male (25.5%) students. The prevalence of having ridden with a driver who had been drinking alcohol was higher among 11th-grade male (29.2%) than 9th-grade male (25.3%) students.The prevalence of having ridden with a driver who had been drinking alcohol ranged from 13.6% to 37.1% across state surveys (median: 25.6%) and from 17.5% to 38.7% across local surveys (median: 27.5%) (Table 7).
Drove When Drinking Alcohol
During the 30 days before the survey, 9.7% of students nationwide had driven a car or other vehicle one or more times when they had been drinking alcohol (Table 6). Overall, the prevalence of having driven when they had been drinking alcohol was higher among male (11.6%) than female (7.6%) students; higher among white male (12.7%), black male (8.7%), and Hispanic male (11.0%) than white female (8.7%), black female (4.1%), and Hispanic female (7.9%) students, respectively; and higher among 10th-grade male (11.0%), 11th-grade male (13.0%), and 12th-grade male (19.3%) than 10th-grade female (5.3%), 11th-grade female (9.6%), and 12th-grade female (11.4%) students, respectively. Overall, the prevalence of having driven when they had been drinking alcohol was higher among white (10.8%) and Hispanic (9.4%) than black (6.4%) students; higher among white female (8.7%) and Hispanic female (7.9%) than black female (4.1%) students; and higher among white male (12.7%) than black male (8.7%) students. Overall, the prevalence of having driven when they had been drinking alcohol was higher among 10th-grade (8.3%), 11th-grade (11.4%), and 12th-grade (15.4%) than 9th-grade (5.0%) students; higher among 11th-grade (11.4%) and 12th-grade (15.4%) than 10th-grade (8.3%) students; higher among 12th-grade (15.4%) than 11th-grade (11.4%) students; higher among 11th-grade female (9.6%) and 12th-grade female (11.4%) than 9th-grade female (4.8%) and 10th-grade female (5.3%) students; higher among 10th-grade male (11.0%), 11th-grade male (13.0%), and 12th-grade male (19.3%) than 9th-grade male (5.1%) students; and higher among 12th-grade male (19.3%) than 10th-grade male (11.0%) and 11th-grade male (13.0%) students. The prevalence of having driven a car when they had been drinking alcohol ranged from 4.9% to 15.2% across state surveys (median: 8.9%) and from 3.1% to 11.1% across local surveys (median: 6.7%) (TK).
Behaviors that Contribute to Violence
Carried a Weapon
Nationwide, 17.5% of students had carried a weapon (e.g., a gun, knife, or club) on at least 1 day during the 30 days before the survey (Table 8). Overall, the prevalence of having carried a weapon was higher among male (27.1%) than female (7.1%) students; higher among white male (29.3%), black male (21.0%), and Hispanic male (26.5%) than white female (6.5%), black female (7.8%), and Hispanic female (7.9%) students, respectively; and higher among 9th-grade male (27.3%), 10th-grade male (28.5%), 11th-grade male (25.6%), and 12th-grade male (26.5%) than 9th-grade female (7.6%), 10th-grade female (7.2%), 11th-grade female (6.3%), and 12th-grade female (6.4%) students, respectively. Overall, the prevalence of having carried a weapon was higher among white (18.6%) than black (14.4%) students and higher among white male (29.3%) and Hispanic male (26.5%) than black male (21.0%) students. The prevalence of having carried a weapon ranged 9.6% to 27.4% across state surveys (median: 18.2%) and from 11.2% to 22.3% across local surveys (median: 14.4%) (Table 9).
Carried a Gun
Nationwide, 5.9% of students had carried a gun on at least 1 day during the 30 days before the survey (Table 8). Overall, the prevalence of having carried a gun was higher among male (9.8%) than female (1.7%) students; higher among white male (9.5%), black male (13.2%), and Hispanic male (8.2%) than white female (1.5%), black female (1.8%), and Hispanic female (1.9%) students, respectively; and higher among 9th-grade male (9.8%), 10th-grade male (9.9%), 11th-grade male (8.9%), and 12th-grade male (10.6%) than 9th-grade female (1.4%), 10th-grade female (1.8%), 11th-grade female (1.7%), and 12th-grade female (1.6%) students, respectively. The prevalence of having carried a gun was higher among black male (13.2%) than Hispanic male (8.2%) students. Prevalence of having carried a gun ranged from 1.8% to 11.5% across state surveys (median: 6.5%) and from 2.8% to 8.5% across local surveys (median: 5.3%) (Table 9).
In a Physical Fight
Nationwide, 31.5% of students had been in a physical fight one or more times during the 12 months before the survey (Table 10). Overall, the prevalence of having been in a physical fight was higher among male (39.3%) than female (22.9%) students; higher among white male (36.0%), black male (48.3%), and Hispanic male (43.8%) than white female (18.2%), black female (33.9%), and Hispanic female (28.5%) students, respectively; and higher among 9th-grade male (45.1%), 10th-grade male (41.2%), 11th-grade male (36.1%), and 12th-grade male (32.5%) than 9th-grade female (27.8%), 10th-grade female (24.8%), 11th-grade female (20.5%), and 12th-grade female (17.0%) students, respectively. Overall, the prevalence of having been in a physical fight was higher among black (41.1%) and Hispanic (36.2%) than white (27.8%) students; higher among black (41.1%) than Hispanic (36.2%) students; higher among black female (33.9%) and Hispanic female (28.5%) than white female (18.2%) students; higher among black female (33.9%) than Hispanic female (28.5%) students; and higher among black male (48.3%) and Hispanic male (43.8%) than white male (36.0%) students. Overall, the prevalence of having been in a physical fight was higher among 9th-grade (37.0%) than 10th-grade (33.5%), 11th-grade (28.6%), and 12th-grade (24.9%) students; higher among 10th-grade (33.5%) than 11th-grade (28.6%) and 12th-grade (24.9%) students; higher among 11th-grade (28.6%) than 12th-grade (24.9%) students; higher among 9th-grade female (27.8%) and 10th-grade female (24.8%) than 11th-grade female (20.5%) and 12th-grade female (17.0%) students; higher among 11th-grade female (20.5%) than 12th-grade female (17.0%) students; higher among 9th-grade male (45.1%) than 10th-grade male (41.2%), 11th-grade male (36.1%), and 12th-grade male (32.5%) students; and higher among 10th-grade male (41.2%) than 11th-grade male (36.1%) and 12th-grade male (32.5%) students. Prevalence of having been in a physical fight ranged from 22.8% to 37.3% across state surveys (median: 29.8%) and from 21.8% to 49.0% across local surveys (median: 33.1%) (Table 11).
Injured in a Physical Fight
Nationwide, 3.8% of students had been in a physical fight one or more times during the 12 months before the survey in which they were injured and had to be treated by a doctor or nurse (Table 10). Overall, the prevalence of having been injured in a physical fight was higher among male (5.1%) than female (2.2%) students; higher among white male (4.2%), black male (7.0%), and Hispanic male (6.0%) than white female (1.3%), black female (4.4%), and Hispanic female (3.3%) students, respectively; and higher among 9th-grade male (5.5%), 10th-grade male (5.2%), 11th-grade male (5.4%), and 12th-grade male (4.2%) than 9th-grade female (2.5%), 10th-grade female (2.7%), 11th-grade female (2.1%), and 12th-grade female (1.4%) students, respectively. Overall, the prevalence of having been injured in a physical fight was higher among black (5.7%) and Hispanic (4.7%) than white (2.9%) students; higher among black female (4.4%) and Hispanic female (3.3%) than white female (1.3%) students; and higher among black male (7.0%) and Hispanic male (6.0%) than white male (4.2%) students. Overall, the prevalence of having been injured in a physical fight was higher among 9th-grade (4.1%), 10th-grade (4.1%), and 11th-grade (3.8%) than 12th-grade (2.9%) students and higher among 9th-grade female (2.5%) and 10th-grade female (2.7%) than 12th-grade female (1.4%) students. The prevalence of having been injured in a physical fight ranged from 2.2% to 6.9% across state surveys (median: 3.8%) and from 3.0% to 7.2% across local surveys (median: 5.1%) (Table 11).
Dating Violence
During the 12 months before the survey, 9.8% of students nationwide had been hit, slapped, or physically hurt on purpose by their boyfriend or girlfriend (i.e., dating violence) (Table 12). The prevalence of dating violence was higher among 11th-grade male (11.5%) than 11th-grade female (9.1%) students. Overall, the prevalence of dating violence was higher among black (14.3%) and Hispanic (11.5%) than white (8.0%) students; higher among black (14.3%) than Hispanic (11.5%) students; higher among black female (14.8%) and Hispanic female (11.4%) than white female (7.2%) students; higher among black female (14.8%) than Hispanic female (11.4%) students; and higher among black male (13.8%) and Hispanic male (11.7%) than white male (8.8%) students. The prevalence of dating violence was higher among 11th-grade male (11.5%) and 12th-grade male (11.4%) than 9th-grade male (9.1%) students. Prevalence of dating violence ranged 7.4% to 17.8% across state surveys (median: 11.1%) and from 8.0% to 18.5% across local surveys (median: 12.0%) (Table 13).
Forced to Have Sexual Intercourse
Nationwide, 7.4% of students had ever been physically forced to have sexual intercourse when they did not want to (Table 12). Overall, the prevalence of having been forced to have sexual intercourse was higher among female (10.5%) than male (4.5%) students; higher among white female (10.0%), black female (12.0%), and Hispanic female (11.2%) than white male (3.2%), black male (7.9%), and Hispanic male (5.7%) students, respectively; and higher among 9th-grade female (9.4%), 10th-grade female (10.6%), 11th-grade female (11.2%), and 12th-grade female (10.8%) than 9th-grade male (4.1%), 10th-grade male (4.0%), 11th-grade male (5.4%), and 12th-grade male (4.9%) students, respectively. Overall, the prevalence of having been forced to have sexual intercourse was higher among black (10.0%) and Hispanic (8.4%) than white (6.3%) students; and higher among black male (7.9%) and Hispanic male (5.7%) than white male (3.2%) students. Overall, the prevalence of having been forced to have sexual intercourse was higher among 11th-grade (8.2%) than 9th-grade (6.6%) students. Prevalence of having been forced to have sexual intercourse ranged from 6.4% to 13.2% across state surveys (median: 8.8%) and from 6.0% to 12.0% across local surveys (median: 7.9%) (Table 13).
Carried a Weapon on School Property
Nationwide, 5.6% of students had carried a weapon (e.g., a gun, knife, or club) on school property on at least 1 day during the 30 days before the survey (Table 14). Overall, the prevalence of having carried a weapon on school property was higher among male (8.0%) than female (2.9%) students; higher among white male (8.3%), black male (6.6%), and Hispanic male (7.9%) than white female (2.4%), black female (4.0%), and Hispanic female (3.7%) students, respectively; and higher among 9th-grade male (6.4%), 10th-grade male (8.9%), 11th-grade male (7.9%), and 12th-grade male (9.1%) than 9th-grade female (3.2%), 10th-grade female (3.1%), 11th-grade female (2.3%), and 12th-grade female (2.9%) students, respectively. The prevalence of having carried a weapon on school property was higher among Hispanic female (3.7%) than white female (2.4%) students. The prevalence of having carried a weapon on school property was higher among 10th-grade male (8.9%) and 12th-grade male (9.1%) than 9th-grade male (6.4%) students. Prevalence of having carried a weapon on school property ranged from 3.1% to 11.5% across state surveys (median: 5.4%) and from 2.6% to 7.8% across local surveys (median: 4.6%) (Table 15).
Threatened or Injured with a Weapon on School Property
During the 12 months before the survey, 7.7% of students nationwide had been threatened or injured with a weapon (e.g., a gun, knife, or club) on school property one or more times (Table 14). Overall, the prevalence of having been threatened or injured with a weapon on school property was higher among male (9.6%) than female (5.5%) students; higher among white male (7.8%), black male (11.2%), and Hispanic male (12.0%) than white female (4.9%), black female (7.4%), and Hispanic female (6.3%) students, respectively; and higher among 10th-grade male (11.1%), 11th-grade male (10.7%), and 12th-grade male (6.5%) than 10th-grade female (5.2%), 11th-grade female (4.8%), and 12th-grade female (3.8%) students, respectively. Overall, the prevalence of having been threatened or injured with a weapon on school property was higher among black (9.4%) and Hispanic (9.1%) than white (6.4%) students; higher among black female (7.4%) than white female (4.9%) students; and higher among black male (11.2%) and Hispanic male (12.0%) than white male (7.8%) students. Overall, the prevalence of having been threatened or injured with a weapon on school property was higher among 9th-grade (8.7%), 10th-grade (8.4%), and 11th-grade (7.9%) than 12th-grade (5.2%) students; higher among 9th-grade female (7.7%) than 10th-grade female (5.2%), 11th-grade female (4.8%), and 12th-grade female (3.8%) students; and higher among 9th-grade male (9.5%), 10th-grade male (11.1%), and 11th-grade male (10.7%) than 12th-grade male (6.5%) students. Prevalence of having been threatened or injured with a weapon on school property ranged from 5.6% to 11.9% across state surveys (median: 7.7%) and from 7.2% to 13.9% across local surveys (median: 8.1%) (Table 15).
In a Physical Fight on School Property
Nationwide, 11.1% of students had been in a physical fight on school property one or more times during the 12 months before the survey (Table 16). Overall, the prevalence of having been in a physical fight on school property was higher among male (15.1%) than female (6.7%) students; higher among white male (12.4%), black male (22.2%), and Hispanic male (17.7%) than white female (4.3%), black female (12.5%), and Hispanic female (9.3%) students, respectively; and higher among 9th-grade male (19.7%), 10th-grade male (16.4%), 11th-grade male (13.3%), and 12th-grade male (9.3%) than 9th-grade female (9.5%), 10th-grade female (7.3%), 11th-grade female (5.5%), and 12th-grade female (3.8%) students, respectively. Overall, the prevalence of having been in a physical fight on school property was higher among black (17.4%) and Hispanic (13.5%) than white (8.6%) students; higher among black (17.4%) than Hispanic (13.5%) students; higher among black female (12.5%) and Hispanic female (9.3%) than white female (4.3%) students; higher among black male (22.2%) and Hispanic male (17.7%) than white male (12.4%) students; and higher among black male (22.2%) than Hispanic male (17.7%) students. Overall, the prevalence of having been in a physical fight on school property was higher among 9th-grade (14.9%) than 10th-grade (12.1%), 11th-grade (9.5%), and 12th-grade (6.6%) students; higher among 10th-grade (12.1%) than 11th-grade (9.5%) and 12th-grade (6.6%) students; higher among 11th-grade (9.5%) than 12th-grade (6.6%) students; higher among 9th-grade female (9.5%) than 10th-grade female (7.3%), 11th-grade female (5.5%), and 12th-grade female (3.8%) students; higher among 10th-grade female (7.3%) than 11th-grade female (5.5%) and 12th-grade female (3.8%) students; higher among 11th-grade female (5.5%) than 12th-grade female (3.8%) students; higher among 9th-grade male (19.7%) than 10th-grade male (16.4%), 11th-grade male (13.3%), and 12th-grade male (9.3%) students; higher among 10th-grade male (16.4%) than 11th-grade male (13.3%) and 12th-grade male (9.3%) students; and higher among 11th-grade male (13.3%) than 12th-grade male (9.3%) students. Prevalence of having been in a physical fight on school property ranged from 7.4% to 15.0% across state surveys (median: 10.6%) and from 9.3% to 25.4% across local surveys (median: 12.7%) (Table 17).
Bullied on School Property
Nationwide, 19.9% of students had been bullied on school property during the 12 months before the survey (Table 16). Overall, the prevalence of having been bullied on school property was higher among female (21.2%) than male (18.7%) students; higher among white female (23.5%) than white male (19.9%) students; and higher among 11th-grade female (20.5%) and 12th-grade female (15.3%) than 11th-grade male (17.1%) and 12th-grade male (11.8%) students, respectively. Overall, the prevalence of having been bullied on school property was higher among white (21.6%) than black (13.7%) and Hispanic (18.5%) students; higher among Hispanic (18.5%) than black (13.7%) students; higher among white female (23.5%) than black female (15.5%) and Hispanic female (18.9%) students; and higher among white male (19.9%) and Hispanic male (18.0%) than black male (11.9%) students. Overall, the prevalence of having been bullied on school property was higher among 9th-grade (24.5%) than 10th-grade (21.5%), 11th-grade (18.7%), and 12th-grade (13.5%) students; higher among 10th-grade (21.5%) than 11th-grade (18.7%) and 12th-grade (13.5%) students; higher among 11th-grade (18.7%) than 12th-grade (13.5%) students; higher among 9th-grade female (26.0%) than 10th-grade female (22.2%), 11th-grade female (20.5%), and 12th-grade female (15.3%) students; higher among 10th-grade female (22.2%) and 11th-grade female (20.5%) than 12th-grade female (15.3%) students; higher among 9th-grade male (23.3%) and 10th-grade male (20.8%) than 11th-grade male (17.1%) and 12th-grade male (11.8%) students; and higher among 11th-grade male (17.1%) than 12th-grade male (11.8%) students. Prevalence of having been bullied on school property ranged from 13.4% to 24.4% across state surveys (median: 19.4%) and from 9.3% to 20.1% across local surveys (median: 13.0%) (Table 17).
Did Not Go to School Because of Safety Concerns
Nationwide, 5.0% of students had not gone to school on at least 1 day during the 30 days before the survey because they felt they would be unsafe at school or on their way to or from school (Table 18). Overall, the prevalence of having not gone to school because of safety concerns was higher among black (6.3%) and Hispanic (8.1%) than white (3.5%) students; higher among black female (6.6%) and Hispanic female (8.3%) than white female (3.8%) students; and higher among black male (5.9%) and Hispanic male (7.9%) than white male (3.3%) students. Overall, the prevalence of having not gone to school because of safety concerns was higher among 9th-grade (5.8%), 10th-grade (5.0%), and 11th-grade (5.3%) than 12th-grade (3.4%) students; higher among 9th-grade female (6.4%), 10th-grade female (5.3%), and 11th-grade female (5.8%) than 12th-grade female (3.3%) students; and higher among 9th-grade male (5.4%) and 11th-grade male (4.9%) than 12th-grade male (3.4%) students. Prevalence of having not gone to school because of safety concerns ranged from 2.9% to 10.4% across state surveys (median: 5.7%) and from 4.8% to 19.1% across local surveys (median: 8.4%) (Table 19).
Felt Sad or Hopeless
During the 12 months before the survey, 26.1% of students nationwide had felt so sad or hopeless almost every day for 2 or more weeks in a row that they stopped doing some usual activities (Table 20). Overall, the prevalence of having felt sad or hopeless almost every day for 2 or more weeks in a row was higher among female (33.9%) than male (19.1%) students; higher among white female (31.1%), black female (37.5%), and Hispanic female (39.7%) than white male (17.2%), black male (17.9%), and Hispanic male (23.6%) students, respectively; and higher among 9th-grade female (35.8%), 10th-grade female (34.7%), 11th-grade female (35.5%), and 12th-grade female (28.9%) than 9th-grade male (18.6%), 10th-grade male (18.2%), 11th-grade male (19.6%), and 12th-grade male (19.8%) students, respectively. Overall, the prevalence of having felt sad or hopeless almost every day for 2 or more weeks in a row was higher among black (27.7%) and Hispanic (31.6%) than white (23.7%) students; higher among Hispanic (31.6%) than black (27.7%) students; higher among black female (37.5%) and Hispanic female (39.7%) than white female (31.1%) students; and higher among Hispanic male (23.6%) than white male (17.2%) and black male (17.9%) students. Overall, the prevalence of having felt sad or hopeless almost every day for 2 or more weeks in a row was higher among 11th-grade (27.3%) than 12th-grade (24.3%) students; and higher among 9th-grade female (35.8%), 10th-grade female (34.7%), and 11th-grade female (35.5%) than 12th-grade female (28.9%) students. Prevalence of having felt sad or hopeless almost every day for 2 or more weeks in a row ranged from 20.8% to 34.9% across state surveys (median: 27.0%) and from 20.6% to 33.8% across local surveys (median: 28.5%) (Table 21).
Seriously Considered Attempting Suicide
Nationwide, 13.8% of students had seriously considered attempting suicide during the 12 months before the survey (Table 22). Overall, the prevalence of having seriously considered attempting suicide was higher among female (17.4%) than male (10.5%) students; higher among white female (16.1%), black female (18.1%), and Hispanic female (20.2%) than white male (10.5%), black male (7.8%), and Hispanic male (10.7%) students, respectively; and higher among 9th-grade female (20.3%), 10th-grade female (17.2%), 11th-grade female (17.8%), and 12th-grade female (13.6%) than 9th-grade male (10.0%), 10th-grade male (10.0%), 11th-grade male (11.4%), and 12th-grade male (10.5%) students, respectively. Overall, the prevalence of having seriously considered attempting suicide was higher among Hispanic (15.4%) than white (13.1%) and black (13.0%) students; higher among Hispanic female (20.2%) than white female (16.1%) students; and higher among white male (10.5%) than black male (7.8%) students. Overall, the prevalence of having seriously considered attempting suicide was higher among 9th-grade (14.8%) and 11th-grade (14.5%) than 12th-grade (12.1%) students; higher among 9th-grade female (20.3%) than 10th-grade female (17.2%) and 12th-grade female (13.6%) students; and higher among 10th-grade female (17.2%) and 11th-grade female (17.8%) than 12th-grade female (13.6%) students. Prevalence of having seriously considered attempting suicide ranged from 11.6% to 18.9% across state surveys (median: 14.3%) and from 10.5% to 18.2% across local surveys (median: 13.1%) (Table 23).
Made a Suicide Plan
During the 12 months before the survey, 10.9% of students nationwide had made a plan about how they would attempt suicide (Table 22). Overall, the prevalence of having made a suicide plan was higher among female (13.2%) than male (8.6%) students; higher among white female (12.3%), black female (13.3%), and Hispanic female (15.4%) than white male (8.5%), black male (6.2%), and Hispanic male (9.0%) students, respectively; and higher among 9th-grade female (14.9%), 10th-grade female (14.3%), and 11th-grade female (13.4%) than 9th-grade male (7.3%), 10th-grade male (9.3%), and 11th-grade male (9.4%) students, respectively. Overall, the prevalence of having made a suicide plan was higher among Hispanic (12.2%) than white (10.3%) and black (9.8%) students; higher among Hispanic female (15.4%) than white female (12.3%) students; and higher among white male (8.5%) and Hispanic male (9.0%) than black male (6.2%) students. Overall, the prevalence of having made a suicide plan was higher among 10th-grade (11.7%) than 12th-grade (9.2%) students and higher among 9th-grade female (14.9%), 10th-grade female (14.3%), and 11th-grade female (13.4%) than 12th-grade female (9.6%) students. Prevalence of having made a suicide plan ranged 8.7% to 16.0% across state surveys (median: 11.4%) and from 8.3% to 14.4% across local surveys (median: 10.7%) (Table 23).
Attempted Suicide
Nationwide, 6.3% of students had attempted suicide one or more times during the 12 months before the survey (Table 24). Overall, the prevalence of having attempted suicide was higher among female (8.1%) than male (4.6%) students; higher among white female (6.5%), black female (10.4%), and Hispanic female (11.1%) than white male (3.8%), black male (5.4%), and Hispanic male (5.1%) students, respectively; and higher among 9th-grade female (10.3%), 10th-grade female (8.8%), and 11th-grade female (7.8%) than 9th-grade male (4.5%), 10th-grade male (5.2%), and 11th-grade male (4.7%) students, respectively. Overall, the prevalence of having attempted suicide was higher among black (7.9%) and Hispanic (8.1%) than white (5.0%) students and higher among black female (10.4%) and Hispanic female (11.1%) than white female (6.5%) students. Overall, the prevalence of having attempted suicide was higher among 9th-grade (7.3%), 10th-grade (6.9%), and 11th-grade (6.3%) than 12th-grade (4.2%) students; higher among 9th-grade female (10.3%) than 11th-grade female (7.8%) and 12th-grade female (4.6%) students; and higher among 10th-grade female (8.8%) and 11th-grade female (7.8%) than 12th-grade female (4.6%) students. Prevalence of having attempted suicide ranged from 4.3% to 12.8% across state surveys (median: 7.9%) and from 6.0% to 14.3% across local surveys (median: 9.6%) (Table 25).
Suicide Attempt Treated by a Doctor or Nurse
During the 12 months before the survey, 1.9% of students nationwide had made a suicide attempt that resulted in an injury, poisoning, or an overdose that had to be treated by a doctor or nurse (Table 24). Overall, the prevalence of having made a suicide attempt that resulted in an injury, poisoning, or an overdose that had to be treated by a doctor or nurse was higher among female (2.3%) than male (1.6%) students; higher among white female (2.0%) than white male (1.2%) students; and higher among 9th-grade female (2.8%) than 9th-grade male (1.4%) students. Overall, the prevalence of having made a suicide attempt that resulted in an injury, poisoning, or an overdose that had to be treated by a doctor or nurse was higher among 9th-grade (2.1%), 10th-grade (2.2%), and 11th-grade (2.1%) than 12th-grade (1.2%) students and higher among 9th-grade female (2.8%), 10th-grade female (2.3%), and 11th-grade female (2.6%) than 12th-grade female (1.0%) students. Prevalence of having made a suicide attempt that resulted in an injury, poisoning, or an overdose that had to be treated by a doctor or nurse ranged from 1.6% to 4.9% across state surveys (median: 2.8%) and from 1.6% to 5.9% across local surveys (median: 3.4%) (Table 25).
Tobacco Use
Ever Smoked Cigarettes
Nationwide, 46.3% of students had ever tried cigarette smoking (even one or two puffs) (i.e., ever smoked cigarettes) (Table 26). The prevalence of having ever smoked cigarettes was higher among Hispanic male (54.5%) than Hispanic female (47.6%) students. Overall, the prevalence of having ever smoked cigarettes was higher among Hispanic (51.0%) than black (43.5%) students and higher among Hispanic male (54.5%) than white male (45.2%) and black male (43.5%) students. Overall, the prevalence of having ever smoked cigarettes was higher among 10th-grade (44.0%), 11th-grade (50.0%), and 12th-grade (55.5%) than 9th-grade (37.7%) students; higher among 11th-grade (50.0%) and 12th-grade (55.5%) than 10th-grade (44.0%) students; higher among 12th-grade (55.5%) than 11th-grade (50.0%) students; higher among 10th-grade female (44.0%), 11th-grade female (50.0%), and 12th-grade female (54.8%) than 9th-grade female (37.4%) students; higher among 11th-grade female (50.0%) and 12th-grade female (54.8%) than 10th-grade female (44.0%) students; higher among 12th-grade female (54.8%) than 11th-grade female (50.0%) students; higher among 10th-grade male (44.0%), 11th-grade male (50.0%), and 12th-grade male (56.1%) than 9th-grade male (37.9%) students; and higher among 11th-grade male (50.0%) and 12th-grade male (56.1%) than 10th-grade male (44.0%) students. Prevalence of having ever smoked cigarettes ranged from 23.5% to 59.0% across state surveys (median: 48.8%) and from 35.0% to 51.0% across local surveys (median: 42.9%) (Table 27).
Ever Smoked Cigarettes Daily
Nationwide, 11.2% of students had ever smoked at least one cigarette every day for 30 days (i.e., ever smoked cigarettes daily) (Table 26). The prevalence of having ever smoked cigarettes daily was higher among black male (5.4%) than black female (3.1%) students. Overall, the prevalence of having ever smoked cigarettes daily was higher among white (13.7%) than black (4.3%) and Hispanic (8.6%) students; higher among Hispanic (8.6%) than black (4.3%) students; higher among white female (13.8%) than black female (3.1%) and Hispanic female (7.7%) students; higher among Hispanic female (7.7%) than black female (3.1%) students; higher among white male (13.7%) than black male (5.4%) and Hispanic male (9.4%) students; and higher among Hispanic male (9.4%) than black male (5.4%) students. Overall, the prevalence of having ever smoked cigarettes daily was higher among 11th-grade (13.0%) and 12th-grade (16.3%) than 9th-grade (7.7%) and 10th-grade (8.9%) students; higher among 12th-grade (16.3%) than 11th-grade (13.0%) students; higher among 11th-grade female (11.7%) and 12th-grade female (15.5%) than 9th-grade female (7.7%) and 10th-grade female (8.3%) students; higher among 12th-grade female (15.5%) than 11th-grade female (11.7%) students; higher among 11th-grade male (14.2%) and 12th-grade male (17.1%) than 9th-grade male (7.8%) and 10th-grade male (9.3%) students; and higher among 12th-grade male (17.1%) than 11th-grade male (14.2%) students. Prevalence of having ever smoked cigarettes daily ranged from 5.0% to 20.0% across state surveys (median: 11.5%) and from 3.3% to 9.3% across local surveys (median: 5.9%) (Table 27).
Current Cigarette Use
Nationwide, 19.5% of students had smoked cigarettes on at least 1 day during the 30 days before the survey (i.e., current cigarette use) (Table 28). The prevalence of current cigarette use was higher among 9th-grade female (15.2%) than 9th-grade male (12.1%) students and higher among 12th-grade male (28.1%) than 12th-grade female (22.4%) students. Overall, the prevalence of current cigarette use was higher among white (22.5%) than black (9.5%) and Hispanic (18.0%) students; higher among Hispanic (18.0%) than black (9.5%) students; higher among white female (22.8%) than black female (8.4%) and Hispanic female (16.7%) students; higher among Hispanic female (16.7%) than black female (8.4%) students; and higher among white male (22.3%) and Hispanic male (19.4%) than black male (10.7%) students. Overall, the prevalence of current cigarette use was higher among 10th-grade (18.3%), 11th-grade (22.3%), and 12th-grade (25.2%) than 9th-grade (13.5%) students; higher among 11th-grade (22.3%) and 12th-grade (25.2%) than 10th-grade (18.3%) students; higher among 12th-grade (25.2%) than 11th-grade (22.3%) students; higher among 10th-grade female (18.7%), 11th-grade female (20.6%), and 12th-grade female (22.4%) than 9th-grade female (15.2%) students; higher among 12th-grade female (22.4%) than 10th-grade female (18.7%) students; higher among 10th-grade male (17.8%), 11th-grade male (23.9%), and 12th-grade male (28.1%) than 9th-grade male (12.1%) students; and higher among 11th-grade male (23.9%) and 12th-grade male (28.1%) than 10th-grade male (17.8%) students. Prevalence of current cigarette use ranged from 8.5% to 26.1% across state surveys (median: 18.2%) and from 5.9% to 15.4% across local surveys (median: 11.5%) (Table 29).
Current Frequent Cigarette Use
Nationwide, 7.3% of students had smoked cigarettes on 20 or more days during the 30 days before the survey (i.e., current frequent cigarette use) (Table 28). Overall, the prevalence of current frequent cigarette use was higher among male (8.0%) than female (6.4%) students; higher among black male (2.9%) and Hispanic male (5.2%) than black female (1.4%) and Hispanic female (3.2%) students, respectively; and higher among 11th-grade male (9.5%) and 12th-grade male (13.5%) than 11th-grade female (7.1%) and 12th-grade female (8.9%) students, respectively. Overall, the prevalence of current frequent cigarette use was higher among white (9.5%) than black (2.1%) and Hispanic (4.2%) students; higher among Hispanic (4.2%) than black (2.1%) students; higher among white female (9.0%) than black female (1.4%) and Hispanic female (3.2%) students; higher among Hispanic female (3.2%) than black female (1.4%) students; higher among white male (10.0%) than black male (2.9%) and Hispanic male (5.2%) students; and higher among Hispanic male (5.2%) than black male (2.9%) students. Overall, the prevalence of current frequent cigarette use was higher among 11th-grade (8.3%) and 12th-grade (11.2%) than 9th-grade (4.7%) and 10th-grade (5.7%) students; higher among 12th-grade (11.2%) than 11th-grade (8.3%) students; higher among 11th-grade female (7.1%) and 12th-grade female (8.9%) than 9th-grade female (4.4%) students; higher among 12th-grade female (8.9%) than 10th-grade female (5.6%) students; higher among 11th-grade male (9.5%) and 12th-grade male (13.5%) than 9th-grade male (4.9%) and 10th-grade male (5.8%) students; and higher among 12th-grade male (13.5%) than 11th-grade male (9.5%) students. Prevalence of current frequent cigarette use ranged from 2.6% to 12.0% across state surveys (median: 7.4%) and from 1.5% to 6.4% across local surveys (median: 3.4%) (Table 29).
Smoked More than 10 Cigarettes per Day
Among the 19.5% of students nationwide who currently smoked cigarettes, 7.8% of students had smoked more than 10 cigarettes per day on the days they smoked during the 30 days before the survey (Table 30). Overall, the prevalence of having smoked more than 10 cigarettes per day was higher among male (11.1%) than female (4.1%) students; higher among white male (11.0%) than white female (4.3%) students; and higher among 9th-grade male (12.4%), 10th-grade male (9.7%), 11th-grade male (11.7%), and 12th-grade male (10.8%) than 9th-grade female (3.7%), 10th-grade female (2.7%), 11th-grade female (3.9%), and 12th-grade female (5.4%) students, respectively. The prevalence of having smoked more than 10 cigarettes per day was higher among white female (4.3%) than black female (1.3%) students. The prevalence of having smoked more than 10 cigarettes per day ranged from 4.0% to 17.6% across state surveys (median: 9.5%) and from 1.6% to 15.2% across local surveys (median: 7.9%) (Table 31).
Tried to Quit Smoking Cigarettes
Among the 19.5% of students nationwide who currently smoked cigarettes, 50.8% had tried to quit smoking cigarettes during the 12 months before the survey (Table 30). Overall, the prevalence of having tried to quit smoking cigarettes was higher among female (54.2%) than male (48.0%) students and higher among 9th-grade female (53.5%) and 11th-grade female (51.6%) than 9th-grade male (43.6%) and 11th-grade male (42.1%) students, respectively. The prevalence of having tried to quit smoking cigarettes was higher among white male (47.0%) and Hispanic male (52.2%) than black male (36.5%) students. Overall, the prevalence of having tried to quit smoking cigarettes was higher among 10th-grade (54.0%) and 12th-grade (54.0%) than 11th-grade (46.5%) students and higher among 12th-grade male (53.6%) than 11th-grade male (42.1%) students. The prevalence of having tried to quit smoking cigarettes ranged from 38.8% to 67.4% across state surveys (median: 53.2%) and from 36.9% to 65.0% across local surveys (median: 51.5%) (Table 31).
Bought Cigarettes in a Store or Gas Station
Among the 15.7% of students nationwide who currently smoked cigarettes and were aged <18 years, 14.1% usually obtained their own cigarettes by buying them in a store (i.e., convenience store, supermarket, or discount store) or gas station during the 30 days before the survey (Table 32). Overall, the prevalence of having bought their own cigarettes in a store or gas station was higher among male (18.3%) than female (9.6%) students; higher among white male (19.0%) than white female (8.8%) students; and higher among 9th-grade male (11.0%), 10th-grade male (16.8%), 11th-grade male (18.8%), and 12th-grade male (32.7%) than 9th-grade female (3.5%), 10th-grade female (9.8%), 11th-grade female (12.0%), and 12th-grade female (14.9%) students, respectively. Overall, the prevalence of having bought their own cigarettes in a store or gas station was higher among 10th-grade (13.4%), 11th-grade (15.8%), and 12th-grade (23.8%) than 9th-grade (7.1%) students; higher among 12th-grade (23.8%) than 10th-grade (13.4%) and 11th-grade (15.8%) students; higher among 10th-grade female (9.8%), 11th-grade female (12.0%), and 12th-grade female (14.9%) than 9th-grade female (3.5%) students; higher among 10th-grade male (16.8%), 11th-grade male (18.8%), and 12th-grade male (32.7%) than 9th-grade male (11.0%) students; and higher among 12th-grade male (32.7%) than 10th-grade male (16.8%) and 11th-grade male (18.8%) students. Prevalence of having bought their own cigarettes in a store or gas station ranged 4.5% to 26.1% across state surveys (median: 14.5%) and from 10.9% to 34.5% across local surveys (median: 16.8%) (Table 33).
Current Smokeless Tobacco Use
Nationwide, 8.9% of students had used smokeless tobacco (e.g., chewing tobacco, snuff, or dip) on at least 1 day during the 30 days before the survey (i.e., current smokeless tobacco use) (Table 32). Overall, the prevalence of current smokeless tobacco use was higher among male (15.0%) than female (2.2%) students; higher among white male (20.1%), black male (5.2%), and Hispanic male (7.5%) than white female (2.3%), black female (1.3%), and Hispanic female (2.6%) students, respectively; and higher among 9th-grade male (10.7%), 10th-grade male (13.9%), 11th-grade male (18.9%), and 12th-grade male (18.1%) than 9th-grade female (3.2%), 10th-grade female (1.8%), 11th-grade female (2.0%), and 12th-grade female (1.7%) students, respectively. Overall, the prevalence of current smokeless tobacco use was higher among white (11.9%) than black (3.3%) and Hispanic (5.1%) students; higher among Hispanic (5.1%) than black (3.3%) students; higher among Hispanic female (2.6%) than black female (1.3%) students; and higher among white male (20.1%) than black male (5.2%) and Hispanic male (7.5%) students. Overall, the prevalence of current smokeless tobacco use was higher among 11th-grade (10.7%) and 12th-grade (10.0%) than 9th-grade (7.2%) students; higher among 11th-grade (10.7%) than 10th-grade (8.1%) students; higher among 9th-grade female (3.2%) than 12th-grade female (1.7%) students; higher among 10th-grade male (13.9%), 11th-grade male (18.9%), and 12th-grade male (18.1%) than 9th-grade male (10.7%) students; and higher among 11th-grade male (18.9%) and 12th-grade male (18.1%) than 10th-grade male (13.9%) students. Prevalence of current smokeless tobacco use ranged from 4.9% to 16.2% across state surveys (median: 9.1%) and from 2.4% to 9.2% across local surveys (median: 3.8%) (Table 33).
Current Cigar Use
Nationwide, 14.0% of students had smoked cigars, cigarillos, or little cigars on at least 1 day during the 30 days before the survey (i.e., current cigar use) (Table 34). Overall, the prevalence of current cigar use was higher among male (18.6%) than female (8.8%) students; higher among white male (21.0%) and Hispanic male (15.8%) than white female (8.0%) and Hispanic female (9.5%) students, respectively; and higher among 9th-grade male (11.3%), 10th-grade male (16.6%), 11th-grade male (22.4%), and 12th-grade male (26.8%) than 9th-grade female (7.6%), 10th-grade female (9.5%), 11th-grade female (8.6%), and 12th-grade female (9.7%) students, respectively. The prevalence of current cigar use was higher among black female (11.5%) than white female (8.0%) students; and higher among white male (21.0%) than black male (13.9%) and Hispanic male (15.8%) students. Overall, the prevalence of current cigar use was higher among 10th-grade (13.2%), 11th-grade (15.8%), and 12th-grade (18.5%) than 9th-grade (9.6%) students; higher among 12th-grade (18.5%) than 10th-grade (13.2%) and 11th-grade (15.8%) students; higher among 10th-grade male (16.6%), 11th-grade male (22.4%), and 12th-grade male (26.8%) than 9th-grade male (11.3%) students; and higher among 11th-grade male (22.4%) and 12th-grade male (26.8%) than 10th-grade male (16.6%) students. Prevalence of current cigar use ranged from 6.8% to 18.1% across state surveys (median: 14.4%) and from 5.9% to 17.0% across local surveys (median: 10.6%) (Table 35).
Current Tobacco Use
Nationwide, 26.0% of students had reported current cigarette use, current smokeless tobacco use, or current cigar use (i.e., current tobacco use) (Table 34). Overall, the prevalence of current tobacco use was higher among male (29.8%) than female (21.8%) students; higher among white male (35.1%) and Hispanic male (23.6%) than white female (24.9%) and Hispanic female (18.1%) students, respectively; and higher among 10th-grade male (26.8%), 11th-grade male (35.4%), and 12th-grade male (40.4%) than 10th-grade female (21.9%), 11th-grade female (22.9%), and 12th-grade female (25.7%) students, respectively. Overall, the prevalence of current tobacco use was higher among white (30.3%) than black (16.2%) and Hispanic (20.8%) students; higher among Hispanic (20.8%) than black (16.2%) students; higher among white female (24.9%) than black female (14.5%) and Hispanic female (18.1%) students; higher among white male (35.1%) than black male (17.8%) and Hispanic male (23.6%) students; and higher among Hispanic male (23.6%) than black male (17.8%) students. Overall, the prevalence of current tobacco use was higher among 10th-grade (24.5%), 11th-grade (29.3%), and 12th-grade (33.1%) than 9th-grade (19.0%) students; higher among 11th-grade (29.3%) and 12th-grade (33.1%) than 10th-grade (24.5%) students; higher among 12th-grade (33.1%) than 11th-grade (29.3%) students; higher among 10th-grade female (21.9%), 11th-grade female (22.9%), and 12th-grade female (25.7%) than 9th-grade female (17.6%) students; higher among 12th-grade female (25.7%) than 10th-grade female (21.9%) students; higher among 10th-grade male (26.8%), 11th-grade male (35.4%), and 12th-grade male (40.4%) than 9th-grade male (20.2%) students; higher among 11th-grade male (35.4%) and 12th-grade male (40.4%) than 10th-grade male (26.8%) students; and higher among 12th-grade male (40.4%) than 11th-grade male (35.4%) students. Prevalence of current tobacco use ranged from 10.7% to 33.5% across state surveys (median: 25.3%) and from 10.2% to 21.8% across local surveys (median: 15.5%) (Table 35).
Alcohol and Other Drug Use
Ever Drank Alcohol
Nationwide, 72.5% of students had had at least one drink of alcohol on at least 1 day during their life (i.e., ever drank alcohol) (Table 36). Overall, the prevalence of having ever drunk alcohol was higher among female (74.2%) than male (70.8%) students; higher among white female (75.6%), black female (70.2%), and Hispanic female (78.5%) than white male (72.2%), black male (64.9%), and Hispanic male (74.8%) students, respectively; and higher among 9th-grade female (66.4%) than 9th-grade male (60.8%) students. Overall, the prevalence of having ever drunk alcohol was higher among white (73.8%) and Hispanic (76.6%) than black (67.6%) students; higher among white female (75.6%) and Hispanic female (78.5%) than black female (70.2%) students; and higher among white male (72.2%) and Hispanic male (74.8%) than black male (64.9%) students. Overall, the prevalence of having ever drunk alcohol was higher among 10th-grade (71.1%), 11th-grade (77.8%), and 12th-grade (79.7%) than 9th-grade (63.4%) students; higher among 11th-grade (77.8%) and 12th-grade (79.7%) than 10th-grade (71.1%) students; higher among 10th-grade female (72.5%), 11th-grade female (79.0%), and 12th-grade female (80.3%) than 9th-grade female (66.4%) students; higher among 11th-grade female (79.0%) and 12th-grade female (80.3%) than 10th-grade female (72.5%) students; higher among 10th-grade male (69.9%), 11th-grade male (76.5%), and 12th-grade male (79.0%) than 9th-grade male (60.8%) students; and higher among 11th-grade male (76.5%) and 12th-grade male (79.0%) than 10th-grade male (69.9%) students. Prevalence of having ever drunk alcohol ranged from 38.6% to 76.2% across state surveys (median: 70.3%) and from 54.5% to 73.1% across local surveys (median: 68.2%) (Table 37).
Current Alcohol Use
Nationwide, 41.8% of students had had at least one drink of alcohol on at least 1 day during the 30 days before the survey (i.e., current alcohol use) (Table 36). The prevalence of current alcohol use was higher among 9th-grade female (35.3%) than 9th-grade male (28.4%) students. Overall, the prevalence of current alcohol use was higher among white (44.7%) and Hispanic (42.9%) than black (33.4%) students; higher among white female (45.9%) and Hispanic female (43.5%) than black female (35.6%) students; and higher among white male (43.6%) and Hispanic male (42.4%) than black male (31.2%) students. Overall, the prevalence of current alcohol use was higher among 10th-grade (40.6%), 11th-grade (45.7%), and 12th-grade (51.7%) than 9th-grade (31.5%) students; higher among 12th-grade (51.7%) than 10th-grade (40.6%) and 11th-grade (45.7%) students; higher among 10th-grade female (41.2%), 11th-grade female (45.6%), and 12th-grade female (50.7%) than 9th-grade female (35.3%) students; higher among 12th-grade female (50.7%) than 10th-grade female (41.2%) and 11th-grade female (45.6%) students; higher among 10th-grade male (40.1%), 11th-grade male (45.7%), and 12th-grade male (52.6%) than 9th-grade male (28.4%) students; and higher among 12th-grade male (52.6%) than 10th-grade male (40.1%) and 11th-grade male (45.7%) students. Prevalence of current alcohol use ranged from 18.2% to 47.5% across state surveys (median: 39.3%) and from 23.6% to 44.2% across local surveys (median: 36.4%) (Table 37).
Binge Drinking
Nationwide, 24.2% of students had had five or more drinks of alcohol in a row (i.e., within a couple of hours) on at least 1 day during the 30 days before the survey (i.e., binge drinking) (Table 38). The prevalence of binge drinking was higher among 11th-grade male (30.0%) and 12th-grade male (36.6%) than 11th-grade female (26.4%) and 12th-grade female (30.4%) students, respectively. Overall, the prevalence of binge drinking was higher among white (27.8%) than black (13.7%) and Hispanic (24.1%) students; higher among Hispanic (24.1%) than black (13.7%) students; higher among white female (27.5%) than black female (12.1%) and Hispanic female (23.3%) students; higher among Hispanic female (23.3%) than black female (12.1%) students; and higher among white male (28.0%) and Hispanic male (25.1%) than black male (15.3%) students. Overall, the prevalence of binge drinking was higher among 10th-grade (22.3%), 11th-grade (28.3%), and 12th-grade (33.5%) than 9th-grade (15.3%) students; higher among 11th-grade (28.3%) and 12th-grade (33.5%) than 10th-grade (22.3%) students; higher among 12th-grade (33.5%) than 11th-grade (28.3%) students; higher among 10th-grade female (21.1%), 11th-grade female (26.4%), and 12th-grade female (30.4%) than 9th-grade female (17.2%) students; higher among 11th-grade female (26.4%) and 12th-grade female (30.4%) than 10th-grade female (21.1%) students; higher among 12th-grade female (30.4%) than 11th-grade female (26.4%) students; higher among 10th-grade male (23.3%), 11th-grade male (30.0%), and 12th-grade male (36.6%) than 9th-grade male (13.6%) students; higher among 11th-grade male (30.0%) and 12th-grade male (36.6%) than 10th-grade male (23.3%) students; and higher among 12th-grade male (36.6%) than 11th-grade male (30.0%) students. Prevalence of binge drinking ranged from 11.5% to 30.7% across state surveys (median: 24.0%) and from 7.4% to 23.9% across local surveys (median: 18.5%) (Table 39).
Someone Gave Alcohol to Them
Among the 41.8% of students nationwide who currently drank alcohol, 42.2% usually obtained the alcohol they drank by someone giving it to them during the 30 days before the survey (Table 38). Overall, the prevalence of someone giving alcohol to them was higher among female (49.8%) than male (35.0%) students; higher among white female (47.9%), black female (52.2%), and Hispanic female (53.4%) than white male (34.2%), black male (37.9%), and Hispanic male (35.3%) students, respectively; and higher among 9th-grade female (53.2%), 10th-grade female (48.2%), 11th-grade female (47.9%), and 12th-grade female (50.3%) than 9th-grade male (39.6%), 10th-grade male (35.5%), 11th-grade male (34.9%), and 12th-grade male (31.5%) students, respectively. Overall, the prevalence of someone giving alcohol to them was higher among 9th-grade (46.5%) than 11th-grade (41.3%) and 12th-grade (40.6%) students and higher among 9th-grade male (39.6%) than 12th-grade male (31.5%) students. Prevalence of having someone giving alcohol to them ranged from 31.1% to 47.2% across state surveys (median: 38.6%) and from 33.2% to 49.2% across local surveys (median: 38.1%) (Table 39).
Ever Used Marijuana
Nationwide, 36.8% of students had used marijuana one or more times during their life (i.e., ever used marijuana) (Table 40). Overall, the prevalence of having ever used marijuana was higher among male (39.0%) than female (34.3%) students; higher among white male (37.4%), black male (44.3%), and Hispanic male (44.2%) than white female (33.7%), black female (38.0%), and Hispanic female (35.6%) students, respectively; and higher among 11th-grade male (44.3%) and 12th-grade male (50.9%) than 11th-grade female (39.5%) and 12th-grade female (40.2%) students, respectively. Overall, the prevalence of having ever used marijuana was higher among black (41.2%) and Hispanic (39.9%) than white (35.7%) students and higher among black male (44.3%) and Hispanic male (44.2%) than white male (37.4%) students. Overall, the prevalence of having ever used marijuana was higher among 10th-grade (35.5%), 11th-grade (42.0%), and 12th-grade (45.6%) than 9th-grade (26.4%) students; higher among 11th-grade (42.0%) and 12th-grade (45.6%) than 10th-grade (35.5%) students; higher among 12th-grade (45.6%) than 11th-grade (42.0%) students; higher among 10th-grade female (33.0%), 11th-grade female (39.5%), and 12th-grade female (40.2%) than 9th-grade female (25.7%) students; higher among 11th-grade female (39.5%) and 12th-grade female (40.2%) than 10th-grade female (33.0%) students; higher among 10th-grade male (37.7%), 11th-grade male (44.3%), and 12th-grade male (50.9%) than 9th-grade male (26.9%) students; higher among 11th-grade male (44.3%) and 12th-grade male (50.9%) than 10th-grade male (37.7%) students; and higher among 12th-grade male (50.9%) than 11th-grade male (44.3%) students. Prevalence of having ever used marijuana ranged from 20.6% to 44.5% across state surveys (median: 36.5%) and from 26.5% to 51.9% across local surveys (median: 37.6%) (Table 41).
Current Marijuana Use
Nationwide, 20.8% of students had used marijuana one or more times during the 30 days before the survey (i.e., current marijuana use) (Table 40). Overall, the prevalence of current marijuana use was higher among male (23.4%) than female (17.9%) students; higher among white male (23.0%), black male (25.6%), and Hispanic male (25.0%) than white female (17.9%), black female (18.7%), and Hispanic female (18.2%) students, respectively; and higher among 10th-grade male (23.9%), 11th-grade male (26.7%), and 12th-grade male (29.9%) than 10th-grade female (17.9%), 11th-grade female (19.5%), and 12th-grade female (19.1%) students, respectively. Overall, the prevalence of current marijuana use was higher among 10th-grade (21.1%), 11th-grade (23.2%), and 12th-grade (24.6%) than 9th-grade (15.5%) students; higher among 12th-grade female (19.1%) than 9th-grade female (15.5%) students; and higher among 10th-grade male (23.9%), 11th-grade male (26.7%), and 12th-grade male (29.9%) than 9th-grade male (15.5%) students. Prevalence of current marijuana use ranged from 10.0% to 28.0% across state surveys (median: 20.3%) and from 15.0% to 28.5% across local surveys (median: 21.1%) (Table 41).
Ever Used Cocaine
Nationwide, 6.4% of students had used any form of cocaine (e.g., powder, crack,§ or freebase¶) one or more times during their life (i.e., ever used cocaine) (Table 42). Overall, the prevalence of having ever used cocaine was higher among male (7.3%) than female (5.3%) students; higher among black male (4.3%) than black female (1.5%) students; and higher among 11th-grade male (9.4%) and 12th-grade male (9.7%) than 11th-grade female (6.1%) and 12th-grade female (6.0%) students, respectively. Overall, the prevalence of having ever used cocaine was higher among white (6.3%) than black (2.9%) students; higher among Hispanic (9.4%) than white (6.3%) and black (2.9%) students; higher among white female (5.4%) than black female (1.5%) students; higher among Hispanic female (8.7%) than white female (5.4%) and black female (1.5%) students; higher among white male (7.1%) than black male (4.3%) students; and higher among Hispanic male (10.1%) than white male (7.1%) and black male (4.3%) students. Overall, the prevalence of having ever used cocaine was higher among 11th-grade (7.7%) and 12th-grade (7.9%) than 9th-grade (4.5%) and 10th-grade (5.6%) students; higher among 10th-grade male (6.4%), 11th-grade male (9.4%), and 12th-grade male (9.7%) than 9th-grade male (4.4%) students; and higher among 11th-grade male (9.4%) and 12th-grade male (9.7%) than 10th-grade male (6.4%) students. Prevalence of having ever used cocaine ranged from 3.8% to 12.8% across state surveys (median: 6.3%) and from 2.1% to 10.0% across local surveys (median: 6.0%) (Table 43).
Current Cocaine Use
Nationwide, 2.8% of students had used any form of cocaine (e.g., powder, crack, or freebase) one or more times during the 30 days before the survey (i.e., current cocaine use) (Table 42). Overall, the prevalence of current cocaine use was higher among male (3.5%) than female (2.0%) students; higher among white male (3.0%) and black male (3.0%) than white female (1.7%) and black female (0.9%) students, respectively; and higher among 10th-grade male (3.2%), 11th-grade male (4.8%), and 12th-grade male (3.9%) than 10th-grade female (1.8%), 11th-grade female (1.7%), and 12th-grade female (2.0%) students, respectively. Overall, the prevalence of current cocaine use was higher among Hispanic (4.3%) than white (2.4%) and black (1.9%) students; higher among Hispanic female (3.7%) than white female (1.7%) and black female (0.9%) students; and higher among Hispanic male (4.9%) than white male (3.0%) students. Overall, the prevalence of current cocaine use was higher among 11th-grade (3.3%) than 9th-grade (2.3%) students; higher among 11th-grade male (4.8%) and 12th-grade male (3.9%) than 9th-grade male (2.4%) students; and higher among 11th-grade male (4.8%) than 10th-grade male (3.2%) students. Prevalence of current cocaine use ranged from 1.7% to 5.6% across state surveys (median: 2.8%) and from 0.9% to 4.4% across local surveys (median: 3.1%) (Table 43).
Ever Used Inhalants
Nationwide, 11.7% of students had sniffed glue, breathed the contents of aerosol spray cans, or inhaled any paints or sprays to get high one or more times during their life (i.e., ever used inhalants) (Table 44). Overall, the prevalence of having ever used inhalants was higher among female (12.9%) than male (10.6%) students and higher among 9th-grade female (16.7%) than 9th-grade male (9.7%) students. Overall, the prevalence of having ever used inhalants was higher among white (11.5%) than black (8.2%) students; higher among Hispanic (14.0%) than white (11.5%) and black (8.2%) students; higher among Hispanic female (15.3%) than black female (9.4%) students; and higher among white male (10.4%) and Hispanic male (12.8%) than black male (7.1%) students. Overall, the prevalence of having ever used inhalants was higher among 9th-grade (13.0%), 10th-grade (12.5%), and 11th-grade (11.5%) than 12th-grade (9.1%) students; higher among 9th-grade female (16.7%) than 10th-grade female (13.1%), 11th-grade female (11.5%), and 12th-grade female (9.3%) students; higher among 10th-grade female (13.1%) and 11th-grade female (11.5%) than 12th-grade female (9.3%) students; and higher among 10th-grade male (12.0%) and 11th-grade male (11.6%) than 12th-grade male (8.9%) students. Prevalence of having ever used inhalants ranged from 8.7% to 16.8% across state surveys (median: 11.6%) and from 6.0% to 18.9% across local surveys (median: 9.9%) (Table 45).
Ever Used Ecstasy
Nationwide, 6.7% of students had used ecstasy (also called "MDMA") one or more times during their life (i.e., ever used ecstasy) (Table 44). Overall, the prevalence of having ever used ecstasy was higher among male (7.6%) than female (5.5%) students; higher among white male (7.4%) and black male (6.5%) than white female (5.3%) and black female (3.8%) students, respectively; and higher among 11th-grade male (10.3%) and 12th-grade male (9.9%) than 11th-grade female (6.9%) and 12th-grade female (6.0%) students, respectively. Overall, the prevalence of having ever used ecstasy was higher among Hispanic (8.2%) than white (6.4%) and black (5.1%) students and higher among Hispanic female (7.5%) than white female (5.3%) and black female (3.8%) students. Overall, the prevalence of having ever used ecstasy was higher among 11th-grade (8.7%) and 12th-grade (8.0%) than 9th-grade (4.9%) and 10th-grade (5.2%) students; higher among 11th-grade female (6.9%) than 9th-grade female (4.6%) and 10th-grade female (4.6%) students; and higher among 11th-grade male (10.3%) and 12th-grade male (9.9%) than 9th-grade male (5.2%) and 10th-grade male (5.7%) students. Prevalence of having ever used ecstasy ranged from 4.9% to 14.1% across state surveys (median: 6.8%) and from 3.0% to 12.6% across local surveys (median: 8.0%) (Table 45).
Ever Used Heroin
Nationwide, 2.5% of students had used heroin (also called "smack," "junk," or "China White") one or more times during their life (i.e., ever used heroin) (Table 46). Overall, the prevalence of having ever used heroin was higher among male (3.2%) than female (1.7%) students; higher among white male (2.7%) and black male (3.6%) than white female (1.6%) and black female (0.7%) students, respectively; and higher among 9th-grade male (2.7%), 10th-grade male (2.8%), 11th-grade male (4.1%), and 12th-grade male (3.3%) than 9th-grade female (1.4%), 10th-grade female (1.5%), 11th-grade female (2.2%), and 12th-grade female (1.6%) students, respectively. Overall, the prevalence of having ever used heroin was higher among Hispanic (3.3%) than white (2.2%) students and higher among Hispanic female (2.9%) than black female (0.7%) students. Overall, the prevalence of having ever used heroin was higher among 11th-grade (3.2%) than 9th-grade (2.1%) and 10th-grade (2.2%) students. Prevalence of having ever used heroin ranged from 1.9% to 6.4% across state surveys (median: 3.0%) and from 1.7% to 11.1% across local surveys (median: 3.4%) (Table 47).
Ever Used Methamphetamines
Nationwide, 4.1% of students had used methamphetamines (also called "speed," "crystal," "crank," or "ice") one or more times during their life (i.e., ever used methamphetamines) (Table 46). Overall, the prevalence of having ever used methamphetamines was higher among male (4.7%) than female (3.3%) students; higher among black male (4.5%) than black female (1.0%) students; and higher among 10th-grade male (4.5%) and 12th-grade male (5.4%) than 10th-grade female (2.8%) and 12th-grade female (2.7%) students, respectively. Overall, the prevalence of having ever used methamphetamines was higher among Hispanic (5.7%) than white (3.7%) and black (2.7%) students; higher among white female (3.2%) than black female (1.0%) students; and higher among Hispanic female (5.2%) than white female (3.2%) and black female (1.0%) students. Overall, the prevalence of having ever used methamphetamines was higher among 11th-grade (5.2%) than 9th-grade (3.3%), 10th-grade (3.7%), and 12th-grade (4.1%) students; higher among 11th-grade female (4.5%) than 12th-grade female (2.7%) students; and higher among 11th-grade male (5.9%) and 12th-grade male (5.4%) than 9th-grade male (3.3%) students. Prevalence of having ever used methamphetamines ranged from 2.3% to 7.9% across state surveys (median: 3.9%) and from 2.3% to 12.2% across local surveys (median: 4.1%) (Table 47).
Ever Took Steroids Without a Doctor's Prescription
Nationwide, 3.3% of students had taken steroid pills or shots without a doctor's prescription one or more times during their life (i.e., ever took steroids without a doctor's prescription) (Table 48). Overall, the prevalence of having ever taken steroids without a doctor's prescription was higher among male (4.3%) than female (2.2%) students; higher among white male (3.9%) and black male (4.6%) than white female (2.1%) and black female (0.9%) students, respectively; and higher among 9th-grade male (4.0%), 10th-grade male (4.3%), 11th-grade male (4.4%), and 12th-grade male (4.6%) than 9th-grade female (2.3%), 10th-grade female (2.3%), 11th-grade female (2.5%), and 12th-grade female (1.6%) students, respectively. The prevalence of having ever taken steroids without a doctor's prescription was higher among white female (2.1%) and Hispanic female (3.2%) than black female (0.9%) students. Prevalence of having ever taken steroids without a doctor's prescription ranged from 2.1% to 7.2% across state surveys (median: 3.6%) and from 2.3% to 7.3% across local surveys (median: 3.3%) (Table 49).
Ever Injected Any Illegal Drug
Nationwide, 2.1% of students had used a needle to inject any illegal drug into their body one or more times during their life (i.e., ever injected any illegal drug) (Table 48). Overall, the prevalence of having ever injected any illegal drug was higher among male (2.7%) than female (1.4%) students; higher among white male (2.1%) and black male (3.5%) than white female (1.1%) and black female (1.2%) students, respectively; and higher among 10th-grade male (2.7%), 11th-grade male (3.3%), and 12th-grade male (2.7%) than 10th-grade female (1.2%), 11th-grade female (1.6%), and 12th-grade female (0.9%) students, respectively. Overall, the prevalence of having ever injected any illegal drug was higher among Hispanic (3.1%) than white (1.6%) students and higher among Hispanic female (2.9%) than white female (1.1%) and black female (1.2%) students. Prevalence of having ever injected any illegal drug ranged from 1.7% to 5.4% across state surveys (median: 2.5%) and from 1.5% to 5.3% across local surveys (median: 2.8%) (Table 49).
Ever Used Hallucinogenic Drugs
Nationwide, 8.0% of students had used hallucinogenic drugs (e.g., LSD, acid, PCP, angel dust, mescaline, or mushrooms) one or more times during their life (i.e., ever used hallucinogenic drugs) (Table 50). Overall, the prevalence of having ever used hallucinogenic drugs was higher among male (10.2%) than female (5.5%) students; higher among white male (11.5%) and black male (5.1%) than white female (6.2%) and black female (1.4%) students, respectively; and higher among 10th-grade male (10.0%), 11th-grade male (10.7%), and 12th-grade male (14.2%) than 10th-grade female (4.5%), 11th-grade female (6.9%), and 12th-grade female (5.6%) students, respectively. Overall, the prevalence of having ever used hallucinogenic drugs was higher among white (9.0%) and Hispanic (7.9%) than black (3.3%) students; higher among white female (6.2%) and Hispanic female (6.6%) than black female (1.4%) students; and higher among white male (11.5%) and Hispanic male (9.2%) than black male (5.1%) students. Overall, the prevalence of having ever used hallucinogenic drugs was higher among 10th-grade (7.4%), 11th-grade (8.9%), and 12th-grade (10.0%) than 9th-grade (5.9%) students; higher among 10th-grade male (10.0%), 11th-grade male (10.7%), and 12th-grade male (14.2%) than 9th-grade male (6.6%) students; and higher among 12th-grade male (14.2%) than 10th-grade male (10.0%) and 11th-grade male (10.7%) students.
Ever Took Prescription Drugs Without a Doctor's Prescription
Nationwide, 20.2% of students had taken prescription drugs (e.g., Oxycontin, Percocet, Vicodin, Adderall, Ritalin, or Xanax) without a doctor's prescription one or more times during their life (i.e., ever took prescription drugs without a doctor's prescription) (Table 50). Overall, the prevalence of having ever taken prescription drugs without a doctor's prescription was higher among white (23.0%) than black (11.8%) and Hispanic (17.2%) students; higher among Hispanic (17.2%) than black (11.8%) students; higher among white female (23.3%) than black female (10.3%) and Hispanic female (16.6%) students; higher among Hispanic female (16.6%) than black female (10.3%) students; higher among white male (22.8%) than black male (13.3%) and Hispanic male (17.8%) students; and higher among Hispanic male (17.8%) than black male (13.3%) students. Overall, the prevalence of having ever taken prescription drugs without a doctor's prescription was higher among 10th-grade (18.2%), 11th-grade (22.7%), and 12th-grade (25.8%) than 9th-grade (15.1%) students; higher among 11th-grade (22.7%) and 12th-grade (25.8%) than 10th-grade (18.2%) students; higher among 12th-grade (25.8%) than 11th-grade (22.7%) students; higher among 11th-grade female (21.5%) and 12th-grade female (24.3%) than 9th-grade female (16.1%) students; higher among 12th-grade female (24.3%) than 10th-grade female (18.2%) students; higher among 10th-grade male (18.2%), 11th-grade male (23.9%), and 12th-grade male (27.2%) than 9th-grade male (14.3%) students; and higher among 11th-grade male (23.9%) and 12th-grade male (27.2%) than 10th-grade male (18.2%) students.
Age of Initiation of Risk Behaviors
Smoked a Whole Cigarette Before Age 13 Years
Nationwide, 10.7% of students had smoked a whole cigarette for the first time before age 13 years (Table 51). Overall, the prevalence of having smoked a whole cigarette before age 13 years was higher among male (11.8%) than female (9.4%) students; higher among black male (11.2%) and Hispanic male (14.7%) than black female (6.9%) and Hispanic female (10.5%) students, respectively; and higher among 10th-grade male (12.7%) than 10th-grade female (9.3%) students. Overall, the prevalence of having smoked a whole cigarette before age 13 years was higher among Hispanic (12.6%) than black (9.1%) students; higher among white female (9.8%) and Hispanic female (10.5%) than black female (6.9%) students; and higher among Hispanic male (14.7%) than white male (10.8%) and black male (11.2%) students. Overall, the prevalence of having smoked a whole cigarette before age 13 years was higher among 9th-grade (12.1%) than 11th-grade (10.3%) and 12th-grade (8.6%) students; higher among 10th-grade (11.2%) than 12th-grade (8.6%) students; higher among 9th-grade female (11.1%) than 11th-grade female (9.0%) and 12th-grade female (7.9%) students; and higher among 9th-grade male (13.0%), 10th-grade male (12.7%), and 11th-grade male (11.6%) than 12th-grade male (9.2%) students. Prevalence of having smoked a whole cigarette before age 13 years ranged from 5.9% to 19.3% across state surveys (median: 12.1%) and from 6.0% to 14.0% across local surveys (median: 9.5%) (Table 52).
Drank Alcohol Before Age 13 Years
Nationwide, 21.1% of students had drunk alcohol (other than a few sips) for the first time before age 13 years (Table 51). Overall, the prevalence of having drunk alcohol before age 13 years was higher among male (23.7%) than female (18.1%) students; higher among white male (20.3%), black male (27.6%), and Hispanic male (31.0%) than white female (15.5%), black female (21.9%), and Hispanic female (23.2%) students, respectively; and higher among 10th-grade male (25.4%), 11th-grade male (20.7%), and 12th-grade male (17.3%) than 10th-grade female (18.5%), 11th-grade female (14.9%), and 12th-grade female (10.9%) students, respectively. Overall, the prevalence of having drunk alcohol before age 13 years was higher among black (24.9%) and Hispanic (27.1%) than white (18.1%) students; higher among black female (21.9%) and Hispanic female (23.2%) than white female (15.5%) students; and higher among black male (27.6%) and Hispanic male (31.0%) than white male (20.3%) students. Overall, the prevalence of having drunk alcohol before age 13 years was higher among 9th-grade (28.1%) than 10th-grade (22.2%), 11th-grade (17.9%), and 12th-grade (14.2%) students; higher among 10th-grade (22.2%) than 11th-grade (17.9%) and 12th-grade (14.2%) students; higher among 11th-grade (17.9%) than 12th-grade (14.2%) students; higher among 9th-grade female (26.6%) than 10th-grade female (18.5%), 11th-grade female (14.9%), and 12th-grade female (10.9%) students; higher among 10th-grade female (18.5%) than 11th-grade female (14.9%) and 12th-grade female (10.9%) students; higher among 11th-grade female (14.9%) than 12th-grade female (10.9%) students; and higher among 9th-grade male (29.5%) than 10th-grade male (25.4%), 11th-grade male (20.7%), and 12th-grade male (17.3%) students; and higher among 10th-grade male (25.4%) and 11th-grade male (20.7%) than 12th-grade male (17.3%) students. Prevalence of having drunk alcohol before age 13 years ranged from 11.5% to 29.4% across state surveys (median: 20.5%) and from 17.0% to 29.2% across local surveys (median: 23.9%) (Table 52).
Tried Marijuana Before Age 13 Years
Nationwide, 7.5% of students had tried marijuana for the first time before age 13 years (Table 53). Overall, the prevalence of having tried marijuana before age 13 years was higher among male (9.7%) than female (5.0%) students; higher among white male (7.1%), black male (16.1%), and Hispanic male (12.9%) than white female (4.0%), black female (4.1%), and Hispanic female (7.8%) students, respectively; and higher among 9th-grade male (11.1%), 10th-grade male (10.6%), 11th-grade male (8.6%), and 12th-grade male (7.8%) than 9th-grade female (6.8%), 10th-grade female (5.6%), 11th-grade female (4.3%), and 12th-grade female (2.6%) students, respectively. Overall, the prevalence of having tried marijuana before age 13 years was higher among black (10.2%) and Hispanic (10.3%) than white (5.7%) students; higher among Hispanic female (7.8%) than white female (4.0%) and black female (4.1%) students; and higher among black male (16.1%) and Hispanic male (12.9%) than white male (7.1%) students. Overall, the prevalence of having tried marijuana before age 13 years was higher among 9th-grade (9.1%) and 10th-grade (8.3%) than 11th-grade (6.5%) and 12th-grade (5.2%) students; higher among 11th-grade (6.5%) than 12th-grade (5.2%) students; higher among 9th-grade female (6.8%) than 11th-grade female (4.3%) and 12th-grade female (2.6%) students; higher among 10th-grade female (5.6%) and 11th-grade female (4.3%) than 12th-grade female (2.6%) students; and higher among 9th-grade male (11.1%) than 11th-grade male (8.6%) and 12th-grade male (7.8%) students. Prevalence of having tried marijuana before age 13 years ranged from 4.1% to 18.4% across state surveys (median: 8.3%) and from 6.3% to 15.4% across local surveys (median: 9.2%) (Table 54).
Tobacco, Alcohol, and Other Drug Use on School Property
Smoked Cigarettes on School Property
Nationwide, 5.1% of students had smoked cigarettes on school property on at least 1 day during the 30 days before the survey (Table 55). Overall, the prevalence of having smoked cigarettes on school property was higher among male (6.2%) than female (4.0%) students; higher among white male (6.6%), black male (4.0%), and Hispanic male (5.9%) than white female (4.7%), black female (1.2%), and Hispanic female (3.7%) students, respectively; and higher among 9th-grade male (4.2%), 11th-grade male (7.1%), and 12th-grade male (8.4%) than 9th-grade female (3.0%), 11th-grade female (5.1%), and 12th-grade female (4.4%) students, respectively. Overall, the prevalence of having smoked cigarettes on school property was higher among white (5.8%) and Hispanic (4.8%) than black (2.6%) students; higher among white female (4.7%) and Hispanic female (3.7%) than black female (1.2%) students; and higher among white male (6.6%) than black male (4.0%) students. Overall, the prevalence of having smoked cigarettes on school property was higher among 11th-grade (6.2%) and 12th-grade (6.5%) than 9th-grade (3.7%) and 10th-grade (4.7%) students; higher among 11th-grade female (5.1%) than 9th-grade female (3.0%) and 10th-grade female (3.5%) students; higher among 11th-grade male (7.1%) and 12th-grade male (8.4%) than 9th-grade male (4.2%) students; and higher among 12th-grade male (8.4%) than 10th-grade male (5.6%) students. Prevalence of having smoked cigarettes on school property ranged from 2.4% to 9.4% across state surveys (median: 5.4%) and from 1.7% to 6.5% across local surveys (median: 4.0%) (Table 56).
Used Smokeless Tobacco on School Property
Nationwide, 5.5% of students had used smokeless tobacco (e.g., chewing tobacco, snuff, or dip) on school property on at least 1 day during the 30 days before the survey (Table 55). Overall, the prevalence of having used smokeless tobacco on school property was higher among male (9.4%) than female (1.1%) students; higher among white male (12.1%), black male (4.1%), and Hispanic male (5.3%) than white female (1.1%), black female (1.0%), and Hispanic female (1.2%) students, respectively; and higher among 9th-grade male (6.2%), 10th-grade male (8.8%), 11th-grade male (11.0%), and 12th-grade male (12.6%) than 9th-grade female (1.6%), 10th-grade female (0.9%), 11th-grade female (1.1%), and 12th-grade female (0.6%) students, respectively. Overall, the prevalence of having used smokeless tobacco on school property was higher among white (7.0%) than black (2.6%) and Hispanic (3.2%) students; and higher among white male (12.1%) than black male (4.1%) and Hispanic male (5.3%) students. Overall, the prevalence of having used smokeless tobacco on school property was higher among 11th-grade (6.2%) and 12th-grade (6.7%) than 9th-grade (4.1%) students; higher among 12th-grade (6.7%) than 10th-grade (5.1%) students; higher among 9th-grade female (1.6%) than 12th-grade female (0.6%) students; higher among 10th-grade male (8.8%), 11th-grade male (11.0%), and 12th-grade male (12.6%) than 9th-grade male (6.2%) students; and higher among 12th-grade male (12.6%) than 10th-grade male (8.8%) students. Prevalence of having used smokeless tobacco on school property ranged from 2.8% to 10.3% across state surveys (median: 5.5%) and from 1.0% to 4.1% across local surveys (median: 2.2%) (Table 56).
Drank Alcohol on School Property
Nationwide, 4.5% of students had drunk at least one drink of alcohol on school property on at least 1 day during the 30 days before the survey (Table 57). Overall, the prevalence of having drunk alcohol on school property was higher among male (5.3%) than female (3.6%) students; higher among white male (4.1%) than white female (2.3%) students; and higher among 10th-grade male (5.9%), 11th-grade male (5.7%), and 12th-grade male (5.4%) than 10th-grade female (3.5%), 11th-grade female (3.4%), and 12th-grade female (2.7%) students, respectively. Overall, the prevalence of having drunk alcohol on school property was higher among black (5.4%) and Hispanic (6.9%) than white (3.3%) students; higher among black female (4.8%) and Hispanic female (5.9%) than white female (2.3%) students; and higher among Hispanic male (7.9%) than white male (4.1%) students. The prevalence of having drunk alcohol on school property was higher among 9th-grade female (4.5%) than 11th-grade female (3.4%) and 12th-grade female (2.7%) students and higher among 11th-grade male (5.7%) than 9th-grade male (4.3%) students. Prevalence of having drunk alcohol on school property ranged from 2.7% to 8.0% across state surveys (median: 4.2%) and from 3.5% to 10.9% across local surveys (median: 5.5%) (Table 58).
Used Marijuana on School Property
Nationwide, 4.6% of students had used marijuana on school property one or more times during the 30 days before the survey (Table 57). Overall, the prevalence of having used marijuana on school property was higher among male (6.3%) than female (2.8%) students; higher among white male (5.1%), black male (8.3%), and Hispanic male (8.7%) than white female (2.3%), black female (2.9%), and Hispanic female (4.2%) students, respectively; and higher among 10th-grade male (6.4%), 11th-grade male (6.9%), and 12th-grade male (7.0%) than 10th-grade female (2.5%), 11th-grade female (3.0%), and 12th-grade female (2.1%) students, respectively. Overall, the prevalence of having used marijuana on school property was higher among black (5.6%) and Hispanic (6.5%) than white (3.8%) students; higher among Hispanic female (4.2%) than white female (2.3%) students; and higher among black male (8.3%) and Hispanic male (8.7%) than white male (5.1%) students. The prevalence of having used marijuana on school property was higher among 9th-grade female (3.4%) than 12th-grade female (2.1%) students and higher among 11th-grade male (6.9%) than 9th-grade male (5.2%) students. Prevalence of having used marijuana on school property ranged from 2.5% to 9.7% across state surveys (median: 4.6%) and from 4.4% to 10.8% across local surveys (median: 6.5%) (Table 58).
Offered, Sold, or Given an Illegal Drug on School Property
Nationwide, 22.7% of students had been offered, sold, or given an illegal drug by someone on school property during the 12 months before the survey (Table 59). Overall, the prevalence of having been offered, sold, or given an illegal drug on school property was higher among male (25.9%) than female (19.3%) students; higher among white male (22.7%), black male (25.7%), and Hispanic male (35.1%) than white female (16.5%), black female (18.8%), and Hispanic female (27.1%) students, respectively; and higher among 10th-grade male (27.3%), 11th-grade male (27.8%), and 12th-grade male (25.8%) than 10th-grade female (19.6%), 11th-grade female (20.5%), and 12th-grade female (15.4%) students, respectively. Overall, the prevalence of having been offered, sold, or given an illegal drug on school property was higher among Hispanic (31.2%) than white (19.8%) and black (22.2%) students; higher among Hispanic female (27.1%) than white female (16.5%) and black female (18.8%) students; and higher among Hispanic male (35.1%) than white male (22.7%) and black male (25.7%) students. Overall, the prevalence of having been offered, sold, or given an illegal drug on school property was higher among 10th-grade (23.7%) and 11th-grade (24.3%) than 12th-grade (20.6%) students; higher among 9th-grade female (21.1%), 10th-grade female (19.6%), and 11th-grade female (20.5%) than 12th-grade female (15.4%) students; and higher among 10th-grade male (27.3%) and 11th-grade male (27.8%) than 9th-grade male (22.9%) students. Prevalence of having been offered, sold, or given an illegal drug on school property ranged from 15.1% to 36.1% across state surveys (median: 24.4%) and from 15.8% to 39.5% across local surveys (median: 27.6%) (Table 60).
Sexual Behaviors that Contribute to Unintended Pregnancy and Sexually Transmitted Diseases, Including HIV Infection
Ever Had Sexual Intercourse
Nationwide, 46.0% of students had ever had sexual intercourse (Table 61). The prevalence of having ever had sexual intercourse was higher among black male (72.1%) and Hispanic male (52.8%) than black female (58.3%) and Hispanic female (45.4%) students, respectively. Overall, the prevalence of having ever had sexual intercourse was higher among black (65.2%) and Hispanic (49.1%) than white (42.0%) students; higher among black (65.2%) than Hispanic (49.1%) students; higher among black female (58.3%) than white female (44.7%) and Hispanic female (45.4%) students; higher among black male (72.1%) and Hispanic male (52.8%) than white male (39.6%) students; and higher among black male (72.1%) than Hispanic male (52.8%) students. Overall, the prevalence of having ever had sexual intercourse was higher among 10th-grade (40.9%), 11th-grade (53.0%), and 12th-grade (62.3%) than 9th-grade (31.6%) students; higher among 11th-grade (53.0%) and 12th-grade (62.3%) than 10th-grade (40.9%) students; higher among 12th-grade (62.3%) than 11th-grade (53.0%) students; higher among 10th-grade female (39.6%), 11th-grade female (52.5%), and 12th-grade female (65.0%) than 9th-grade female (29.3%) students; higher among 11th-grade female (52.5%) and 12th-grade female (65.0%) than 10th-grade female (39.6%) students; higher among 12th-grade female (65.0%) than 11th-grade female (52.5%) students; higher among 10th-grade male (41.9%), 11th-grade male (53.4%), and 12th-grade male (59.6%) than 9th-grade male (33.6%) students; higher among 11th-grade male (53.4%) and 12th-grade male (59.6%) than 10th-grade male (41.9%) students; and higher among 12th-grade male (59.6%) than 11th-grade male (53.4%) students. Prevalence of having ever had sexual intercourse ranged from 39.0% to 61.0% across state surveys (median: 48.2%) and from 28.7% to 63.5% across local surveys (median: 53.4%) (Table 62).
Had First Sexual Intercourse Before Age 13 Years
Nationwide, 5.9% of students had had sexual intercourse for the first time before age 13 years (Table 61). Overall, the prevalence of having had sexual intercourse before age 13 years was higher among male (8.4%) than female (3.1%) students; higher among white male (4.4%), black male (24.9%), and Hispanic male (9.8%) than white female (2.2%), black female (5.6%), and Hispanic female (3.7%) students, respectively; and higher among 9th-grade male (11.3%), 10th-grade male (9.0%), 11th-grade male (5.9%), and 12th-grade male (6.4%) than 9th-grade female (3.6%), 10th-grade female (3.6%), 11th-grade female (2.7%), and 12th-grade female (2.2%) students, respectively. Overall, the prevalence of having had sexual intercourse before age 13 years was higher among black (15.2%) and Hispanic (6.7%) than white (3.4%) students; higher among black (15.2%) than Hispanic (6.7%) students; higher among black female (5.6%) than white female (2.2%) students; higher among black male (24.9%) and Hispanic male (9.8%) than white male (4.4%) students; and higher among black male (24.9%) than Hispanic male (9.8%) students. Overall, the prevalence of having had sexual intercourse before age 13 years was higher among 9th-grade (7.7%) and 10th-grade (6.5%) than 11th-grade (4.3%) and 12th-grade (4.4%) students; higher among 9th-grade female (3.6%) and 10th-grade female (3.6%) than 12th-grade female (2.2%) students; and higher among 9th-grade male (11.3%) and 10th-grade male (9.0%) than 11th-grade male (5.9%) and 12th-grade male (6.4%) students. Prevalence of having had sexual intercourse before age 13 years ranged from 3.4% to 13.4% across state surveys (median: 5.7%) and from 4.8% to 14.5% across local surveys (median: 9.0%) (Table 62).
Had Sexual Intercourse with Four or More Persons During Their Life
Nationwide, 13.8% of students had had sexual intercourse with four or more persons during their life (Table 63). Overall, the prevalence of having had sexual intercourse with four or more persons was higher among male (16.2%) than female (11.2%) students; higher among black male (39.4%) and Hispanic male (18.0%) than black female (18.0%) and Hispanic female (10.4%) students, respectively; and higher among 9th-grade male (11.1%), 10th-grade male (15.3%), and 11th-grade male (17.5%) than 9th-grade female (6.3%), 10th-grade female (7.6%), and 11th-grade female (12.9%) students, respectively. Overall, the prevalence of having had sexual intercourse with four or more persons was higher among black (28.6%) and Hispanic (14.2%) than white (10.5%) students; higher among black (28.6%) than Hispanic (14.2%) students; higher among black female (18.0%) than white female (10.0%) and Hispanic female (10.4%) students; higher among black male (39.4%) and Hispanic male (18.0%) than white male (11.0%) students; and higher among black male (39.4%) than Hispanic male (18.0%) students. Overall, the prevalence of having had sexual intercourse with four or more persons was higher among 10th-grade (11.7%), 11th-grade (15.2%), and 12th-grade (20.9%) than 9th-grade (8.8%) students; higher among 11th-grade (15.2%) and 12th-grade (20.9%) than 10th-grade (11.7%) students; higher among 12th-grade (20.9%) than 11th-grade (15.2%) students; higher among 11th-grade female (12.9%) and 12th-grade female (19.1%) than 9th-grade female (6.3%) and 10th-grade female (7.6%) students; higher among 12th-grade female (19.1%) than 11th-grade female (12.9%) students; higher among 10th-grade male (15.3%), 11th-grade male (17.5%), and 12th-grade male (22.7%) than 9th-grade male (11.1%) students; and higher among 12th-grade male (22.7%) than 10th-grade male (15.3%) and 11th-grade male (17.5%) students. Prevalence of having had sexual intercourse with four or more persons ranged from 9.9% to 23.7% across state surveys (median: 14.5%) and from 8.9% to 25.5% across local surveys (median: 17.6%) (Table 64).
Currently Sexually Active
Nationwide, 34.2% of students had had sexual intercourse with at least one person during the 3 months before the survey (i.e., currently sexually active) (Table 63). The prevalence of being currently sexually active was higher among white female (35.4%) than white male (28.9%) students and higher among 12th-grade female (53.1%) than 12th-grade male (45.1%) students. Overall, the prevalence of being currently sexually active was higher among black (47.7%) than white (32.0%) and Hispanic (34.6%) students; higher among black female (45.0%) than white female (35.4%) and Hispanic female (34.1%) students; higher among black male (50.3%) and Hispanic male (35.0%) than white male (28.9%) students; and higher among black male (50.3%) than Hispanic male (35.0%) students. Overall, the prevalence of being currently sexually active was higher among 10th-grade (29.1%), 11th-grade (40.3%), and 12th-grade (49.1%) than 9th-grade (21.4%) students; higher among 11th-grade (40.3%) and 12th-grade (49.1%) than 10th-grade (29.1%) students; higher among 12th-grade (49.1%) than 11th-grade (40.3%) students; higher among 10th-grade female (29.3%), 11th-grade female (41.5%), and 12th-grade female (53.1%) than 9th-grade female (21.6%) students; higher among 11th-grade female (41.5%) and 12th-grade female (53.1%) than 10th-grade female (29.3%) students; higher among 12th-grade female (53.1%) than 11th-grade female (41.5%) students; higher among 10th-grade male (28.8%), 11th-grade male (39.1%), and 12th-grade male (45.1%) than 9th-grade male (21.2%) students; higher among 11th-grade male (39.1%) and 12th-grade male (45.1%) than 10th-grade male (28.8%) students; and higher among 12th-grade male (45.1%) than 11th-grade male (39.1%) students. Prevalence of being currently sexually active ranged from 27.4% to 44.9% across state surveys (median: 35.4%) and from 20.5% to 46.5% across local surveys (median: 38.0%) (Table 64).
Condom Use
Among the 34.2% of currently sexually active students nationwide, 61.1% reported that either they or their partner had used a condom during last sexual intercourse (Table 65). Overall, the prevalence of having used a condom during last sexual intercourse was higher among male (68.6%) than female (53.9%) students; higher among white male (71.0%), black male (72.5%), and Hispanic male (61.7%) than white female (56.1%), black female (51.8%), and Hispanic female (48.0%) students, respectively; and higher among 9th-grade male (69.9%), 10th-grade male (71.9%), 11th-grade male (68.9%), and 12th-grade male (65.0%) than 9th-grade female (57.7%), 10th-grade female (63.5%), 11th-grade female (54.0%), and 12th-grade female (46.3%) students, respectively. Overall, the prevalence of having used a condom during last sexual intercourse was higher among white (63.3%) and black (62.4%) than Hispanic (54.9%) students; higher among white female (56.1%) than Hispanic female (48.0%) students; and higher among white male (71.0%) and black male (72.5%) than Hispanic male (61.7%) students. Overall, the prevalence of having used a condom during last sexual intercourse was higher among 9th-grade (64.0%) than 12th-grade (55.0%) students; higher among 10th-grade (67.8%) than 11th-grade (61.4%) and 12th-grade (55.0%) students; higher among 11th-grade (61.4%) than 12th-grade (55.0%) students; higher among 9th-grade female (57.7%) than 12th-grade female (46.3%) students; higher among 10th-grade female (63.5%) than 11th-grade female (54.0%) and 12th-grade female (46.3%) students; and higher among 11th-grade female (54.0%) than 12th-grade female (46.3%) students. Prevalence of having used a condom during last sexual intercourse ranged from 47.7% to 67.6% across state surveys (median: 60.5%) and from 56.5% to 72.4% across local surveys (median: 65.5%) (Table 66).
Birth Control Pill Use
Among the 34.2% of currently sexually active students nationwide, 19.8% reported that either they or their partner had used birth control pills to prevent pregnancy before last sexual intercourse (Table 65). Overall, the prevalence of having used birth control pills before last sexual intercourse was higher among female (23.0%) than male (16.5%) students; higher among white female (31.4%) than white male (21.6%) students; and higher among 12th-grade female (34.4%) than 12th-grade male (19.6%) students. Overall, the prevalence of having used birth control pills before last sexual intercourse was higher among white (26.8%) than black (8.1%) and Hispanic (10.8%) students; higher among white female (31.4%) than black female (9.8%) and Hispanic female (9.9%) students; higher among white male (21.6%) than black male (6.6%) and Hispanic male (11.5%) students; and higher among Hispanic male (11.5%) than black male (6.6%) students. Overall, the prevalence of having used birth control pills before last sexual intercourse was higher among 10th-grade (14.7%), 11th-grade (20.7%), and 12th-grade (27.6%) than 9th-grade (10.2%) students; higher among 11th-grade (20.7%) and 12th-grade (27.6%) than 10th-grade (14.7%) students; higher among 12th-grade (27.6%) than 11th-grade (20.7%) students; higher among 10th-grade female (15.6%), 11th-grade female (22.5%), and 12th-grade female (34.4%) than 9th-grade female (9.7%) students; higher among 11th-grade female (22.5%) and 12th-grade female (34.4%) than 10th-grade female (15.6%) students; higher among 12th-grade female (34.4%) than 11th-grade female (22.5%) students; and higher among 11th-grade male (18.9%) and 12th-grade male (19.6%) than 9th-grade male (10.7%) students. Prevalence of having used birth control pills before last sexual intercourse ranged from 13.2% to 34.2% across state surveys (median: 21.2%) and from 6.1% to 17.7% across local surveys (median: 9.9%) (Table 66).
Depo-Provera Use
Among the 34.2% of currently sexually active students nationwide, 3.1% reported that either they or their partner had used Depo-Provera to prevent pregnancy before last sexual intercourse (Table 67). Overall, the prevalence of having used Depo-Provera before last sexual intercourse was higher among female (4.4%) than male (1.7%) students; higher among black female (8.5%) and Hispanic female (4.9%) than black male (1.2%) and Hispanic male (1.6%) students, respectively; and higher among 9th-grade female (3.3%), 10th-grade female (4.9%), and 11th-grade female (4.3%) than 9th-grade male (1.1%), 10th-grade male (0.6%), and 11th-grade male (1.0%) students, respectively. Overall, the prevalence of having used Depo-Provera before last sexual intercourse was higher among black (4.8%) than white (2.5%) students and higher among black female (8.5%) than white female (3.1%) and Hispanic female (4.9%) students. Overall, the prevalence of having used Depo-Provera before last sexual intercourse was higher among 12th-grade (4.1%) than 9th-grade (2.2%) students and higher among 12th-grade male (3.5%) than 9th-grade male (1.1%) and 10th-grade male (0.6%) students. Prevalence of having used Depo-Provera before last sexual intercourse ranged from 1.0% to 7.3% across state surveys (median: 3.9%) and from 1.1% to 12.1% across local surveys (median: 2.9%) (Table 68).
Birth Control Pill Use or Depo-Provera Use
Among the 34.2% of currently sexually active students nationwide, 22.9% reported that either they or their partner had used birth control pills or Depo-Provera to prevent pregnancy before last sexual intercourse (Table 67). Overall, the prevalence of having used birth control pills or Depo-Provera before last sexual intercourse was higher among female (27.4%) than male (18.3%) students; higher among white female (34.5%) and black female (18.2%) than white male (23.4%) and black male (7.9%) students, respectively; and higher among 11th-grade female (26.8%) and 12th-grade female (39.0%) than 11th-grade male (20.0%) and 12th-grade male (23.1%) students, respectively. Overall, the prevalence of having used birth control pills or Depo-Provera before last sexual intercourse was higher among white (29.3%) than black (12.9%) and Hispanic (14.0%) students; higher among white female (34.5%) than black female (18.2%) and Hispanic female (14.8%) students; higher among white male (23.4%) than black male (7.9%) and Hispanic male (13.1%) students; and higher among Hispanic male (13.1%) than black male (7.9%) students. Overall, the prevalence of having used birth control pills or Depo-Provera before last sexual intercourse was higher among 10th-grade (17.5%), 11th-grade (23.4%), and 12th-grade (31.8%) than 9th-grade (12.4%) students; higher among 11th-grade (23.4%) and 12th-grade (31.8%) than 10th-grade (17.5%) students; higher among 12th-grade (31.8%) than 11th-grade (23.4%) students; higher among 10th-grade female (20.5%), 11th-grade female (26.8%), and 12th-grade female (39.0%) than 9th-grade female (13.0%) students; higher among 11th-grade female (26.8%) and 12th-grade female (39.0%) than 10th-grade female (20.5%) students; higher among 12th-grade female (39.0%) than 11th-grade female (26.8%) students; higher among 11th-grade male (20.0%) and 12th-grade male (23.1%) than 9th-grade male (11.8%) students; and higher among 12th-grade male (23.1%) than 10th-grade male (14.6%) students. Prevalence of having used birth control pills or Depo-Provera before last sexual intercourse ranged from 15.8% to 39.0% across state surveys (median: 25.7%) and from 7.9% to 23.1% across local surveys (median: 15.2%) (Table 68).
Condom Use and Birth Control Pill Use or Depo-Provera Use
Among the 34.2% of currently sexually active students nationwide, 8.9% reported either they or their partner had used both a condom during last sexual intercourse and birth control pills or Depo-Provera to prevent pregnancy before last sexual intercourse (Table 69). The prevalence of having used both a condom during last sexual intercourse and birth control pills or Depo-Provera before last sexual intercourse was higher among 12th-grade female (13.7%) than 12th-grade male (8.2%) students. Overall, the prevalence of having used both a condom during last sexual intercourse and birth control pills or Depo-Provera before last sexual intercourse was higher among white (12.0%) than black (4.6%) and Hispanic (3.5%) students; higher among white female (13.1%) than black female (5.6%) and Hispanic female (3.2%) students; and higher among white male (10.7%) than black male (3.6%) and Hispanic male (3.8%) students. Overall, the prevalence of having used both a condom during last sexual intercourse and birth control pills or Depo-Provera before last sexual intercourse was higher among 10th-grade (8.5%), 11th-grade (8.4%), and 12th-grade (11.3%) than 9th-grade (5.6%) students; higher among 12th-grade female (13.7%) than 9th-grade female (6.6%) and 11th-grade female (7.5%) students; and higher among 11th-grade male (9.3%) and 12th-grade male (8.2%) than 9th-grade male (4.7%) students. Prevalence of having used both a condom during last sexual intercourse and birth control pills or Depo-Provera before last sexual intercourse ranged from 3.8% to 16.4% across state surveys (median: 9.5%) and from 2.7% to 10.1% across local surveys (median: 5.3%) (Table 70).
Drank Alcohol or Used Drugs Before Last Sexual Intercourse
Among the 34.2% of currently sexually active students nationwide, 21.6% had drunk alcohol or used drugs before last sexual intercourse (Table 71). Overall, the prevalence of having drunk alcohol or used drugs before last sexual intercourse was higher among male (25.9%) than female (17.1%) students; higher among white male (28.0%), black male (20.8%), and Hispanic male (22.6%) than white female (18.2%), black female (15.2%), and Hispanic female (15.0%) students, respectively; and higher among 10th-grade male (26.5%), 11th-grade male (25.9%), and 12th-grade male (25.8%) than 10th-grade female (18.1%), 11th-grade female (14.7%), and 12th-grade female (15.2%) students, respectively. Overall, the prevalence of having drunk alcohol or used drugs before last sexual intercourse was higher among white (22.9%) than Hispanic (18.9%) students and higher among white male (28.0%) than black male (20.8%) and Hispanic male (22.6%) students. Overall, the prevalence of having drunk alcohol or used drugs before last sexual intercourse was higher among 9th-grade (24.7%) than 12th-grade (20.2%) students and higher among 9th-grade female (23.5%) than 11th-grade female (14.7%) and 12th-grade female (15.2%) students. Prevalence of having drunk alcohol or used drugs before last sexual intercourse ranged from 14.6% to 30.2% across state surveys (median: 21.3%) and from 11.1% to 23.7% across local surveys (median: 18.9%) (Table 72).
Were Taught in School About AIDS or HIV Infection
Nationwide, 87.0% of students had ever been taught in school about AIDS or HIV infection (Table 71). Overall, the prevalence of having been taught in school about AIDS or HIV infection was higher among female (87.8%) than male (86.3%) students. Overall, the prevalence of having been taught in school about AIDS or HIV infection was higher among white (88.6%) than Hispanic (83.2%) students; higher among white female (89.6%) than Hispanic female (83.2%) students; and higher among white male (87.8%) than Hispanic male (83.2%) students. Overall, the prevalence of having been taught in school about AIDS or HIV infection was higher among 10th-grade (87.3%), 11th-grade (89.3%), and 12th-grade (89.3%) than 9th-grade (83.1%) students; higher among 11th-grade female (89.9%) and 12th-grade female (89.4%) than 9th-grade female (84.6%) students; and higher among 10th-grade male (86.9%), 11th-grade male (88.8%), and 12th-grade male (89.1%) than 9th-grade male (81.8%) students. Prevalence of having been taught in school about AIDS or HIV infection ranged from 76.2% to 91.9% across state surveys (median: 85.7%) and from 77.0% to 88.1% across local surveys (median: 84.5%) (Table 72).
Tested for HIV
Nationwide, 12.7% of students had been tested for HIV, not counting tests done when donating blood (Table 73). Overall, the prevalence of HIV testing was higher among female (14.7%) than male (10.9%) students; higher among white female (13.2%) and black female (25.1%) than white male (9.1%) and black male (17.6%) students, respectively; and higher among 11th-grade female (16.4%) and 12th-grade female (23.5%) than 11th-grade male (12.5%) and 12th-grade male (13.7%) students, respectively. Overall, the prevalence of HIV testing was higher among black (21.4%) than white (11.0%) and Hispanic (12.4%) students; higher among black female (25.1%) than white female (13.2%) and Hispanic female (12.4%) students; higher among black male (17.6%) and Hispanic male (12.4%) than white male (9.1%) students; and higher among black male (17.6%) than Hispanic male (12.4%) students. Overall, the prevalence of HIV testing was higher among 10th-grade (10.5%), 11th-grade (14.4%), and 12th-grade (18.5%) than 9th-grade (8.6%) students; higher among 11th-grade (14.4%) and 12th-grade (18.5%) than 10th-grade (10.5%) students; higher among 12th-grade (18.5%) than 11th-grade (14.4%) students; higher among 10th-grade female (12.0%), 11th-grade female (16.4%), and 12th-grade female (23.5%) than 9th-grade female (8.2%) students; higher among 11th-grade female (16.4%) and 12th-grade female (23.5%) than 10th-grade female (12.0%) students; higher among 12th-grade female (23.5%) than 11th-grade female (16.4%) students; and higher among 11th-grade male (12.5%) and 12th-grade male (13.7%) than 9th-grade male (8.9%) and 10th-grade male (9.2%) students.
Dietary Behaviors
Ate Fruit or Drank 100% Fruit Juices Two or More Times per Day
Nationwide, 33.9% of students had eaten fruit or drunk 100% fruit juices two or more times per day during the 7 days before the survey (Table 74). Overall, the prevalence of having eaten fruit or drunk 100% fruit juices two or more times per day was higher among male (35.3%) than female (32.2%) students; higher among black male (39.6%) and Hispanic male (35.9%) than black female (35.0%) and Hispanic female (32.4%) students, respectively; and higher among 10th-grade male (37.6%) than 10th-grade female (30.3%) students. Overall, the prevalence of having eaten fruit or drunk 100% fruit juices two or more times per day was higher among black (37.3%) than white (32.2%) students and higher among black male (39.6%) than white male (33.1%) students. Overall, the prevalence of having eaten fruit or drunk 100% fruit juices two or more times per day was higher among 9th-grade (35.3%) than 12th-grade (32.0%) students and higher among 10th-grade male (37.6%) than 11th-grade male (33.9%) and 12th-grade male (32.5%) students. Prevalence of having eaten fruit or drunk 100% fruit juices two or more times per day ranged from 21.3% to 36.0% across state surveys (median: 28.4%) and from 24.7% to 39.3% across local surveys (median: 33.5%) (Table 75).
Ate Vegetables Three or More Times per Day
Nationwide, 13.8% of students had eaten vegetables** three or more times per day during the 7 days before the survey (Table 74). Overall, the prevalence of having eaten vegetables three or more times per day was higher among male (14.5%) than female (13.0%) students and higher among Hispanic male (15.9%) than Hispanic female (11.5%) students. The prevalence of having eaten vegetables three or more times per day was higher among Hispanic male (15.9%) than white male (12.8%) students. The prevalence of having eaten vegetables three or more times per day was higher among 9th-grade male (15.7%) than 11th-grade male (13.0%) students. Prevalence of having eaten vegetables three or more times per day ranged from 8.0% to 16.7% across state surveys (median: 12.4%) and from 9.3% to 16.9% across local surveys (median: 13.6%) (Table 75).
Ate Fruits and Vegetables Five or More Times per Day
Nationwide, 22.3% of students had eaten fruits and vegetables†† five or more times per day during the 7 days before the survey (Table 76). Overall, the prevalence of having eaten fruits and vegetables five or more times per day was higher among male (23.9%) than female (20.5%) students; higher among Hispanic male (25.3%) than Hispanic female (18.6%) students; and higher among 10th-grade male (25.2%) than 10th-grade female (19.7%) students. Overall, the prevalence of having eaten fruits and vegetables five or more times per day was higher among black (26.6%) than white (20.5%) and Hispanic (22.0%) students; higher among black female (25.2%) than white female (19.6%) and Hispanic female (18.6%) students; and higher among black male (28.0%) than white male (21.3%) students. Overall, the prevalence of having eaten fruits and vegetables five or more times per day was higher among 9th-grade (23.0%) than 12th-grade (20.8%) students and higher among 10th-grade male (25.2%) than 12th-grade male (21.9%) students. Prevalence of having eaten fruits and vegetables five or more times per day ranged from 13.7% to 24.4% across state surveys (median: 18.4%) and from 17.5% to 26.1% across local surveys (median: 22.6%) (Table 77).
Drank Three or More Glasses per Day of Milk
Nationwide, 14.5% of students had drunk three or more glasses per day of milk during the 7 days before the survey (Table 76). Overall, the prevalence of having drunk three or more glasses per day of milk was higher among male (19.8%) than female (8.7%) students; higher among white male (22.7%), black male (13.9%), and Hispanic male (15.9%) than white female (10.4%), black female (4.4%), and Hispanic female (7.2%) students, respectively; and higher among 9th-grade male (20.1%), 10th-grade male (23.3%), 11th-grade male (17.5%), and 12th-grade male (17.9%) than 9th-grade female (10.3%), 10th-grade female (9.7%), 11th-grade female (6.7%), and 12th-grade female (7.9%) students, respectively. Overall, the prevalence of having drunk three or more glasses per day of milk was higher among white (17.0%) than black (9.1%) and Hispanic (11.6%) students; higher among Hispanic (11.6%) than black (9.1%) students; higher among white female (10.4%) than black female (4.4%) and Hispanic female (7.2%) students; higher among Hispanic female (7.2%) than black female (4.4%) students; and higher among white male (22.7%) than black male (13.9%) and Hispanic male (15.9%) students. Overall, the prevalence of having drunk three or more glasses per day of milk was higher among 9th-grade (15.6%) and 10th-grade (16.9%) than 11th-grade (12.2%) and 12th-grade (13.0%) students; higher among 9th-grade female (10.3%) than 11th-grade female (6.7%) and 12th-grade female (7.9%) students; higher among 10th-grade female (9.7%) than 11th-grade female (6.7%) students; and higher among 10th-grade male (23.3%) than 11th-grade male (17.5%) and 12th-grade male (17.9%) students. Prevalence of having drunk three or more glasses per day of milk ranged from 7.2% to 24.1% across state surveys (median: 13.1%) and from 6.6% to 13.4% across local surveys (median: 10.0%) (Table 77).
Drank Soda or Pop at Least One Time per Day
Nationwide, 29.2% of students had drunk a can, bottle, or glass of soda or pop (not including diet soda or diet pop) at least one time per day during the 7 days before the survey (Table 78). Overall, the prevalence of having drunk soda or pop at least one time per day was higher among male (34.6%) than female (23.3%) students; higher among white male (35.6%) and Hispanic male (32.2%) than white female (21.5%) and Hispanic female (24.0%) students, respectively; and higher among 9th-grade male (35.6%), 10th-grade male (34.6%), 11th-grade male (35.2%), and 12th-grade male (32.7%) than 9th-grade female (24.6%), 10th-grade female (23.2%), 11th-grade female (21.3%), and 12th-grade female (23.8%) students, respectively. Overall, the prevalence of having drunk soda or pop at least one time per day was higher among black (33.7%) than white (29.0%) and Hispanic (28.1%) students and higher among black female (32.3%) than white female (21.5%) and Hispanic female (24.0%) students. Prevalence of having drunk soda or pop at least one time per day ranged from 14.5% to 41.3% across state surveys (median: 28.3%) and from 15.5% to 39.2% across local surveys (median: 27.8%) (Table 79).
Physical Activity
Physically Active at Least 60 Minutes per Day on All 7 Days
Nationwide, 18.4% of students were physically active doing any kind of physical activity that increased their heart rate and made them breathe hard some of the time for a total of least 60 minutes per day on each of the 7 days before the survey (i.e., physically active at least 60 minutes on all 7 days) (Table 80). Overall, the prevalence of having been physically active at least 60 minutes on all 7 days was higher among male (24.8%) than female (11.4%) students; higher among white male (26.2%), black male (24.4%), and Hispanic male (20.7%) than white female (12.4%), black female (10.0%), and Hispanic female (10.5%) students, respectively; and higher among 9th-grade male (28.0%), 10th-grade male (25.3%), 11th-grade male (23.3%), and 12th-grade male (21.9%) than 9th-grade female (13.6%), 10th-grade female (12.7%), 11th-grade female (10.3%), and 12th-grade female (8.6%) students, respectively. Overall, the prevalence of having been physically active at least 60 minutes on all 7 days was higher among white (19.7%) than black (17.2%) and Hispanic (15.6%) students and higher among white male (26.2%) and black male (24.4%) than Hispanic male (20.7%) students. Overall, the prevalence of having been physically active at least 60 minutes on all 7 days was higher among 9th-grade (21.3%) than 11th-grade (17.0%) and 12th-grade (15.3%) students; higher among 10th-grade (19.3%) than 12th-grade (15.3%) students; higher among 9th-grade female (13.6%) than 11th-grade female (10.3%) and 12th-grade female (8.6%) students; higher among 10th-grade female (12.7%) than 12th-grade female (8.6%) students; and higher among 9th-grade male (28.0%) than 11th-grade male (23.3%) and 12th-grade male (21.9%) students. Prevalence of having been physically active at least 60 minutes on all 7 days ranged from 17.0% to 27.8% across state surveys (median: 23.7%) and from 14.8% to 26.3% across local surveys (median: 18.6%) (Table 81).
Physically Active at Least 60 Minutes per Day on 5 or More Days
Nationwide, 37.0% of students had been physically active doing any kind of physical activity that increased their heart rate and made them breathe hard some of the time for a total of at least 60 minutes per day on 5 or more days during the 7 days before the survey (i.e., physically active at least 60 minutes per day on 5 or more days) (Table 80). Overall, the prevalence of having been physically active at least 60 minutes per day on 5 or more days was higher among male (45.6%) than female (27.7%) students; higher among white male (47.3%), black male (43.3%), and Hispanic male (41.3%) than white female (31.3%), black female (21.9%), and Hispanic female (24.9%) students, respectively; and higher among 9th-grade male (47.5%), 10th-grade male (47.4%), 11th-grade male (46.2%), and 12th-grade male (40.4%) than 9th-grade female (30.8%), 10th-grade female (30.5%), 11th-grade female (26.0%), and 12th-grade female (22.4%) students, respectively. Overall, the prevalence of having been physically active at least 60 minutes per day on 5 or more days was higher among white (39.9%) than black (32.6%) and Hispanic (33.1%) students; higher among white female (31.3%) than black female (21.9%) and Hispanic female (24.9%) students; and higher among white male (47.3%) than Hispanic male (41.3%) students. Overall, the prevalence of having been physically active at least 60 minutes per day on 5 or more days was higher among 9th-grade (39.7%) and 10th-grade (39.3%) than 11th-grade (36.4%) and 12th-grade (31.6%) students; higher among 11th-grade (36.4%) than 12th-grade (31.6%) students; higher among 9th-grade female (30.8%) and 10th-grade female (30.5%) than 11th-grade female (26.0%) and 12th-grade female (22.4%) students; and higher among 9th-grade male (47.5%), 10th-grade male (47.4%), and 11th-grade male (46.2%) than 12th-grade male (40.4%) students. Prevalence of having been physically active at least 60 minutes per day on 5 or more days ranged from 33.3% to 53.6% across state surveys (median: 44.0%) and from 25.9% to 47.0% across local surveys (median: 34.8%) (Table 81).
Did Not Participate in at Least 60 Minutes of Physical Activity on Any Day
Nationwide, 23.1% of students did not participate in at least 60 minutes of any kind of physical activity that increased their heart rate and made them breathe hard some of the time on at least 1 day during the 7 days before the survey (i.e., did not participate in at least 60 minutes of physical activity on any day) (Table 82). Overall, the prevalence of not participating in at least 60 minutes of physical activity on any day was higher among female (29.9%) than male (17.0%) students; higher among white female (25.4%), black female (43.6%), and Hispanic female (30.5%) than white male (15.9%), black male (20.6%), and Hispanic male (17.4%) students, respectively; and higher among 9th-grade female (26.9%), 10th-grade female (30.3%), 11th-grade female (29.8%), and 12th-grade female (33.0%) than 9th-grade male (17.4%), 10th-grade male (15.7%), 11th-grade male (16.4%), and 12th-grade male (18.5%) students, respectively. Overall, the prevalence of not participating in at least 60 minutes of physical activity on any day was higher among black (32.1%) and Hispanic (23.9%) than white (20.3%) students; higher among black (32.1%) than Hispanic (23.9%) students; higher among black female (43.6%) and Hispanic female (30.5%) than white female (25.4%) students; higher among black female (43.6%) than Hispanic female (30.5%) students; and higher among black male (20.6%) than white male (15.9%) students. Overall, the prevalence of not participating in at least 60 minutes of physical activity on any day was higher among 12th-grade (25.6%) than 9th-grade (21.8%) and 11th-grade (22.9%) students and higher among 10th-grade female (30.3%) and 12th-grade female (33.0%) than 9th-grade female (26.9%) students. Prevalence of not participating in at least 60 minutes of physical activity on any day ranged from 10.5% to 23.3% across state surveys (median: 16.1%) and from 14.7% to 28.5% across local surveys (median: 21.3%) (Table 83).
Used Computers 3 or More Hours per Day
Nationwide, 24.9% of students played video or computer games or used a computer for something that was not school work for 3 or more hours per day on an average school day (i.e., used computers 3 or more hours per day) (Table 84). Overall, the prevalence of using computers 3 or more hours per day was higher among male (28.3%) than female (21.2%) students; higher among white male (25.9%), black male (33.2%), and Hispanic male (28.4%) than white female (17.8%), black female (27.5%), and Hispanic female (23.0%) students, respectively; and higher among 9th-grade male (32.2%), 10th-grade male (28.2%), 11th-grade male (27.2%), and 12th-grade male (24.5%) than 9th-grade female (24.6%), 10th-grade female (22.5%), 11th-grade female (19.3%), and 12th-grade female (17.7%) students, respectively. Overall, the prevalence of using computers 3 or more hours per day was higher among black (30.4%) and Hispanic (25.7%) than white (22.1%) students; higher among black (30.4%) than Hispanic (25.7%) students; higher among black female (27.5%) and Hispanic female (23.0%) than white female (17.8%) students; and higher among black male (33.2%) than white male (25.9%) and Hispanic male (28.4%) students. Overall, the prevalence of using computers 3 or more hours per day was higher among 9th-grade (28.7%) than 10th-grade (25.5%), 11th-grade (23.4%), and 12th-grade (21.2%) students; higher among 10th-grade (25.5%) than 12th-grade (21.2%) students; higher among 9th-grade female (24.6%) than 11th-grade female (19.3%) and 12th-grade female (17.7%) students; higher among 10th-grade female (22.5%) than 12th-grade female (17.7%) students; and higher among 9th-grade male (32.2%) than 11th-grade male (27.2%) and 12th-grade male (24.5%) students. Prevalence of using computers 3 or more hours per day ranged from 12.1% to 31.0% across state surveys (median: 23.5%) and from 24.2% to 42.5% across local surveys (median: 28.6%) (Table 85).
Watched Television 3 or More Hours per Day
Nationwide, 32.8% of students watched television 3 or more hours per day on an average school day (Table 84). Overall, the prevalence of having watched television 3 or more hours per day was higher among black (55.5%) and Hispanic (41.9%) than white (24.8%) students; higher among black (55.5%) than Hispanic (41.9%) students; higher among black female (57.4%) and Hispanic female (41.5%) than white female (22.7%) students; higher among black female (57.4%) than Hispanic female (41.5%) students; higher among black male (53.7%) and Hispanic male (42.4%) than white male (26.6%) students; and higher among black male (53.7%) than Hispanic male (42.4%) students. Overall, the prevalence of having watched television 3 or more hours per day was higher among 9th-grade (35.2%) and 10th-grade (34.7%) than 11th-grade (30.8%) and 12th-grade (29.7%) students; higher among 9th-grade female (33.9%) and 10th-grade female (33.6%) than 11th-grade female (29.6%) students; and higher among 9th-grade male (36.3%) and 10th-grade male (35.7%) than 11th-grade male (31.8%) and 12th-grade male (28.4%) students. Prevalence of having watched television 3 or more hours per day ranged from 16.3% to 44.9% across state surveys (median: 30.8%) and from 27.7% to 59.6% across local surveys (median: 42.7%) (Table 85).
Attended Physical Education Classes
Nationwide, 56.4% of students went to physical education (PE) classes on 1 or more days in an average week when they were in school (i.e., attended PE classes) (Table 86). The prevalence of attending PE classes was higher among black male (58.9%) and Hispanic male (63.1%) than black female (49.8%) and Hispanic female (57.9%) students, respectively. The prevalence of attending PE classes was higher among Hispanic female (57.9%) than black female (49.8%) students. Overall, the prevalence of attending PE classes was higher among 9th-grade (72.4%) than 10th-grade (57.6%), 11th-grade (48.2%), and 12th-grade (43.8%) students; higher among 10th-grade (57.6%) than 11th-grade (48.2%) and 12th-grade (43.8%) students; higher among 11th-grade (48.2%) than 12th-grade (43.8%) students; higher among 9th-grade female (74.3%) than 10th-grade female (56.4%), 11th-grade female (45.3%), and 12th-grade female (40.7%) students; higher among 10th-grade female (56.4%) than 11th-grade female (45.3%) and 12th-grade female (40.7%) students; higher among 9th-grade male (70.7%) than 10th-grade male (58.6%), 11th-grade male (50.9%), and 12th-grade male (46.9%) students; higher among 10th-grade male (58.6%) than 11th-grade male (50.9%) and 12th-grade male (46.9%) students; and higher among 11th-grade male (50.9%) than 12th-grade male (46.9%) students. Prevalence of attending PE classes ranged from 29.1% to 92.0% across state surveys (median: 43.8%) and from 35.5% to 81.1% across local surveys (median: 47.2%) (Table 87).
Attended Physical Education Classes Daily
Nationwide, 33.3% of students went to physical education (PE) classes 5 days in an average week when they were in school (i.e., attended PE classes daily) (Table 86). The prevalence of having attended PE classes daily was higher among black male (40.1%) than black female (34.0%) students and higher among 12th-grade male (25.2%) than 12th-grade female (19.6%) students. Overall, the prevalence of having attended PE classes daily was higher among Hispanic (40.5%) than white (30.6%) students; higher among Hispanic female (39.5%) than white female (29.7%) students; and higher among black male (40.1%) and Hispanic male (41.5%) than white male (31.4%) students. Overall, the prevalence of having attended PE classes daily was higher among 9th-grade (46.7%) than 10th-grade (33.7%), 11th-grade (27.6%), and 12th-grade (22.4%) students; higher among 10th-grade (33.7%) than 11th-grade (27.6%) and 12th-grade (22.4%) students; higher among 11th-grade (27.6%) than 12th-grade (22.4%) students; higher among 9th-grade female (48.2%) than 10th-grade female (32.3%), 11th-grade female (25.5%), and 12th-grade female (19.6%) students; higher among 10th-grade female (32.3%) than 11th-grade female (25.5%) and 12th-grade female (19.6%) students; higher among 11th-grade female (25.5%) than 12th-grade female (19.6%) students; higher among 9th-grade male (45.5%) than 10th-grade male (34.9%), 11th-grade male (29.7%), and 12th-grade male (25.2%) students; and higher among 10th-grade male (34.9%) and 11th-grade male (29.7%) than 12th-grade male (25.2%) students. Prevalence of having attended PE classes daily ranged from 5.4% to 67.5% across state surveys (median: 23.1%) and from 8.4% to 46.4% across local surveys (median: 26.4%) (Table 87).
Played on at Least One Sports Team
Nationwide, 58.3% of students had played on at least one sports team (run by their school or community groups) during the 12 months before the survey (Table 88). Overall, the prevalence of having played on at least one sports team was higher among male (63.8%) than female (52.3%) students; higher among black male (67.6%) and Hispanic male (62.0%) than black female (46.7%) and Hispanic female (44.5%) students, respectively; and higher among 9th-grade male (65.9%), 10th-grade male (66.8%), 11th-grade male (63.4%), and 12th-grade male (57.9%) than 9th-grade female (56.6%), 10th-grade female (56.4%), 11th-grade female (51.3%), and 12th-grade female (44.1%) students, respectively. Overall, the prevalence of having played on at least one sports team was higher among white (61.1%) and black (57.3%) than Hispanic (53.2%) students; higher among white female (57.7%) than black female (46.7%) and Hispanic female (44.5%) students; and higher among black male (67.6%) than Hispanic male (62.0%) students. Overall, the prevalence of having played on at least one sports team was higher among 9th-grade (61.6%) and 10th-grade (61.8%) than 11th-grade (57.6%) and 12th-grade (51.1%) students; higher among 11th-grade (57.6%) than 12th-grade (51.1%) students; higher among 9th-grade female (56.6%) and 10th-grade female (56.4%) than 11th-grade female (51.3%) and 12th-grade female (44.1%) students; higher among 11th-grade female (51.3%) than 12th-grade female (44.1%) students; and higher among 9th-grade male (65.9%), 10th-grade male (66.8%), and 11th-grade male (63.4%) than 12th-grade male (57.9%) students. Prevalence of having played on at least one sports team ranged from 48.2% to 64.4% across state surveys (median: 57.4%) and from 42.8% to 56.8% across local surveys (median: 49.8%) (Table 89).
Obesity, Overweight, and Weight Control
Obese
Nationwide, 12.0% of students were obese (Table 90). Overall, the prevalence of obesity was higher among male (15.3%) than female (8.3%) students; higher among white male (13.8%) and Hispanic male (18.9%) than white female (6.2%) and Hispanic female (11.1%) students, respectively; and higher among 9th-grade male (15.3%), 10th-grade male (13.8%), 11th-grade male (14.5%), and 12th-grade male (17.7%) than 9th-grade female (7.6%), 10th-grade female (7.7%), 11th-grade female (8.9%), and 12th-grade female (9.1%) students, respectively. Overall, the prevalence of obesity was higher among black (15.1%) and Hispanic (15.1%) than white (10.3%) students; higher among black female (12.6%) and Hispanic female (11.1%) than white female (6.2%) students; and higher among Hispanic male (18.9%) than white male (13.8%) students. Prevalence of obesity ranged from 6.4% to 18.3% across state surveys (median: 12.3%) and from 8.4% to 20.8% across local surveys (median: 12.6%) (Table 91).
Overweight
Nationwide, 15.8% of students were overweight (Table 90). Overall, the prevalence of overweight was higher among black (21.0%) and Hispanic (19.6%) than white (13.6%) students; higher among black female (23.3%) and Hispanic female (19.5%) than white female (13.2%) students; and higher among black male (18.7%) and Hispanic male (19.7%) than white male (13.9%) students. Overall, the prevalence of overweight was higher among 9th-grade (17.2%) than 11th-grade (14.0%) and 12th-grade (14.7%) students; higher among 10th-grade (16.9%) than 11th-grade (14.0%) students; higher among 9th-grade female (17.9%) than 11th-grade female (13.5%) and 12th-grade female (15.1%) students; and higher among 10th-grade female (16.9%) than 11th-grade female (13.5%) students. Prevalence of overweight ranged from 10.5% to 18.0% across state surveys (median: 14.6%) and from 12.8% to 21.1% across local surveys (median: 16.6%) (Table 91).
Described Themselves as Overweight
Nationwide, 27.7% of students described themselves as slightly or very overweight (Table 92). Overall, the prevalence of describing themselves as overweight was higher among female (33.1%) than male (22.7%) students; higher among white female (32.3%), black female (28.7%), and Hispanic female (37.6%) than white male (21.3%), black male (17.2%), and Hispanic male (28.8%) students, respectively; and higher among 9th-grade female (32.2%), 10th-grade female (31.1%), 11th-grade female (33.5%), and 12th-grade female (36.0%) than 9th-grade male (22.7%), 10th-grade male (21.2%), 11th-grade male (21.8%), and 12th-grade male (25.5%) students, respectively. Overall, the prevalence of describing themselves as overweight was higher among white (26.4%) than black (22.9%) students; higher among Hispanic (33.3%) than white (26.4%) and black (22.9%) students; higher among Hispanic female (37.6%) than white female (32.3%) and black female (28.7%) students; higher among white male (21.3%) than black male (17.2%) students; and higher among Hispanic male (28.8%) than white male (21.3%) and black male (17.2%) students. Overall, the prevalence of describing themselves as overweight was higher among 12th-grade (30.6%) than 9th-grade (27.1%), 10th-grade (25.9%), and 11th-grade (27.5%) students; higher among 12th-grade female (36.0%) than 9th-grade female (32.2%) and 10th-grade female (31.1%) students; and higher among 12th-grade male (25.5%) than 10th-grade male (21.2%) and 11th-grade male (21.8%) students. Prevalence of describing themselves as overweight ranged from 21.9% to 30.6% across state surveys (median: 27.9%) and from 21.5% to 33.1% across local surveys (median: 27.0%) (Table 93).
Were Trying to Lose Weight
Nationwide, 44.4% of students were trying to lose weight (Table 92). Overall, the prevalence of trying to lose weight was higher among female (59.3%) than male (30.5%) students; higher among white female (61.3%), black female (47.3%), and Hispanic female (62.4%) than white male (28.4%), black male (26.3%), and Hispanic male (41.8%) students, respectively; and higher among 9th-grade female (57.0%), 10th-grade female (59.4%), 11th-grade female (60.8%), and 12th-grade female (60.3%) than 9th-grade male (31.8%), 10th-grade male (29.5%), 11th-grade male (28.0%), and 12th-grade male (32.8%) students, respectively. Overall, the prevalence of trying to lose weight was higher among white (43.7%) than black (36.8%) students; higher among Hispanic (52.1%) than white (43.7%) and black (36.8%) students; higher among white female (61.3%) and Hispanic female (62.4%) than black female (47.3%) students; and higher among Hispanic male (41.8%) than white male (28.4%) and black male (26.3%) students. The prevalence of trying to lose weight was higher among 11th-grade female (60.8%) than 9th-grade female (57.0%) students and higher among 12th-grade male (32.8%) than 11th-grade male (28.0%) students. Prevalence of trying to lose weight ranged from 38.6% to 50.2% across state surveys (median: 44.3%) and from 36.6% to 51.4% across local surveys (median: 43.8%) (Table 93).
Ate Less Food, Fewer Calories, or Low-Fat Foods to Lose Weight or to Keep From Gaining Weight
Nationwide, 39.5% of students had eaten less food, fewer calories, or low-fat foods to lose weight or to keep from gaining weight during the 30 days before the survey (Table 94). Overall, the prevalence of having eaten less food, fewer calories, or low-fat foods to lose weight or to keep from gaining weight was higher among female (51.6%) than male (28.4%) students; higher among white female (56.5%), black female (35.0%), and Hispanic female (48.0%) than white male (28.4%), black male (23.2%), and Hispanic male (32.8%) students, respectively; and higher among 9th-grade female (49.1%), 10th-grade female (52.6%), 11th-grade female (52.7%), and 12th-grade female (52.0%) than 9th-grade male (27.5%), 10th-grade male (26.7%), 11th-grade male (27.8%), and 12th-grade male (32.4%) students, respectively. Overall, the prevalence of having eaten less food, fewer calories, or low-fat foods to lose weight or to keep from gaining weight was higher among white (41.4%) and Hispanic (40.4%) than black (29.2%) students; higher among white female (56.5%) than black female (35.0%) and Hispanic female (48.0%) students; higher among Hispanic female (48.0%) than black female (35.0%) students; higher among white male (28.4%) than black male (23.2%) students; and higher among Hispanic male (32.8%) than white male (28.4%) and black male (23.2%) students. Overall, the prevalence of having eaten less food, fewer calories, or low-fat foods to lose weight or to keep from gaining weight was higher among 12th-grade (42.1%) than 9th-grade (37.5%) students and higher among 12th-grade male (32.4%) than 9th-grade male (27.5%) students. Prevalence of having eaten less food, fewer calories, or low-fat foods to lose weight or to keep from gaining weight ranged from 32.4% to 41.5% across state surveys (median: 38.3%) and from 31.4% to 40.6% across local surveys (median: 35.6%) (Table 95).
Exercised to Lose Weight or to Keep From Gaining Weight
Nationwide, 61.5% of students had exercised to lose weight or to keep from gaining weight during the 30 days before the survey (Table 94). Overall, the prevalence of having exercised to lose weight or to keep from gaining weight was higher among female (67.9%) than male (55.7%) students; higher among white female (72.2%) than white male (53.8%) students; and higher among 9th-grade female (67.4%), 10th-grade female (69.6%), 11th-grade female (67.5%), and 12th-grade female (66.7%) than 9th-grade male (57.6%), 10th-grade male (53.6%), 11th-grade male (53.6%), and 12th-grade male (58.0%) students, respectively. Overall, the prevalence of having exercised to lose weight or to keep from gaining weight was higher among white (62.3%) than black (52.6%) students; higher among Hispanic (65.6%) than white (62.3%) and black (52.6%) students; higher among white female (72.2%) than black female (54.2%) and Hispanic female (66.3%) students; higher among Hispanic female (66.3%) than black female (54.2%) students; and higher among Hispanic male (64.8%) than white male (53.8%) and black male (51.1%) students. Prevalence of having exercised to lose weight or to keep from gaining weight ranged from 56.7% to 67.4% across state surveys (median: 60.3%) and from 49.8% to 63.9% across local surveys (median: 58.3%) (Table 95).
Did Not Eat for 24 or More Hours to Lose Weight or to Keep From Gaining Weight
Nationwide, 10.6% of students did not eat for 24 or more hours to lose weight or to keep from gaining weight during the 30 days before the survey (Table 96). Overall, the prevalence of not eating for 24 or more hours to lose weight or to keep from gaining weight was higher among female (14.5%) than male (6.9%) students; higher among white female (14.7%), black female (12.8%), and Hispanic female (15.2%) than white male (6.1%), black male (8.0%), and Hispanic male (8.8%) students, respectively; and higher among 9th-grade female (15.7%), 10th-grade female (14.5%), 11th-grade female (14.8%), and 12th-grade female (12.6%) than 9th-grade male (6.7%), 10th-grade male (6.5%), 11th-grade male (7.2%), and 12th-grade male (7.3%) students, respectively. Overall, the prevalence of not eating for 24 or more hours to lose weight or to keep from gaining weight was higher among Hispanic (12.0%) than white (10.1%) students and higher among Hispanic male (8.8%) than white male (6.1%) students. The prevalence of not eating for 24 or more hours to lose weight or to keep from gaining weight was higher among 9th-grade female (15.7%) than 12th-grade female (12.6%) students. Prevalence of not eating for 24 or more hours to lose weight or to keep from gaining weight ranged 7.7% to 16.6% across state surveys (median: 10.9%) and from 6.5% to 15.5% across local surveys (median: 9.9%) (Table 97).
Took Diet Pills, Powders, or Liquids to Lose Weight or to Keep From Gaining Weight
Nationwide, 5.0% of students had taken diet pills, powders, or liquids without a doctor's advice to lose weight or to keep from gaining weight during the 30 days before the survey (Table 96). Overall, the prevalence of having taken diet pills, powders, or liquids without a doctor's advice to lose weight or to keep from gaining weight was higher among female (6.3%) than male (3.8%) students; higher among white female (7.0%) and Hispanic female (6.9%) than white male (3.6%) and Hispanic male (4.6%) students, respectively; and higher among 10th-grade female (6.0%), 11th-grade female (8.1%), and 12th-grade female (6.6%) than 10th-grade male (3.0%), 11th-grade male (4.0%), and 12th-grade male (4.6%) students, respectively. Overall, the prevalence of having taken diet pills, powders, or liquids without a doctor's advice to lose weight or to keep from gaining weight was higher among white (5.2%) and Hispanic (5.7%) than black (3.8%) students and higher among white female (7.0%) and Hispanic female (6.9%) than black female (3.7%) students. Overall, the prevalence of having taken diet pills, powders, or liquids without a doctor's advice to lose weight or to keep from gaining weight was higher among 11th-grade (6.0%) than 9th-grade (4.2%) and 10th-grade (4.4%) students; higher among 11th-grade female (8.1%) than 9th-grade female (4.7%) students; and higher among 12th-grade male (4.6%) than 10th-grade male (3.0%) students. The prevalence of having taken diet pills, powders, or liquids without a doctor's advice to lose weight or to keep from gaining weight ranged from 3.0% to 10.5% across state surveys (median: 5.7%) and from 3.4% to 8.6% across local surveys (median: 5.4%) (Table 97).
Vomited or Took Laxatives to Lose Weight or to Keep From Gaining Weight
Nationwide, 4.0% of students had vomited or taken laxatives to lose weight or to keep from gaining weight during the 30 days before the survey (Table 98). Overall, the prevalence of having vomited or taken laxatives to lose weight or to keep from gaining weight was higher among female (5.4%) than male (2.6%) students; higher among white female (5.2%) and Hispanic female (6.9%) than white male (1.8%) and Hispanic male (4.0%) students, respectively; and higher among 9th-grade female (5.6%), 10th-grade female (5.3%), 11th-grade female (6.3%), and 12th-grade female (4.2%) than 9th-grade male (2.8%), 10th-grade male (2.2%), 11th-grade male (2.7%), and 12th-grade male (2.6%) students, respectively. Overall, the prevalence of having vomited or taken laxatives to lose weight or to keep from gaining weight was higher among Hispanic (5.4%) than white (3.4%) students; higher among Hispanic female (6.9%) than white female (5.2%) and black female (3.6%) students; and higher among black male (4.6%) and Hispanic male (4.0%) than white male (1.8%) students. Overall, the prevalence of having vomited or taken laxatives to lose weight or to keep from gaining weight was higher among 11th-grade (4.5%) than 12th-grade (3.4%) students and higher among 11th-grade female (6.3%) than 12th-grade female (4.2%) students. Prevalence of having vomited or taken laxatives to lose weight or to keep from gaining weight ranged from 3.5% to 9.3% across state surveys (median: 5.3%) and from 3.3% to 8.9% across local surveys (median: 4.9%) (Table 99).
Other Health-Related Topics
Ever Had Asthma
Nationwide, 22.0% of students had ever been told by a doctor or nurse that they had asthma (i.e., ever had asthma) (Table 100). The prevalence of having ever had asthma was higher among black male (26.4%) than black female (20.8%) students. Overall, the prevalence of having ever had asthma was higher among black (23.6%) than Hispanic (20.1%) students and higher among black male (26.4%) than white male (21.8%) and Hispanic male (21.5%) students. Prevalence of having ever had asthma ranged from 15.5% to 28.3% across state surveys (median: 21.7%) and from 18.1% to 29.4% across local surveys (median: 21.1%) (Table 101).
Current Asthma
Nationwide, 10.8% of students had ever had and still had asthma (i.e., current asthma) (Table 100). Overall, the prevalence of current asthma was higher among female (11.6%) than male (10.0%) students and higher among white female (12.1%) than white male (9.6%) students. Overall, the prevalence of current asthma was higher among white (10.8%) and black (12.5%) than Hispanic (9.0%) students; higher among white female (12.1%) than Hispanic female (9.6%) students; and higher among black male (13.1%) than white male (9.6%) and Hispanic male (8.2%) students. Prevalence of current asthma ranged from 7.9% to 13.1% across state surveys (median: 10.9%) and from 6.8% to 16.3% across local surveys (median: 8.5%) (Table 101).
Routine Sunscreen Use
Nationwide, 9.3% of students most of the time or always wore sunscreen with an SPF of 15 or higher when outside for more than 1 hour on a sunny day (i.e., routine sunscreen use) (Table 102). Overall, the prevalence of routine sunscreen use was higher among female (12.4%) than male (6.5%) students; higher among white female (14.4%), black female (5.9%), and Hispanic female (10.4%) than white male (7.4%), black male (3.3%), and Hispanic male (4.5%) students, respectively; and higher among 9th-grade female (12.6%), 10th-grade female (12.1%), 11th-grade female (13.8%), and 12th-grade female (11.0%) than 9th-grade male (6.5%), 10th-grade male (6.5%), 11th-grade male (7.0%), and 12th-grade male (6.1%) students, respectively. Overall, the prevalence of routine sunscreen use was higher among white (10.6%) than black (4.6%) and Hispanic (7.5%) students; higher among Hispanic (7.5%) than black (4.6%) students; higher among white female (14.4%) than black female (5.9%) and Hispanic female (10.4%) students; higher among Hispanic female (10.4%) than black female (5.9%) students; and higher among white male (7.4%) than black male (3.3%) and Hispanic male (4.5%) students.
Indoor Tanning Device Use
Nationwide, 15.6% of students had used an indoor tanning device, such as a sunlamp, sunbed, or tanning booth, one or more times during the 12 months before the survey (i.e., indoor tanning device use) (Table 102). Overall, the prevalence of indoor tanning device use was higher among female (25.4%) than male (6.7%) students; higher among white female (37.4%), black male (6.1%), and Hispanic female (10.5%) than white male (7.0%), black female (2.7%), and Hispanic male (5.8%) students, respectively; and higher among 9th-grade female (16.0%), 10th-grade female (23.2%), 11th-grade female (30.3%), and 12th-grade female (33.7%) than 9th-grade male (5.9%), 10th-grade male (4.6%), 11th-grade male (7.0%), and 12th-grade male (10.0%) students, respectively. Overall, the prevalence of indoor tanning device use was higher among white (21.1%) than black (4.5%) and Hispanic (8.2%) students; higher among Hispanic (8.2%) than black (4.5%) students; higher among white female (37.4%) than black female (2.7%) and Hispanic female (10.5%) students; and higher among Hispanic female (10.5%) than black female (2.7%) students. Overall, the prevalence of indoor tanning device use was higher among 10th-grade (13.4%), 11th-grade (18.2%), and 12th-grade (21.7%) than 9th-grade (10.5%) students; higher among 11th-grade (18.2%) and 12th-grade (21.7%) than 10th-grade (13.4%) students; higher among 12th-grade (21.7%) than 11th-grade (18.2%) students; higher among 10th-grade female (23.2%), 11th-grade female (30.3%), and 12th-grade female (33.7%) than 9th-grade female (16.0%) students; higher among 11th-grade female (30.3%) and 12th-grade female (33.7%) than 10th-grade female (23.2%) students; higher among 12th-grade male (10.0%) than 9th-grade male (5.9%) students; higher among 11th-grade male (7.0%) and 12th-grade male (10.0%) than 10th-grade male (4.6%) students; and higher among 12th-grade male (10.0%) than 11th-grade male (7.0%) students.
Eight or More Hours of Sleep
Nationwide, 30.9% of students had 8 or more hours of sleep on an average school night (Table 103). Overall, the prevalence of having had 8 or more hours of sleep was higher among male (33.3%) than female (28.2%) students; higher among white male (34.4%), black male (27.4%), and Hispanic male (36.1%) than white female (26.6%), black female (32.7%), and Hispanic female (32.0%) students, respectively; and higher among 9th-grade male (42.8%), 10th-grade male (33.4%), and 12th-grade male (27.1%) than 9th-grade female (36.2%), 10th-grade female (28.7%), and 12th-grade female (21.3%) students, respectively. Overall, the prevalence of having had 8 or more hours of sleep was higher among Hispanic (34.1%) than white (30.8%) and black (30.0%) students; higher among black female (32.7%) and Hispanic female (32.0%) than white female (26.6%) students; and higher among white male (34.4%) and Hispanic male (36.1%) than black male (27.4%) students. Overall, the prevalence of having had 8 or more hours of sleep was higher among 9th-grade (39.8%) than 10th-grade (31.3%), 11th-grade (26.6%), and 12th-grade (24.2%) students; higher among 10th-grade (31.3%) than 11th-grade (26.6%) and 12th-grade (24.2%) students; higher among 11th-grade (26.6%) than 12th-grade (24.2%) students; higher among 9th-grade female (36.2%) than 10th-grade female (28.7%), 11th-grade female (25.5%), and 12th-grade female (21.3%) students; higher among 10th-grade female (28.7%) and 11th-grade female (25.5%) than 12th-grade female (21.3%) students; higher among 9th-grade male (42.8%) than 10th-grade male (33.4%), 11th-grade male (27.7%), and 12th-grade male (27.1%) students; and higher among 10th-grade male (33.4%) than 11th-grade male (27.7%) and 12th-grade male (27.1%) students.
Trends During 1991--2009
Behaviors that Contribute to Unintentional Injuries
During 1991--2009, a significant linear decrease occurred in the percentage of students who rarely or never wore a seat belt (25.9%--9.7%), who rarely or never wore a motorcycle helmet (42.9%--31.9%), and who rode with a driver who had been drinking alcohol (39.9%--28.3%). The percentage of students who rarely or never wore a bicycle helmet decreased during 1991--2001 (96.2%--84.7%) and then did not change significantly during 2001--2009 (84.7%--84.7%). The percentage of students who drove when they had been drinking alcohol did not change significantly during 1991--1997 (16.7%--16.9%) and then decreased during 1997--2009 (16.9%--9.7%). During 2007--2009, no significant changes occurred in any of the behaviors that contribute to unintentional injuries.
Behaviors that Contribute to Violence
The percentage of students who carried a weapon decreased during 1991--1999 (26.1%--17.3%) and then did not change significantly during 1999--2009 (17.3%--17.5%). The percentage of students who carried a gun decreased during 1993--1999 (7.9%--4.9%) and then did not change significantly during 1999--2009 (4.9%--5.9%). The percentage of students who had been in a physical fight decreased during 1991--2003 (42.5%--33.0%) and then did not change significantly during 2003--2007 (33.0%--31.5%). The percentage of students who had been in a physical fight also decreased during 2007--2009 (35.5%--31.5%).
The percentage of students who carried a weapon on school property decreased during 1993--2003 (11.8%--6.1%) and then did not change significantly during 2003--2009 (6.1%--5.6%). During 1993--2009, a significant linear decrease occurred in the percentage of students who had been in a physical fight on school property (16.2%--11.1%). The percentage of students who did not go to school because of safety concerns increased during 1993--2001 (4.4%-- 6.6%) and then decreased during 2001-- 2009 (6.6%--5.0%). During 2007--2009, no significant changes occurred in any of the behaviors that contribute to violence on school property.
The percentage of students who felt sad or hopeless did not change significantly during 1999--2007 (28.3%--28.5%) and then decreased during 2007--2009 (28.5%--26.1%). The percentage of students who seriously considered attempting suicide decreased rapidly during 1991--1993 (29.0%--24.1%) and then decreased less rapidly during 1993--2009 (24.1%--13.8%). During 1991--2009, a significant linear decrease occurred in the percentage of students who made a suicide plan (18.6%--10.9%). The percentage of students who attempted suicide did not change significantly during 1991--2001 (7.3%--8.8%) and then decreased during 2001--2009 (8.8%--6.3%). The percentage of students who made a suicide attempt that had to be treated by a doctor or nurse did not change significantly during 1991--2003 (1.7%--2.9%) and then decreased during 2003--2009 (2.9%--1.9%).
Tobacco Use
The percentage of students who ever smoked cigarettes did not change significantly during 1991--1999 (70.1%--70.4%) and then decreased during 1999--2009 (70.4%--46.3%). The percentage of students who ever smoked cigarettes also decreased during 2007--2009 (50.3%--46.3%). During 2001--2009, significant linear decreases occurred in the percentage of students who ever smoked cigarettes daily (20.0%--11.2%), who tried to quit smoking cigarettes (57.4%--50.8%), and who bought cigarettes in a store or gas station (19.0%--14.1%). The percentage of students who reported current cigarette use increased during 1991--1997 (27.5%--36.4%) and then decreased during 1997--2009 (36.4%--19.5%). The percentage of students who reported current frequent cigarette use increased during 1991--1999 (12.7%--16.8%) and then decreased during 1999--2009 (16.8%--7.3%). During 1991--2009, a significant linear decrease occurred in the percentage of students who smoked more than 10 cigarettes per day (18.0%--7.8%). The percentage of students who reported smoking more than 10 cigarettes per day also decreased during 2007--2009 (10.7%--7.8%). The percentage of students who reported current smokeless tobacco use decreased during 1995--2003 (11.4%--6.7%) and then did not change significantly during 2003--2009 (6.7%--8.9%). The percentage of students who reported current cigar use decreased during 1997--2005 (22.0%--14.0%) and then did not change significantly during 2005--2009 (14.0%--14.0%). The percentage of students who reported current tobacco use decreased during 1997--2003 (43.4%--27.5%) and then did not change significantly during 2003--2009 (27.5%--26.0%).
Alcohol and Other Drug Use
During 1991--2009, a significant linear decrease occurred in the percentage of students who ever drank alcohol (81.6%--72.5%). The percentage of students who reported current alcohol use did not change significantly during 1991--1999 (50.8%--50.0%) and then decreased during 1999--2009 (50.0%--41.8%). The percentage of students who reported current alcohol use also decreased during 2007--2009 (44.7%--41.8%). The percentage of students who reported binge drinking did not change significantly during 1991--1997 (31.3%--33.4%) and then decreased during 1997--2009 (33.4%--24.2%). The percentage of students who ever used marijuana increased during 1991--1999 (31.3%--47.2%) and then decreased during 1999--2009 (47.2%--36.8%). The percentage of students who reported current marijuana use increased during 1991--1999 (14.7%--26.7%) and then decreased during 1999--2009 (26.7%--20.8%). The percentage of students who ever used cocaine increased during 1991--1999 (5.9%--9.5%) and then decreased during 1999--2009 (9.5%--6.4%), and the percentage of students who reported current cocaine use increased during 1991--2001 (1.7%--4.2%) and then decreased during 2001--2009 (4.2%--2.8%). The percentage of students who ever used inhalants decreased during 1995--2003 (20.3%--12.1%) and then did not change significantly during 2003--2009 (12.1%--11.7%). The percentage of students who ever used inhalants also decreased during 2007--2009 (13.3%--11.7%). During 2001--2009, a significant linear decrease occurred in the percentage of students who ever used ecstasy (11.1%--6.7%). The percentage of students who ever used methamphetamines did not change significantly during 1999--2001 (9.1%--9.8%) and then decreased during 2001--2009 (9.8%--4.1%). The percentage of students who ever took steroids without a doctor's prescription increased during 1991--2003 (2.7%--6.1%) and then decreased during 2003--2009 (6.1%--3.3%). The percentage of students who ever used hallucinogenic drugs decreased during 2001--2007 (13.3%--7.8%) and then did not change significantly during 2007--2009 (7.8%--8.0%).
Age of Initiation of Risk Behaviors
The percentage of students who smoked a whole cigarette for the first time before age 13 years increased during 1991--1993 (23.8%--26.9%) and then decreased during 1993--2009 (26.9%--10.7%). The percentage of students who smoked a whole cigarette for the first time before age 13 years also decreased during 2007--2009 (14.2%--10.7%) The percentage of students who drank alcohol for the first time before age 13 years did not change significantly 1991--1999 (32.7%--32.2%) and then decreased during 1999--2009 (32.2%--21.1%). The percentage of students who drank alcohol for the first time before age 13 years also decreased during 2007--2009 (23.8%--21.1%). The percentage of students who tried marijuana for the first time before age 13 years increased during 1991--1999 (7.4%--11.3%) and then decreased during 1999--2009 (11.3%--7.5%).
Tobacco, Alcohol, and Other Drug Use on School Property
The percentage of students who smoked cigarettes on school property did not change significantly during 1993--1995 (13.2%--16.0%) and then decreased during 1995--2009 (16.0%--5.1%). During 1993--2009, a significant linear decrease occurred in the percentage of students who drank alcohol on school property (5.2%--4.5%). The percentage of students who used marijuana on school property increased during 1993--1995 (5.6%--8.8%) and then decreased during 1995--2009 (8.8%--4.6%). The percentage of students who were offered, sold, or given an illegal drug on school property increased during 1993--1995 (24.0%--32.1%) and then decreased during 1995--2009 (32.1%--22.7%). During 2007--2009, no significant changes occurred in any of the tobacco, alcohol, and other drug use behaviors on school property.
Sexual Behaviors that Contribute to Unintended Pregnancy and Sexually Transmitted Diseases, Including HIV Infection
During 1991--2009, significant linear decreases occurred in the percentage of students who ever had sexual intercourse (54.1%--46.0%), who had sexual intercourse for the first time before age 13 years (10.2%--5.9%), who had sexual intercourse with four or more persons during their lifetime (18.7%--13.8%), and who were currently sexually active (37.5%--34.2%). The percentage of sexually active students who used a condom during last sexual intercourse increased during 1991--2003 (46.2%--63.0%) and then did not change significantly during 2003--2009 (63.0%--61.1%). The percentage of sexually active students who used birth control pills before last sexual intercourse did not change significantly during 1991--2007 (20.8%--16.0%) and then increased during 2007--2009 (16.0%--19.8%). During 1999--2009, a significant linear decrease occurred in the percentage of sexually active students who reported Depo-Provera use before last sexual intercourse (3.3%--3.1%). The percentage of sexually active students who reported birth control pill use or Depo-Provera use before last sexual intercourse increased during 2007--2009 (18.8%--22.9%). During 1999--2009, a significant linear increase occurred in the percentage of sexually active students who reported both condom use during last sexual intercourse and birth control pill use or Depo-Provera use before last sexual intercourse (4.8%--8.9%). The percentage of sexually active students who reported both condom use during last sexual intercourse and birth control pill use or Depo-Provera use before last sexual intercourse also increased during 2007--2009 (6.1%--8.9%). The percentage of sexually active students who drank alcohol or used drugs before last sexual intercourse increased during 1991--2001 (21.6%--25.6%) and then decreased during 2001--2009 (25.6%--21.6%). The percentage of students who were taught in school about AIDS or HIV infection increased during 1991--1997 (83.3%--91.5%) and then decreased during 1997--2009 (91.5%--87.0%). The percentage of students who were taught in school about AIDS or HIV infection also decreased during 2007--2009 (89.5%--87.0%).
Dietary Behaviors
The percentage of students who ate fruit or drank 100% fruit juices two or more times per day decreased during 1999--2005 (34.8%--30.1%) and increased during 2005--2009 (30.1%--33.9%). The percentage of students who ate fruits and vegetables five or more times per day decreased during 1999--2005 (23.9%--20.1%) and then did not change significantly during 2005--2009 (20.1%--22.3%). During 1999--2009, a significant linear decrease occurred in the percentage of students who drank three or more glasses per day of milk (18.0%--14.5%). The percentage of students who drank soda or pop at least one time per day decreased during 2007--2009 (33.8%--29.2%).
Physical Activity
During 2003--2009, a significant linear increase occurred in the percentage of students who used computers 3 or more hours per day (22.1%--24.9%). During 1999--2009, a significant linear decrease occurred in the percentage of students who watched 3 or more hours per day of television (42.8%--32.8%). The percentage of students who attended PE classes daily decreased during 1991--1995 (41.6%--25.4%) and then did not change significantly during 1995--2009 (25.4%--33.3%). During 2007--2009, no significant changes occurred in any of the physical activity behaviors.
Obesity, Overweight, and Weight Control
During 1999--2009, significant linear increases occurred in the percentage of students who were obese (10.7%--12.0%) and who were overweight (14.4%--15.8%). The percentage of students who described themselves as overweight decreased during 1991--1997 (31.8%--27.3%) and then did not change significantly during 1997--2009 (27.3%--27.7%). The percentage of students who described themselves as overweight also decreased during 2007--2009 (29.3%--27.7%). During 1991--2009, a significant linear increase occurred in the percentage of students who were trying to lose weight (41.8%--44.4%). The percentage of students who ate less food, fewer calories, or low-fat foods to lose weight or to keep from gaining weight increased during 1999--2001 (40.4%--43.8%) and then decreased during 2001--2009 (43.8%--39.5%). The percentage of students who exercised to lose weight or to keep from gaining weight increased rapidly during 1995--2001 (51.0%--59.9%) and then increased less rapidly during 2001--2009 (59.9%--61.5%). The percentage of students who did not eat for 24 or more hours to lose weight or to keep from gaining weight did not change significantly during 1999--2001 (12.6%--13.5%) and then decreased during 2001--2009 (13.5%--10.6%). The percentage of students who did not eat for 24 or more hours to lose weight or to keep from gaining weight also decreased during 2007--2009 (11.8%--10.6%). The percentage of students who took diet pills, powders, or liquids to lose weight or to keep from gaining weight increased during 1999--2001 (7.6%--9.2%) and then decreased during 2001--2009 (9.2%--5.0%). The percentage of students who took diet pills, powders, or liquids to lose weight or to keep from gaining weight also decreased during 2007--2009 (5.9%--5.0%). The percentage of students who vomited or took laxatives to lose weight or to keep from gaining weight did not change significantly during 1995--2003 (4.8%--6.0%) and then decreased during 2003--2009 (6.0%--4.0%).
Other Health-Related Topics
The percentage of students who ever had asthma decreased during 2003--2005 (18.9%--17.1%) and then increased during 2005--2009 (17.1%--22.0%). The percentage of students who ever had asthma also increased during 2007--2009 (20.3%--22.0%). During 1999--2009, a significant linear decrease occurred in the percentage of students who reported routine sunscreen use decreased during 1999--2009 (13.3%--9.3%).
Discussion
YRBSS is the largest public health surveillance system in the United States monitoring a broad range of health-risk behaviors among high school students. In addition to describing the prevalence of health-risk behaviors, YRBSS data are used widely to compare health-risk behavior prevalence among subpopulations of students, assess trends in health-risk behaviors over time, monitor progress toward achieving national health objectives, provide comparable state and local data, and evaluate and improve health-related policies and programs.
Compare Health-Risk Behavior Prevalence Among Student Subpopulations
Variations in health-risk behaviors among subpopulations of high school students as defined by race/ethnicity and sex can be identified with YRBSS data. For example, white high school students were most likely to have been bullied on school property, engaged in current tobacco use and binge drinking, and ever taken prescription drugs without a doctor's prescription; black high school students were most likely to have ever had sexual intercourse, had sexual intercourse with four or more persons, been physically inactive, and used a computer for 3 or more hours per day; and Hispanic high school students were most likely to have ridden with a driver who had been drinking alcohol, seriously considered attempting suicide, and ever used cocaine, inhalants, ecstasy, and methamphetamines. Variations by sex also were observed. Male high school students were more likely than female high school students to have engaged in current frequent cigarette use, smokeless tobacco use, and cigar use; to have ever used marijuana, cocaine, ecstasy, and heroin; and to have had first sexual intercourse before age 13 years and sexual intercourse with four or more persons during their life. Female high school students were more likely than male high school students to have seriously considered attempting suicide, actually attempted suicide, not eaten fruits and vegetables five or more times per day, been physically inactive, and engaged in unhealthy weight control behaviors.
However, this analysis could not isolate the effects of these demographic characteristics from the effects of socioeconomic status (SES) or culture on risk behaviors. In a 1992 national study, after controlling for age, sex, race/ethnicity, and school enrollment status (i.e., in school or out of school), adolescents aged 12--17 years were less likely to report selected risk behaviors (e.g., smoking, physical inactivity, eating too little fruit and vegetables, and binge drinking) as the SES (based on education or family income) of the responsible adult in their family increased (13). Additional research is needed to assess the effect of specific educational, socioeconomic, cultural, and racial/ethnic factors on the prevalence of health-risk behaviors among high school students.
Assessing Trends in Health-Risk Behaviors Over Time
Long-term trends in health-risk behaviors can be assessed using YRBSS data. Since 1991, substantial progress has been made in decreasing the prevalence of many health-risk behaviors among high school students nationwide, including rarely or never wearing a seat belt, riding with a driver who has been drinking alcohol, ever using cigarettes, ever drinking alcohol, and ever having sexual intercourse. However, the percentage of high school students nationwide who are obese increased during 1999--2009 and who use a computer for 3 or more hours per day increased during 2003--2009. Emerging behavior patterns can be detected by examining changes during 2007--2009. For example, one encouraging change was a decrease in the percentage of students who drank soda or pop at least one time per day. However, one concerning change was a decrease in the percentage of students who had ever been taught in school about AIDS or HIV infection.
Monitoring Progress Toward Achieving National Health Objectives
The national YRBS is the primary source of data to measure 15 Healthy People 2010 objectives and three leading health indicators (14). The Healthy People 2010 objectives provided a comprehensive agenda for improving the health of all persons in the United States during the first decade of the 21st century. This report provides the 2010 target and data from the 2009 national YRBS for all 15 objectives (Table 104). The data indicate that as of 2009 only two of the 15 Healthy People 2010 objectives have been achieved. Healthy People 2010 objective 15-38 is to reduce physical fighting among adolescents to at least 32%. In 2009, 31.5% of high school students nationally had been in a physical fight one or more times during the 12 months before the survey. Healthy People 2010 objective 26-6 is to reduce the proportion of adolescents who report that they rode with a driver who had been drinking alcohol to at least 30.0%. In 2009, 28.3% of high school students nationally had ridden in a car or other vehicle driven by someone who had been drinking alcohol during the 30 days before the survey. To obtain certain Healthy People 2010 objectives, substantial progress must still be made. For example, the Healthy People 2010 objective for participation in daily physical education classes is 50%, but as of 2009, only 33.3% of high school students nationally participated in daily physical education classes. To reach the Healthy People 2010 goals, additional support is needed for coordinated, comprehensive school health programs.
Provide Comparable State and Local Data
Because all state and local surveys share similar sampling, questionnaires, data collection, and data-processing procedures, it is possible to compare state and local YRBS data. For the majority of health-risk behaviors, prevalence does not vary substantially across states or across cities. However, across state surveys, a range of 25 or more percentage points or a fivefold variation or greater was identified for the following risk behaviors:
- rarely or never wore a bicycle helmet (minimum: 62.4%; maximum: 94.4%);
- carried a gun (minimum: 1.8%; maximum: 11.5%);
- ever smoked cigarettes (minimum: 23.5%; maximum: 59.0%);
- tried to quit smoking cigarettes (minimum: 38.8%; maximum: 67.4%);
- bought cigarettes in a store or gas station (minimum: 4.5%; maximum: 26.1%);
- ever drank alcohol (minimum: 38.6%; maximum: 76.2%);
- current alcohol use (minimum: 18.2%; maximum: 47.5%);
- Depo-Provera use (minimum: 1.0%; maximum: 7.3%);
- drank soda or pop at least one time per day (minimum: 14.5%; maximum: 41.3%);
- watched television 3 or more hours per day (minimum: 16.3%; maximum: 44.9%);
- attended physical education classes (minimum: 29.1%; maximum: 92.0%); and
- attended physical education classes daily (minimum: 5.4%; maximum: 67.5%).
Across local surveys, a range of 25 or more percentage points or a fivefold variation or greater was identified for the following health-risk behaviors:
- rarely or never wore a seat belt (minimum: 4.1%; maximum: 28.7%);
- rarely or never wore a bicycle helmet (minimum: 51.7%; maximum: 95.8%);
- in a physical fight (minimum: 21.8%; maximum: 49.0%);
- smoked more than 10 cigarettes per day (minimum: 1.6%; maximum: 15.2%);
- tried to quit smoking cigarettes (minimum: 36.9%; maximum: 65.0%);
- ever used marijuana (minimum: 26.5%; maximum: 51.9%;
- ever used heroin (minimum: 1.7%; maximum: 11.1%);
- ever used methamphetamines (minimum: 2.3%; maximum: 12.2%);
- ever had sexual intercourse (minimum: 28.7%; maximum: 63.5%);
- currently sexually active (minimum: 20.5%; maximum: 46.5%);
- Depo-Provera use (minimum: 1.1%; maximum: 12.1%);
- watched television 3 or more hours per day (minimum: 27.7%; maximum: 59.6%);
- attended physical education classes (minimum: 35.5%; maximum: 81.1%); and
- attended physical education classes daily (minimum: 8.4%; maximum: 46.4%).
These variations might occur, in part, because of differences in state and local laws and policies, enforcement practices, access to illegal drugs, availability of effective school and community interventions, prevailing behavioral and social norms, demographic characteristics of the population, and adult practices. Longitudinal research is needed to better understand the effect of these factors on the development and prevalence of health-risk behaviors.
Evaluate and Improve Health-Related Policies and Programs
CDC and other federal agencies use national YRBS data to evaluate components of CDC's Performance Plan in compliance with the Government Performance and Results Act (15) and to evaluate the contribution of HIV prevention and chronic disease prevention efforts toward helping the nation reduce health-risk behaviors among youth.
State and local agencies and nongovernmental organizations use YRBS data to improve health-related policies and programs. For example, Orange County, Florida used YRBS data in posters created for National Latino AIDS Awareness Day, which were distributed to human sexuality education teachers, HIV prevention partners, and health clinics. In Texas, YRBS data on physical activity and obesity were used to support legislation for the Physical Fitness Assessment Initiative, which requires all Texas schools to use the FITNESSGRAM annually to measure the fitness of students in grades 3--12. In Mississippi, the Department of Mental Health used YRBS data to identify underage drinking as a priority health issue. The department applied for and received the Strategic Prevention Framework State Incentive Grant from the Substance Abuse and Mental Health Services Administration and the Center for Substance Abuse Prevention. In Wyoming, YRBS data on alcohol use were used to help keep the minimum legal drinking age at 21 and are being used to support an amendment to a bill addressing underage use and possession of alcohol.
Limitations
The findings in this report are subject to at least three limitations. First, these data apply only to youth who attend school and, therefore, are not representative of all persons in this age group. Nationwide, in 2007, of persons aged 16--17 years, approximately 4% were not enrolled in a high school program and had not completed high school (16). Second, the extent of underreporting or overreporting of behaviors cannot be determined, although the survey questions demonstrate good test-retest reliability (8). Third, BMI is calculated on the basis of self-reported height and weight, and, therefore, tends to underestimate the prevalence of obesity and overweight (17).
Conclusion
The results of this report indicate a need for continued monitoring of health-risk behaviors among high school students nationally and at the state and local levels. In 2009, 42 states and 20 large urban school districts collected YRBS data representative of their high school students attending public schools. Increased support for YRBSS within the five states with unweighted data and expansion of YRBSS among additional large urban school districts will help monitor and ensure effectiveness of public health and school health policies and practices for youth nationwide at both the state and local levels.
References
- CDC, NCHS. Public use data file and documentation: multiple cause of death for ICD-10 2006 data [CD-ROM]. 2009.
- Ventura SJ, Abma JC, Mosher WD, Henshaw SK. Recent trends in teenage pregnancy in the United States, 1990--2002. Health E-stats. Hyattsville, MD: National Center for Health Statistics; 2006.
- Weinstock H, Berman S, Cates W. Sexually transmitted disease among American youth: incidence and prevalence estimates, 2000. Perspect Sex Reprod Health 2004;36:6--10.
- CDC. HIV/AIDS surveillance report, 2007. Vol. 19. Rev ed. Atlanta, GA: US Department of Health and Human Services, CDC; 2009. Available at http://www.cdc.gov/hiv/topics/surveillance/resources/reports/2007report/default.htm.
-
Brener ND, Kann L, Kinchen S, et al. Methodology of the Youth Risk Behavior Surveillance System. MMWR 2004:53(No RR-12).
- MDR National Education Database Master Extract, Shelton, CT: Market Data Retrieval, Inc.: 2007.
- US Department of Education, National Center for Education Statistics. Common Core of Data Public Elementary/Secondary School Universe Survey. Washington, DC: US Department of Education, National Center for Education Statistics. Available at http://nces.ed.gov/ccd.
- Brener ND, Kann L, McManus T, Kinchen SA, Sundberg EC, Ross JG. Reliability of the 1999 Youth Risk Behavior Survey questionnaire. J Adolesc Health 2002;31:336--42.
- Kuczmarski RJ, Ogden CL, Grummer-Strawn LM, et al. CDC growth charts: United States. In: Advance Data from Vital and Health Statistics, no. 314. Hyattsville, MD: National Center for Health Statistics; 2000.
- SAS Institute, Inc. SAS,(r) version 9.2 [software and documentation]. Cary, NC: SAS Institute; 2008.
- Research Triangle Institute. SUDAAN,(r) version 10 [software and documentation]. Triangle Park, NC: Research Triangle Institute; 2008.
- Hinkle DE, Wiersma W, Jurs SG. Applied statistics for the behavioral sciences. 5th ed. Boston, MA: Houghton Mifflin Co.; 2003.
- Lowry R, Kann L, Collins JL, Kolbe LJ. The effect of socioeconomic status on chronic disease risk behaviors among US adolescents. JAMA 1996;276:792--7.
- US Department of Health and Human Services. Healthy people 2010 (conference ed, in 2 vols). Washington, DC: US Department of Health and Human Services; 2000. Available at http://www.healthypeople.gov.
- CDC. FY 2010 Online Performance Annex. Atlanta, GA: US Department of Health and Human Services, CDC; 2009.
- Catalid EF, Laird J, KewalRamani A (2009). High school dropout and completion rates in the United States: 2007 (NCES 2009-064). Washington, DC: National Center for Education Statistics, Institute of Education Sciences, US Department of Education. Available at http://nces.ed.gov/pubsearch/pubsinfo.asp?pubid=2009064. Accessed on January 14, 2010.
- Brener ND, McManus T, Galuska DA, Lowry R, Wechsler H. Reliability and validity of self-reported height and weight among high school students. J Adolesc Health 2003;32:281--7.
State and Local Youth Risk Behavior Survey Coordinators
States: Alabama, Marilyn Lewis, MS, State Department of Education; Alaska, Patricia Owen, Department of Health and Social Services; Arizona, Catherine Osborn, MPA, Department of Education; Arkansas, Kathleen Courtney, MS, Department of Education; Colorado, Karen Connell, MA, Department of Education; Connecticut, Diane Aye, PhD, Department of Public Health; Delaware, Janet Arns Ray, MS, Department of Education; Florida, Jamie Forrest, MS, Department of Health; Georgia, Suparna Bagchi, DrPH, Department of Community Health; Hawaii, Dave Randall, MEd, Department of Education; Idaho, Patricia Stewart, State Department of Education; Illinois, Glenn Steinhausen, PhD, State Board of Education; Indiana, Pamela Pontones, MA, State Department of Health; Kansas, Mark Thompson, PhD, State Department of Education; Kentucky, Stephanie Bunge, MEd, Department of Education; Louisiana, Raegan Carter Jones, MPH, Department of Education; Maine, Jean Zimmerman, MS, Maine Department of Education; Maryland, Richard D. Scott, DMin, State Department of Education; Massachusetts, Chiniqua Milligan, MPH, Department of Elementary and Secondary Education; Michigan, Kim Kovalchick, MPH, Department of Education; Mississippi, Stephanie N. Robinson, MS, Department of Education; Missouri, Craig Rector, Department of Elementary and Secondary Education; Montana, Susan Court, Office of Public Instruction; Nevada, Robinette J. Bacon, Department of Education; New Hampshire, Mary Bubnis, MEd, Department of Education; New Jersey, Thomas R. Collins, PhD, Department of Education; New Mexico, Kristine M. Meurer, PhD, Public Education Department; New York, Owen Donovan, MSE, State Education Department; North Carolina, Nakisha Floyd, MA, Department of Public Instruction; North Dakota, Anita Wirtz, PhD(c), Department of Public Instruction; Oklahoma, Thad Burk, MPH, State Department of Health; Pennsylvania, Shirley A. Black, MEd, Department of Education; Rhode Island, Donald K. Perry, MPA, Department of Health; South Carolina, Delores Pluto, PhD, Department of Education; South Dakota, Amy Beshara, Department of Education; Tennessee, Mark Bloodworth, EdS, Department of Education; Texas, Jennifer Haussler Garing, MS, Department of State Health Services; Utah, Michael Friedrichs, MS, Department of Health; Vermont, Erika M. Edwards, MPH, Department of Health; West Virginia, Rick Deem, MA, Department of Education; Wisconsin, Brian Weaver, MPH, Department of Public Instruction; Wyoming, Nathaniel Castellanos, Department of Education.
Cities/Counties: Boston, Massachusetts, Barbara Huscher Cohen, MEd, Boston Public Schools; Broward County, Florida, Patrick Chalmers, MS, Broward County Public Schools; Charlotte, North Carolina, Nancy A. Langenfeld, MS, Charlotte-Mecklenburg Schools; Chicago, Illinois, Kenneth G. Papineau, MA, Chicago Public Schools; Clark County, Nevada, Mary Pike, MEd, Clark County School District; Dallas, Texas, Angelica Duran Harkins, LMSW, Dallas Independent School District; Detroit, Michigan, Arlene Richardson, EdD, Detroit Public Schools; Duval County, Florida, Kathleen Bowles, MAT, Duval County Public Schools; Los Angeles, California, Timothy Kordic, Los Angeles Unified School District; Memphis, Tennessee, Naina Eshwar, MS, Memphis City Schools; Miami-Dade County, Florida, Rodolfo Abella, PhD, Miami-Dade County Public Schools; Milwaukee, Wisconsin, Brett A. Fuller, MEd, Milwaukee Public Schools; New York City, New York, Kinjia Hinterland, MPH, New York City Department of Health and Mental Hygiene; Orange County, Florida, Brenda Christopher-Muench, Orange County Public Schools; Palm Beach, Florida, Danette Fitzgerald, MS, School District of Palm Beach County; Philadelphia, Pennsylvania, Bettyann Creighton, MEd, School District of Philadelphia; San Bernardino, California, Charlene Davis-Long, San Bernardino City Unified School District; San Diego, California, Marge Kleinsmith-Hildebrand, MS, San Diego Unified School District; San Francisco, California, Kim Levine, MHA, San Francisco Unified School District; Seattle, Washington, Pamela Hillard, MPA, Seattle Schools.
FIGURE. State and local Youth Risk Behavior Surveys --- United States, 2009
Alternate Text: This United States map figure shows the 42 states and 20 cities with weighted data and the five states and three cities with unweighted data for the 2009 Youth Risk Behavior Surveillance System.
|
|
No. of states
|
|
No. of districts
|
|
Year
|
Weighted
|
Unweighted
|
|
Weighted
|
Unweighted
|
|
1991
|
9
|
17
|
|
7
|
4
|
|
1993
|
22
|
18
|
|
9
|
5
|
|
1995
|
22
|
17
|
|
12
|
5
|
|
1997
|
24
|
14
|
|
15
|
2
|
|
1999
|
22
|
19
|
|
14
|
3
|
|
2001
|
22
|
15
|
|
14
|
5
|
|
2003
|
32
|
11
|
|
20
|
2
|
|
2005
|
40
|
4
|
|
21
|
2
|
|
2007
|
39
|
5
|
|
22
|
0
|
|
2009
|
42
|
5
|
|
20
|
3
|
|
|
Student sample size
|
Response rate (%)
|
|
Sex (%)
|
|
Grade (%)
|
|
Race/Ethnicity (%)
|
|
Site
|
School
|
Student
|
Overall
|
|
Female
|
Male
|
|
9
|
10
|
11
|
12
|
|
White†
|
Black†
|
Hispanic
|
Other§
|
|
National survey
|
16,410
|
81
|
88
|
71
|
|
47.8
|
52.2
|
|
28.0
|
26.2
|
23.5
|
22.2
|
|
58.7
|
14.4
|
18.6
|
8.4
|
|
State surveys
|
|
|
|
|
|
|
|
|
|
|
|
|
|
|
|
|
|
|
Alabama
|
1,520
|
91
|
77
|
70
|
|
49.6
|
50.4
|
|
29.7
|
25.8
|
22.8
|
21.4
|
|
58.3
|
36.6
|
2.9
|
2.2
|
|
Alaska
|
1,373
|
91
|
64
|
62
|
|
48.3
|
51.7
|
|
26.8
|
25.2
|
24.9
|
22.4
|
|
54.0
|
2.1
|
6.3
|
37.6
|
|
Arizona
|
2,596
|
92
|
87
|
80
|
|
48.9
|
51.1
|
|
26.2
|
25.6
|
23.9
|
23.8
|
|
46.6
|
4.5
|
38.5
|
10.5
|
|
Arkansas
|
1,690
|
84
|
80
|
67
|
|
49.2
|
50.8
|
|
28.0
|
25.9
|
24.0
|
21.9
|
|
67.9
|
22.8
|
7.0
|
2.3
|
|
Colorado
|
1,511
|
95
|
66
|
62
|
|
48.7
|
51.3
|
|
27.5
|
25.5
|
24.1
|
22.7
|
|
66.2
|
6.1
|
23.2
|
4.5
|
|
Connecticut
|
2,392
|
76
|
84
|
64
|
|
49.1
|
50.9
|
|
27.0
|
25.3
|
24.3
|
23.1
|
|
67.5
|
13.8
|
14.9
|
3.9
|
|
Delaware
|
2,407
|
100
|
76
|
76
|
|
48.9
|
51.1
|
|
30.7
|
26.0
|
22.7
|
20.2
|
|
50.2
|
27.9
|
12.0
|
9.9
|
|
Florida
|
5,664
|
96
|
74
|
71
|
|
49.3
|
50.7
|
|
27.9
|
26.0
|
24.3
|
21.5
|
|
48.1
|
22.9
|
23.5
|
5.4
|
|
Georgia
|
1,882
|
82
|
86
|
70
|
|
49.9
|
50.1
|
|
30.3
|
26.4
|
22.2
|
21.1
|
|
46.8
|
39.9
|
9.9
|
3.4
|
|
Hawaii
|
1,511
|
96
|
66
|
63
|
|
47.8
|
52.2
|
|
30.1
|
25.2
|
21.5
|
22.9
|
|
13.4
|
0.8
|
7.5
|
78.3
|
|
Idaho
|
2,164
|
93
|
84
|
79
|
|
48.4
|
51.6
|
|
26.4
|
25.4
|
24.8
|
23.2
|
|
82.6
|
0.6
|
12.7
|
4.1
|
|
Illinois
|
3,051
|
83
|
80
|
66
|
|
48.8
|
51.2
|
|
27.5
|
26.0
|
23.1
|
23.0
|
|
59.0
|
18.7
|
16.6
|
5.7
|
|
Indiana
|
1,515
|
78
|
78
|
61
|
|
49.0
|
51.0
|
|
26.6
|
25.6
|
24.4
|
23.1
|
|
78.5
|
11.7
|
7.5
|
2.4
|
|
Kansas
|
2,026
|
81
|
87
|
71
|
|
48.6
|
51.4
|
|
26.6
|
25.5
|
24.2
|
23.6
|
|
73.9
|
8.3
|
14.1
|
3.8
|
|
Kentucky
|
1,777
|
97
|
85
|
82
|
|
48.7
|
51.3
|
|
28.1
|
26.1
|
23.7
|
21.8
|
|
85.6
|
11.1
|
1.7
|
1.6
|
|
Louisiana
|
1,035
|
83
|
82
|
68
|
|
51.1
|
48.9
|
|
30.1
|
24.9
|
23.5
|
21.4
|
|
51.8
|
43.2
|
2.5
|
2.6
|
|
Maine
|
9,275
|
78
|
78
|
61
|
|
48.4
|
51.6
|
|
25.1
|
25.1
|
25.3
|
24.1
|
|
94.2
|
0.9
|
2.0
|
3.0
|
|
Maryland
|
1,644
|
100
|
78
|
78
|
|
49.2
|
50.8
|
|
28.5
|
25.1
|
23.6
|
22.6
|
|
47.4
|
38.9
|
7.9
|
5.9
|
|
Massachusetts
|
2,707
|
76
|
85
|
65
|
|
49.1
|
50.9
|
|
27.1
|
24.9
|
24.5
|
23.2
|
|
71.6
|
8.6
|
13.1
|
6.6
|
|
Michigan
|
3,411
|
86
|
80
|
69
|
|
49.3
|
50.7
|
|
27.0
|
25.9
|
23.9
|
23.0
|
|
73.6
|
18.5
|
3.3
|
4.5
|
|
Mississippi
|
1,795
|
82
|
85
|
70
|
|
50.5
|
49.5
|
|
29.6
|
26.9
|
22.7
|
20.6
|
|
45.8
|
51.6
|
0.9
|
1.7
|
|
Missouri
|
1,624
|
80
|
87
|
69
|
|
48.9
|
51.1
|
|
28.4
|
25.9
|
23.5
|
22.0
|
|
75.8
|
18.3
|
2.3
|
3.6
|
|
Montana
|
1,852
|
96
|
82
|
79
|
|
48.4
|
51.6
|
|
26.7
|
25.1
|
24.3
|
23.6
|
|
85.5
|
0.3
|
2.2
|
12.0
|
|
Nevada
|
2,085
|
91
|
71
|
64
|
|
48.8
|
51.2
|
|
33.1
|
27.5
|
20.8
|
18.4
|
|
44.9
|
12.0
|
33.0
|
10.0
|
|
New Hampshire
|
1,493
|
78
|
83
|
64
|
|
48.7
|
51.3
|
|
26.9
|
24.7
|
24.5
|
23.6
|
|
92.9
|
0.6
|
2.8
|
3.7
|
|
New Jersey
|
1,756
|
87
|
76
|
66
|
|
49.7
|
50.3
|
|
26.4
|
25.3
|
24.5
|
23.6
|
|
58.2
|
16.5
|
17.3
|
8.0
|
|
New Mexico
|
5,047
|
96
|
70
|
67
|
|
49.1
|
50.9
|
|
29.8
|
27.0
|
22.7
|
20.1
|
|
30.0
|
1.3
|
53.6
|
15.2
|
|
New York
|
14,870
|
90
|
81
|
73
|
|
49.8
|
50.2
|
|
27.8
|
26.6
|
23.2
|
22.3
|
|
54.2
|
18.2
|
19.5
|
8.1
|
|
North Carolina
|
5,702
|
73
|
82
|
60
|
|
51.3
|
48.7
|
|
31.2
|
25.3
|
22.8
|
20.6
|
|
56.9
|
31.9
|
5.1
|
6.1
|
|
North Dakota
|
1,838
|
97
|
86
|
83
|
|
48.5
|
51.5
|
|
24.6
|
25.4
|
24.5
|
24.6
|
|
86.1
|
0.7
|
2.2
|
10.9
|
|
Oklahoma
|
1,413
|
86
|
81
|
69
|
|
49.1
|
50.9
|
|
27.5
|
26.4
|
23.9
|
22.1
|
|
60.8
|
10.5
|
4.8
|
23.9
|
|
Pennsylvania
|
2,080
|
78
|
85
|
67
|
|
48.8
|
51.2
|
|
26.6
|
25.7
|
24.1
|
23.5
|
|
73.9
|
16.0
|
6.9
|
3.1
|
|
Rhode Island
|
3,213
|
92
|
73
|
67
|
|
49.3
|
50.7
|
|
30.1
|
25.7
|
22.6
|
21.3
|
|
67.9
|
9.7
|
18.5
|
3.9
|
|
South Carolina
|
1,108
|
76
|
82
|
62
|
|
49.9
|
50.1
|
|
30.0
|
26.1
|
22.2
|
21.3
|
|
54.1
|
38.8
|
3.4
|
3.7
|
|
South Dakota
|
2,170
|
92
|
85
|
78
|
|
48.6
|
51.4
|
|
27.1
|
26.1
|
23.9
|
22.6
|
|
80.7
|
0.8
|
2.1
|
16.3
|
|
Tennessee
|
2,220
|
95
|
83
|
78
|
|
49.0
|
51.0
|
|
27.3
|
25.9
|
23.9
|
22.8
|
|
69.0
|
25.5
|
2.8
|
2.7
|
|
Texas
|
3,506
|
87
|
90
|
78
|
|
49.0
|
51.0
|
|
30.6
|
25.6
|
22.6
|
21.1
|
|
38.5
|
14.9
|
42.8
|
3.7
|
|
Utah
|
1,598
|
95
|
65
|
61
|
|
48.5
|
51.5
|
|
25.2
|
24.9
|
25.0
|
24.4
|
|
80.1
|
0.8
|
13.0
|
6.0
|
|
Vermont
|
9,572
|
100
|
68
|
68
|
|
48.8
|
51.2
|
|
25.0
|
26.4
|
23.8
|
24.2
|
|
93.2
|
1.0
|
1.9
|
3.9
|
|
West Virginia
|
1,670
|
97
|
82
|
79
|
|
48.8
|
51.2
|
|
28.6
|
25.0
|
23.4
|
22.8
|
|
93.3
|
5.0
|
0.8
|
0.9
|
|
Wisconsin
|
2,434
|
89
|
88
|
79
|
|
48.7
|
51.3
|
|
25.3
|
24.4
|
25.1
|
24.9
|
|
79.4
|
9.4
|
6.2
|
5.1
|
|
Wyoming
|
2,902
|
94
|
85
|
80
|
|
48.2
|
51.8
|
|
26.4
|
26.1
|
23.9
|
23.1
|
|
85.0
|
1.1
|
9.3
|
4.6
|
|
Local surveys
|
|
|
|
|
|
|
|
|
|
|
|
|
|
|
|
|
|
|
Boston, MA
|
1,301
|
100
|
77
|
77
|
|
49.8
|
50.2
|
|
28.0
|
24.2
|
22.7
|
24.4
|
|
13.9
|
42.2
|
32.7
|
11.1
|
|
Broward County,FL
|
1,526
|
93
|
76
|
71
|
|
49.8
|
50.2
|
|
27.0
|
25.8
|
23.9
|
23.0
|
|
31.2
|
37.9
|
25.3
|
5.7
|
|
Charlotte-Mecklenburg, NC
|
1,713
|
100
|
86
|
86
|
|
50.6
|
49.4
|
|
32.8
|
24.9
|
21.6
|
20.5
|
|
35.9
|
45.0
|
14.6
|
4.5
|
|
Chicago, IL
|
1,292
|
97
|
69
|
67
|
|
48.2
|
51.8
|
|
29.7
|
27.3
|
21.4
|
19.9
|
|
8.8
|
50.8
|
36.0
|
4.3
|
|
Clark County, NV
|
1,461
|
98
|
66
|
64
|
|
48.6
|
51.4
|
|
33.7
|
27.5
|
19.9
|
18.7
|
|
37.2
|
15.3
|
36.6
|
10.9
|
|
Dallas, TX
|
965
|
100
|
61
|
61
|
|
50.6
|
49.4
|
|
34.1
|
25.2
|
21.5
|
19.1
|
|
5.6
|
32.7
|
60.2
|
1.5
|
|
Detroit, MI
|
1,457
|
100
|
94
|
94
|
|
49.3
|
50.7
|
|
32.7
|
28.2
|
21.0
|
17.9
|
|
0.6
|
90.8
|
5.5
|
3.0
|
|
Duval County, FL
|
2,513
|
100
|
71
|
71
|
|
50.9
|
49.1
|
|
28.5
|
26.7
|
22.9
|
21.2
|
|
41.9
|
44.5
|
6.7
|
6.9
|
|
Los Angeles, CA
|
1,927
|
100
|
88
|
88
|
|
48.3
|
51.7
|
|
34.9
|
25.7
|
21.3
|
18.0
|
|
6.5
|
9.8
|
76.6
|
7.0
|
|
Memphis, TN
|
1,171
|
97
|
70
|
68
|
|
51.1
|
48.9
|
|
30.0
|
25.8
|
22.3
|
22.0
|
|
6.8
|
88.4
|
2.2
|
2.6
|
|
Miami-Dade County,FL
|
2,256
|
100
|
81
|
81
|
|
49.9
|
50.1
|
|
24.9
|
28.2
|
23.8
|
22.6
|
|
9.4
|
25.5
|
62.7
|
2.5
|
|
Milwaukee, WI
|
1,841
|
100
|
66
|
66
|
|
50.1
|
49.9
|
|
33.1
|
23.1
|
24.5
|
19.3
|
|
12.4
|
63.7
|
18.3
|
5.6
|
|
New York City, NY
|
11,887
|
95
|
83
|
79
|
|
52.2
|
47.8
|
|
30.5
|
27.9
|
21.5
|
19.6
|
|
13.9
|
34.9
|
34.9
|
16.3
|
|
Orange County, FL
|
1,339
|
100
|
84
|
84
|
|
49.7
|
50.3
|
|
27.3
|
26.8
|
23.3
|
22.3
|
|
36.1
|
26.8
|
34.0
|
3.2
|
|
Palm Beach County, FL
|
2,087
|
96
|
80
|
77
|
|
49.7
|
50.3
|
|
25.8
|
25.9
|
23.9
|
23.6
|
|
41.7
|
28.5
|
22.9
|
7.0
|
|
Philadelphia, PA
|
1,328
|
100
|
77
|
77
|
|
51.5
|
48.5
|
|
30.9
|
27.1
|
21.5
|
20.4
|
|
12.7
|
64.8
|
14.2
|
8.2
|
|
San Bernardino, CA
|
1,300
|
100
|
79
|
79
|
|
49.2
|
50.8
|
|
29.2
|
27.1
|
24.0
|
19.6
|
|
12.9
|
15.7
|
66.2
|
5.2
|
|
San Diego, CA
|
1,667
|
100
|
90
|
90
|
|
49.1
|
50.9
|
|
29.7
|
27.5
|
23.0
|
19.6
|
|
24.9
|
13.0
|
43.0
|
19.0
|
|
San Francisco, CA
|
2,154
|
100
|
84
|
84
|
|
49.2
|
50.8
|
|
26.7
|
25.5
|
24.1
|
23.4
|
|
7.7
|
9.0
|
19.4
|
63.9
|
|
Seattle, WA
|
1,821
|
100
|
81
|
81
|
|
48.2
|
51.8
|
|
30.0
|
24.8
|
22.6
|
22.1
|
|
39.5
|
22.5
|
6.1
|
32.0
|
|
|
Rarely or never wore a seat belt
|
|
Rarely or never wore a bicycle helmet
|
|
|
Female
|
Male
|
Total
|
|
Female
|
Male
|
Total
|
|
Category
|
%
|
CI§
|
%
|
CI
|
%
|
CI
|
|
%
|
CI
|
%
|
CI
|
%
|
CI
|
|
Race/Ethnicity
|
|
|
|
|
|
|
|
|
|
|
|
|
|
|
White¶
|
7.6
|
5.4--10.4
|
11.2
|
8.7--14.4
|
9.5
|
7.5--12.1
|
|
80.2
|
75.3--84.4
|
83.9
|
77.8--88.6
|
82.3
|
77.7--86.1
|
|
Black¶
|
8.3
|
5.9--11.5
|
14.8
|
11.6--18.7
|
11.7
|
9.1--14.8
|
|
92.7
|
89.8--94.9
|
92.9
|
90.2--94.9
|
92.8
|
90.9--94.3
|
|
Hispanic
|
7.8
|
6.5--9.3
|
9.8
|
7.7--12.3
|
8.8
|
7.5--10.3
|
|
88.4
|
86.1--90.4
|
89.7
|
87.2--91.8
|
89.1
|
87.0--91.0
|
|
Grade
|
|
|
|
|
|
|
|
|
|
|
|
|
|
|
9
|
9.8
|
7.8--12.1
|
11.2
|
8.7--14.4
|
10.6
|
8.7--12.8
|
|
85.3
|
81.4--88.4
|
84.2
|
78.2--88.8
|
84.7
|
80.1--88.3
|
|
10
|
6.8
|
4.9--9.3
|
11.7
|
9.3--14.6
|
9.4
|
7.6--11.6
|
|
82.8
|
77.8--86.9
|
86.9
|
77.4--92.8
|
85.2
|
79.4--89.6
|
|
11
|
6.0
|
4.6--7.9
|
11.2
|
8.7--14.3
|
8.7
|
7.0--10.8
|
|
83.4
|
77.3--88.1
|
87.9
|
84.3--90.8
|
85.9
|
82.0--89.1
|
|
12
|
8.0
|
5.7--11.0
|
12.0
|
9.7--14.8
|
10.1
|
8.3--12.1
|
|
79.4
|
74.3--83.8
|
84.1
|
78.9--88.2
|
82.1
|
77.7--85.7
|
|
Total
|
7.7
|
6.3--9.4
|
11.5
|
9.6--13.8
|
9.7
|
8.2--11.4
|
|
83.1
|
79.5--86.2
|
85.8
|
81.4--89.3
|
84.7
|
81.2--87.6
|
|
|
Rarely or never wore a seat belt
|
|
Rarely or never wore a bicycle helmet
|
|
|
Female
|
Male
|
Total
|
|
Female
|
Male
|
Total
|
|
Site
|
%
|
CI§
|
%
|
CI
|
%
|
CI
|
|
%
|
CI
|
%
|
CI
|
%
|
CI
|
|
State surveys
|
|
|
|
|
|
|
|
|
|
|
|
|
|
|
Alabama
|
8.9
|
6.3--12.4
|
16.6
|
13.3--20.6
|
12.9
|
10.8--15.3
|
|
88.3
|
83.8--91.7
|
88.7
|
85.0--91.5
|
88.3
|
85.0--91.0
|
|
Alaska
|
10.7
|
7.4--15.2
|
13.4
|
9.8--18.0
|
12.1
|
9.1--16.0
|
|
66.9
|
61.2--72.2
|
76.7
|
72.2--80.7
|
72.5
|
68.3--76.2
|
|
Arizona
|
11.7
|
9.0--15.0
|
15.2
|
12.0--18.9
|
13.4
|
10.7--16.7
|
|
89.6
|
85.3--92.7
|
92.6
|
88.7--95.2
|
91.2
|
87.9--93.7
|
|
Arkansas
|
13.9
|
10.7--17.8
|
23.4
|
17.5--30.5
|
18.7
|
14.4--24.0
|
|
89.5
|
83.4--93.5
|
90.8
|
86.7--93.7
|
90.1
|
86.5--92.8
|
|
Colorado
|
5.5
|
3.4--8.7
|
9.7
|
6.9--13.4
|
7.6
|
5.4--10.6
|
|
71.9
|
62.7--79.5
|
77.7
|
70.3--83.7
|
75.2
|
68.1--81.1
|
|
Connecticut
|
8.5
|
7.1--10.1
|
10.0
|
8.2--12.1
|
9.4
|
8.2--10.7
|
|
---¶
|
---
|
---
|
---
|
---
|
---
|
|
Delaware
|
4.8
|
3.7--6.3
|
7.2
|
5.5--9.4
|
6.3
|
5.1--7.7
|
|
82.6
|
78.1--86.4
|
89.5
|
86.8--91.6
|
86.7
|
83.9--89.1
|
|
Florida
|
9.0
|
7.7--10.5
|
13.8
|
11.8--16.0
|
11.6
|
10.3--13.0
|
|
90.3
|
88.6--91.7
|
91.4
|
89.7--92.9
|
91.0
|
89.8--92.1
|
|
Georgia
|
6.9
|
5.0--9.5
|
12.6
|
9.9--16.0
|
9.9
|
7.8--12.4
|
|
87.7
|
83.3--91.1
|
86.9
|
84.5--89.0
|
87.3
|
85.3--89.0
|
|
Hawaii
|
---
|
---
|
---
|
---
|
---
|
---
|
|
87.0
|
77.5--92.9
|
89.5
|
81.7--94.1
|
88.5
|
81.8--92.9
|
|
Idaho
|
5.6
|
4.4--7.2
|
11.4
|
9.6--13.5
|
8.6
|
7.5--9.8
|
|
85.4
|
82.7--87.8
|
84.5
|
81.0--87.4
|
84.9
|
82.8--86.9
|
|
Illinois
|
4.9
|
3.6--6.6
|
11.4
|
9.4--13.9
|
8.3
|
7.0--9.8
|
|
91.7
|
87.1--94.8
|
93.1
|
89.2--95.7
|
92.4
|
88.5--95.0
|
|
Indiana
|
5.7
|
3.8--8.5
|
8.5
|
6.6--10.8
|
7.1
|
5.6--8.9
|
|
92.8
|
88.3--95.6
|
90.1
|
84.5--93.8
|
91.3
|
86.9--94.4
|
|
Kansas
|
9.7
|
7.3--12.9
|
12.4
|
9.9--15.4
|
11.2
|
9.0--13.8
|
|
83.7
|
77.8--88.3
|
88.3
|
83.4--91.9
|
86.3
|
81.8--89.8
|
|
Kentucky
|
7.8
|
5.8--10.4
|
18.6
|
14.6--23.5
|
13.4
|
10.8--16.4
|
|
90.6
|
84.3--94.5
|
93.4
|
89.5--95.9
|
92.1
|
87.6--95.1
|
|
Louisiana
|
9.1
|
6.5--12.5
|
16.7
|
12.6--21.9
|
12.8
|
10.3--15.8
|
|
92.4
|
88.4--95.1
|
93.5
|
87.1--96.8
|
92.9
|
88.9--95.5
|
|
Maine
|
---
|
---
|
---
|
---
|
---
|
---
|
|
68.2
|
66.3--70.0
|
74.2
|
72.5--75.9
|
71.7
|
70.3--73.0
|
|
Maryland
|
6.2
|
4.4--8.7
|
10.0
|
8.0--12.5
|
8.2
|
6.7--10.0
|
|
80.4
|
73.2--86.1
|
86.5
|
80.6--90.9
|
83.8
|
78.1--88.2
|
|
Massachusetts
|
10.5
|
8.4--12.9
|
17.2
|
14.3--20.6
|
13.9
|
11.7--16.5
|
|
---
|
---
|
---
|
---
|
---
|
---
|
|
Michigan
|
5.4
|
3.8--7.7
|
9.9
|
8.1--11.9
|
7.8
|
6.2--9.9
|
|
86.8
|
82.3--90.2
|
89.4
|
86.3--91.9
|
88.1
|
84.7--90.9
|
|
Mississippi
|
11.9
|
9.2--15.3
|
19.1
|
15.4--23.3
|
15.5
|
12.6--18.9
|
|
94.2
|
92.2--95.7
|
94.5
|
90.9--96.7
|
94.4
|
92.4--95.9
|
|
Missouri
|
8.6
|
6.9--10.8
|
15.1
|
11.3--19.9
|
11.9
|
9.6--14.7
|
|
77.4
|
69.7--83.6
|
83.8
|
77.3--88.8
|
81.3
|
74.4--86.6
|
|
Montana
|
10.5
|
7.6--14.3
|
15.5
|
11.5--20.5
|
13.1
|
10.2--16.6
|
|
81.5
|
75.7--86.2
|
83.7
|
78.9--87.6
|
82.7
|
78.4--86.3
|
|
Nevada
|
8.2
|
6.3--10.5
|
9.8
|
7.7--12.5
|
9.0
|
7.6--10.6
|
|
---
|
---
|
---
|
---
|
---
|
---
|
|
New Hampshire
|
11.4
|
8.5--15.2
|
14.0
|
10.6--18.4
|
12.9
|
10.5--15.7
|
|
57.0
|
50.1--63.8
|
66.3
|
60.6--71.6
|
62.4
|
56.9--67.5
|
|
New Jersey
|
5.3
|
3.5--7.9
|
11.0
|
8.2--14.5
|
8.2
|
6.3--10.7
|
|
---
|
---
|
---
|
---
|
---
|
---
|
|
New Mexico
|
6.3
|
4.8--8.1
|
10.3
|
8.5--12.3
|
8.3
|
6.8--10.1
|
|
91.4
|
86.9--94.5
|
91.2
|
89.4--92.7
|
91.3
|
88.8--93.3
|
|
New York
|
11.0
|
8.7--13.8
|
14.2
|
12.5--16.0
|
12.8
|
10.9--15.1
|
|
76.4
|
71.2--81.0
|
83.9
|
79.4--87.6
|
80.5
|
76.1--84.3
|
|
North Carolina
|
6.2
|
5.0--7.7
|
7.8
|
6.1--9.9
|
7.0
|
5.8--8.5
|
|
82.1
|
76.4--86.7
|
85.7
|
80.5--89.7
|
84.1
|
79.1--88.1
|
|
North Dakota
|
12.2
|
9.9--15.0
|
21.2
|
17.4--25.6
|
17.0
|
14.7--19.6
|
|
---
|
---
|
---
|
---
|
---
|
---
|
|
Oklahoma
|
6.0
|
4.0--8.7
|
11.1
|
8.0--15.2
|
8.6
|
6.4--11.5
|
|
93.5
|
88.2--96.5
|
93.9
|
91.9--95.4
|
93.8
|
91.4--95.5
|
|
Pennsylvania
|
10.2
|
7.3--14.3
|
14.9
|
11.4--19.2
|
12.6
|
10.1--15.7
|
|
80.8
|
74.8--85.7
|
86.1
|
81.8--89.5
|
83.8
|
79.6--87.2
|
|
Rhode Island
|
9.9
|
7.7--12.5
|
16.0
|
13.0--19.5
|
13.1
|
10.7--15.8
|
|
81.1
|
74.7--86.1
|
82.8
|
74.7--88.7
|
82.1
|
75.2--87.4
|
|
South Carolina
|
8.3
|
5.7--12.0
|
13.3
|
10.2--17.0
|
10.8
|
8.3--13.9
|
|
92.3
|
87.5--95.4
|
93.0
|
89.3--95.5
|
92.6
|
89.5--94.8
|
|
South Dakota
|
12.1
|
8.4--17.2
|
23.7
|
19.2--28.8
|
18.0
|
14.1--22.7
|
|
---
|
---
|
---
|
---
|
---
|
---
|
|
Tennessee
|
5.5
|
4.0--7.6
|
13.5
|
10.6--17.0
|
9.6
|
7.5--12.2
|
|
90.1
|
86.1--93.1
|
92.3
|
89.9--94.2
|
91.3
|
89.0--93.2
|
|
Texas
|
4.9
|
3.8--6.3
|
6.4
|
5.1--8.0
|
5.7
|
4.9--6.6
|
|
90.3
|
85.4--93.7
|
92.8
|
90.2--94.8
|
91.8
|
88.7--94.1
|
|
Utah
|
5.4
|
4.1--7.1
|
9.8
|
6.8--13.8
|
7.7
|
5.8--10.0
|
|
75.7
|
71.5--79.5
|
77.3
|
70.5--83.0
|
76.6
|
71.6--80.9
|
|
Vermont
|
5.9
|
4.9--7.0
|
10.2
|
8.5--12.1
|
8.3
|
7.2--9.6
|
|
59.7
|
55.0--64.2
|
67.3
|
63.1--71.3
|
64.0
|
59.7--68.2
|
|
West Virginia
|
11.5
|
8.7--15.0
|
16.0
|
13.2--19.4
|
14.0
|
11.7--16.6
|
|
85.2
|
81.0--88.6
|
87.1
|
81.3--91.4
|
86.1
|
82.1--89.3
|
|
Wisconsin
|
11.4
|
9.5--13.6
|
17.7
|
14.9--20.9
|
14.6
|
12.6--16.8
|
|
---
|
---
|
---
|
---
|
---
|
---
|
|
Wyoming
|
12.3
|
10.3--14.7
|
20.4
|
18.0--23.0
|
16.5
|
14.9--18.2
|
|
81.8
|
78.4--84.7
|
85.5
|
82.6--87.9
|
84.0
|
82.0--85.8
|
|
Median
|
8.5
|
13.4
|
11.4
|
|
85.4
|
88.3
|
86.7
|
|
Range
|
4.8--13.9
|
6.4--23.7
|
5.7--18.7
|
|
57.0--94.2
|
66.3--94.5
|
62.4--94.4
|
|
Local surveys
|
|
|
|
|
|
|
|
|
|
|
|
|
|
|
Boston, MA
|
17.2
|
14.3--20.4
|
25.4
|
20.8--30.6
|
21.2
|
18.6--24.0
|
|
85.9
|
81.4--89.4
|
89.4
|
85.2--92.5
|
87.9
|
84.9--90.3
|
|
Broward County, FL
|
10.1
|
7.6--13.2
|
13.1
|
10.9--15.7
|
11.6
|
9.9--13.6
|
|
86.5
|
82.2--89.9
|
90.8
|
88.2--92.9
|
88.9
|
86.5--91.0
|
|
Charlotte-Mecklenburg, NC
|
7.3
|
5.4--9.8
|
8.1
|
6.2--10.6
|
7.8
|
6.2--9.7
|
|
79.3
|
74.1--83.8
|
86.1
|
81.8--89.6
|
83.3
|
80.0--86.2
|
|
Chicago, IL
|
8.3
|
6.2--11.0
|
15.1
|
11.3--19.9
|
12.3
|
9.7--15.4
|
|
92.0
|
87.2--95.1
|
92.9
|
86.3--96.4
|
91.5
|
87.5--94.3
|
|
Clark County, NV
|
8.0
|
5.7--11.1
|
10.7
|
7.8--14.6
|
9.4
|
7.6--11.6
|
|
---
|
---
|
---
|
---
|
---
|
---
|
|
Dallas, TX
|
4.6
|
2.9--7.1
|
9.8
|
7.0--13.6
|
7.1
|
5.2--9.8
|
|
90.9
|
84.1--95.0
|
95.3
|
91.3--97.5
|
93.4
|
90.0--95.7
|
|
Detroit, MI
|
7.4
|
5.6--9.8
|
12.8
|
9.6--17.0
|
10.2
|
8.0--13.0
|
|
96.3
|
94.4--97.6
|
95.4
|
92.2--97.3
|
95.8
|
94.0--97.1
|
|
Duval County, FL
|
12.8
|
10.8--15.0
|
18.8
|
16.4--21.5
|
16.1
|
14.2--18.0
|
|
88.0
|
85.0--90.5
|
90.3
|
87.8--92.4
|
88.9
|
87.0--90.6
|
|
Los Angeles, CA
|
6.5
|
4.7--8.8
|
6.8
|
5.0--9.2
|
6.7
|
5.4--8.2
|
|
85.7
|
81.9--88.8
|
90.3
|
86.2--93.3
|
88.4
|
86.1--90.4
|
|
Memphis, TN
|
7.6
|
4.8--11.8
|
12.5
|
9.6--16.2
|
10.0
|
7.7--12.9
|
|
88.6
|
85.4--91.2
|
92.9
|
89.7--95.2
|
91.0
|
88.6--93.0
|
|
Miami-Dade County, FL
|
11.5
|
9.2--14.2
|
17.1
|
13.8--21.1
|
14.3
|
12.2--16.7
|
|
89.9
|
86.2--92.6
|
94.2
|
91.7--96.0
|
92.4
|
90.1--94.3
|
|
Milwaukee, WI
|
23.3
|
19.9--27.2
|
34.1
|
30.0--38.4
|
28.7
|
25.7--31.8
|
|
---
|
---
|
---
|
---
|
---
|
---
|
|
New York City, NY
|
15.1
|
13.4--16.9
|
15.9
|
14.0--18.1
|
15.5
|
14.1--17.0
|
|
86.4
|
84.5--88.2
|
91.2
|
90.0--92.4
|
89.1
|
87.8--90.2
|
|
Orange County, FL
|
11.5
|
8.8--14.9
|
12.6
|
10.0--15.8
|
12.1
|
9.8--14.7
|
|
87.1
|
81.6--91.1
|
89.6
|
85.4--92.7
|
88.4
|
85.7--90.7
|
|
Palm Beach County, FL
|
8.4
|
6.6--10.5
|
14.7
|
12.2--17.6
|
11.7
|
10.1--13.6
|
|
89.7
|
87.3--91.7
|
90.0
|
87.0--92.3
|
89.9
|
87.8--91.6
|
|
Philadelphia, PA
|
23.0
|
20.0--26.2
|
26.4
|
21.8--31.6
|
24.8
|
22.2--27.6
|
|
90.7
|
85.8--94.0
|
93.5
|
88.5--96.5
|
92.3
|
88.1--95.1
|
|
San Bernardino, CA
|
5.7
|
4.1--7.8
|
7.7
|
5.7--10.3
|
6.7
|
5.3--8.4
|
|
88.1
|
83.9--91.3
|
90.7
|
86.9--93.5
|
89.7
|
87.2--91.8
|
|
San Diego, CA
|
4.2
|
2.9--6.1
|
4.1
|
3.0--5.5
|
4.1
|
3.1--5.4
|
|
73.6
|
69.0--77.8
|
79.2
|
73.5--83.9
|
77.0
|
73.4--80.2
|
|
San Francisco, CA
|
5.0
|
3.6--6.9
|
9.1
|
7.3--11.2
|
7.3
|
6.0--8.9
|
|
---
|
---
|
---
|
---
|
---
|
---
|
|
Seattle, WA
|
5.5
|
4.2--7.3
|
7.1
|
5.1--9.9
|
6.8
|
5.4--8.4
|
|
41.7
|
35.8--47.9
|
58.6
|
52.9--64.0
|
51.7
|
46.9--56.5
|
|
Median
|
8.1
|
12.7
|
10.9
|
|
88.0
|
90.7
|
89.1
|
|
Range
|
4.2--23.3
|
4.1--34.1
|
4.1--28.7
|
|
41.7--96.3
|
58.6--95.4
|
51.7--95.8
|
|
|
Female
|
Male
|
Total
|
|
Category
|
%
|
CI†
|
%
|
CI
|
%
|
CI
|
|
Race/Ethnicity
|
|
|
|
|
|
|
|
White§
|
16.0
|
12.7--19.8
|
30.6
|
26.7--34.7
|
24.6
|
21.6--27.9
|
|
Black§
|
40.5
|
30.3--51.6
|
53.9
|
43.2--64.3
|
49.0
|
41.7--56.3
|
|
Hispanic
|
46.1
|
39.1--53.3
|
49.7
|
43.4--56.0
|
48.3
|
42.3--54.4
|
|
Grade
|
|
|
|
|
|
|
|
9
|
34.2
|
28.0--41.0
|
41.0
|
34.7--47.7
|
38.6
|
33.9--43.6
|
|
10
|
21.4
|
15.8--28.2
|
35.3
|
29.0--42.1
|
29.8
|
25.5--34.6
|
|
11
|
20.4
|
15.1--27.0
|
35.1
|
29.1--41.6
|
28.9
|
24.1--34.2
|
|
12
|
20.5
|
14.4--28.2
|
34.0
|
28.5--40.0
|
28.2
|
23.0--34.1
|
|
Total
|
24.3
|
20.6--28.5
|
36.8
|
32.7--41.1
|
31.9
|
28.4--35.5
|
|
|
Rode with a driver who had been drinking alcohol
|
|
Drove when drinking alcohol
|
|
|
Female
|
Male
|
Total
|
|
Female
|
Male
|
Total
|
|
Category
|
%
|
CI†
|
%
|
CI
|
%
|
CI
|
|
%
|
CI
|
%
|
CI
|
%
|
CI
|
|
Race/Ethnicity
|
|
|
|
|
|
|
|
|
|
|
|
|
|
|
White§
|
26.9
|
24.5--29.5
|
25.5
|
23.2--28.0
|
26.2
|
24.1--28.4
|
|
8.7
|
7.5--10.0
|
12.7
|
11.0--14.6
|
10.8
|
9.6--12.2
|
|
Black§
|
28.7
|
25.3--32.3
|
31.2
|
27.4--35.2
|
30.0
|
27.0--33.2
|
|
4.1
|
2.5--6.7
|
8.7
|
6.4--11.8
|
6.4
|
4.6--9.0
|
|
Hispanic
|
34.9
|
32.4--37.5
|
33.5
|
30.3--36.9
|
34.2
|
31.8--36.7
|
|
7.9
|
6.6--9.4
|
11.0
|
9.3--12.9
|
9.4
|
8.3--10.7
|
|
Grade
|
|
|
|
|
|
|
|
|
|
|
|
|
|
|
9
|
30.0
|
27.3--32.8
|
25.3
|
23.0--27.8
|
27.5
|
25.4--29.6
|
|
4.8
|
3.7--6.2
|
5.1
|
4.0--6.5
|
5.0
|
4.2--5.9
|
|
10
|
27.6
|
24.7--30.6
|
28.3
|
25.0--31.9
|
28.0
|
25.7--30.3
|
|
5.3
|
4.2--6.6
|
11.0
|
9.1--13.4
|
8.3
|
7.1--9.7
|
|
11
|
29.6
|
26.6--32.8
|
29.2
|
26.2--32.4
|
29.4
|
26.9--32.0
|
|
9.6
|
7.6--12.0
|
13.0
|
10.5--16.1
|
11.4
|
9.5--13.7
|
|
12
|
27.9
|
25.1--30.8
|
28.6
|
25.3--32.0
|
28.2
|
25.8--30.8
|
|
11.4
|
9.8--13.3
|
19.3
|
16.7--22.3
|
15.4
|
13.5--17.6
|
|
Total
|
28.8
|
27.1--30.6
|
27.8
|
26.0--29.6
|
28.3
|
26.7--29.9
|
|
7.6
|
6.8--8.6
|
11.6
|
10.3--13.1
|
9.7
|
8.7--10.8
|
|
|
Rode with a driver who had been drinking alcohol
|
|
Drove when drinking alcohol
|
|
|
Female
|
Male
|
Total
|
|
Female
|
Male
|
Total
|
|
Site
|
%
|
CI†
|
%
|
CI
|
%
|
CI
|
|
%
|
CI
|
%
|
CI
|
%
|
CI
|
|
State surveys
|
|
|
|
|
|
|
|
|
|
|
|
|
|
|
Alabama
|
33.1
|
28.1--38.4
|
30.5
|
27.3--33.8
|
32.0
|
28.9--35.2
|
|
10.1
|
8.1--12.5
|
14.1
|
11.7--16.9
|
12.3
|
10.5--14.4
|
|
Alaska
|
22.7
|
19.3--26.4
|
19.7
|
16.7--23.1
|
21.3
|
18.9--23.9
|
|
6.9
|
4.8--9.8
|
10.7
|
8.0--14.2
|
8.9
|
7.3--10.9
|
|
Arizona
|
---§
|
---
|
---
|
---
|
---
|
---
|
|
7.8
|
6.0--10.2
|
13.8
|
11.1--17.1
|
11.0
|
9.2--13.1
|
|
Arkansas
|
28.0
|
22.9--33.7
|
28.3
|
24.0--33.1
|
28.3
|
24.5--32.4
|
|
10.9
|
8.3--14.1
|
13.8
|
10.0--18.7
|
12.5
|
10.0--15.4
|
|
Colorado
|
25.9
|
21.2--31.1
|
23.4
|
20.5--26.5
|
24.6
|
21.9--27.5
|
|
7.0
|
5.6--8.9
|
7.8
|
5.5--10.9
|
7.4
|
6.0--9.2
|
|
Connecticut
|
28.2
|
24.7--32.0
|
24.9
|
21.8--28.2
|
26.7
|
23.8--29.7
|
|
6.6
|
4.7--9.2
|
10.5
|
7.9--13.8
|
8.7
|
6.7--11.2
|
|
Delaware
|
28.6
|
26.2--31.2
|
28.6
|
25.5--32.0
|
28.6
|
26.5--30.9
|
|
7.7
|
6.0--9.8
|
9.2
|
7.2--11.7
|
8.5
|
7.0--10.2
|
|
Florida
|
29.2
|
27.2--31.2
|
26.3
|
24.3--28.4
|
27.6
|
26.1--29.2
|
|
---
|
---
|
---
|
---
|
---
|
---
|
|
Georgia
|
20.9
|
17.8--24.3
|
19.9
|
16.4--24.0
|
20.4
|
17.7--23.4
|
|
5.9
|
4.1--8.3
|
8.0
|
6.1--10.5
|
7.0
|
5.4--8.9
|
|
Hawaii
|
40.7
|
32.8--49.2
|
33.4
|
27.4--39.9
|
37.1
|
31.1--43.4
|
|
13.8
|
8.2--22.4
|
10.5
|
7.2--15.0
|
12.2
|
8.4--17.3
|
|
Idaho
|
22.0
|
19.4--25.0
|
22.3
|
19.6--25.2
|
22.2
|
20.1--24.5
|
|
7.4
|
5.5--9.8
|
11.4
|
9.1--14.1
|
9.5
|
7.8--11.5
|
|
Illinois
|
28.5
|
24.9--32.5
|
29.3
|
26.3--32.5
|
29.0
|
26.2--32.1
|
|
7.2
|
5.7--9.0
|
12.4
|
10.4--14.7
|
9.9
|
8.5--11.4
|
|
Indiana
|
25.6
|
21.7--29.9
|
21.1
|
17.1--25.8
|
23.4
|
20.3--26.8
|
|
8.9
|
6.7--11.7
|
10.2
|
7.5--13.8
|
9.7
|
7.4--12.6
|
|
Kansas
|
26.4
|
21.6--31.8
|
25.3
|
22.4--28.5
|
25.8
|
22.7--29.1
|
|
11.2
|
8.3--14.9
|
14.6
|
11.4--18.4
|
12.9
|
10.4--15.9
|
|
Kentucky
|
19.3
|
16.9--22.1
|
22.4
|
20.2--24.8
|
20.9
|
19.2--22.8
|
|
6.0
|
4.5--7.9
|
8.5
|
6.5--11.2
|
7.3
|
5.8--9.0
|
|
Louisiana
|
36.7
|
32.7--40.8
|
34.9
|
29.0--41.4
|
35.9
|
32.1--39.8
|
|
12.3
|
9.7--15.5
|
15.5
|
10.2--22.8
|
13.9
|
10.2--18.5
|
|
Maine
|
---
|
---
|
---
|
---
|
---
|
---
|
|
---
|
---
|
---
|
---
|
---
|
---
|
|
Maryland
|
26.2
|
23.2--29.4
|
27.1
|
23.0--31.7
|
26.7
|
24.0--29.7
|
|
7.1
|
5.0--9.8
|
10.3
|
7.8--13.4
|
8.7
|
6.7--11.3
|
|
Massachusetts
|
26.7
|
23.8--30.0
|
26.6
|
23.4--30.1
|
26.7
|
24.0--29.5
|
|
7.8
|
6.2--9.7
|
10.2
|
8.1--12.8
|
9.0
|
7.6--10.6
|
|
Michigan
|
28.1
|
24.1--32.5
|
26.7
|
23.7--29.8
|
27.5
|
24.5--30.8
|
|
6.9
|
5.6--8.5
|
9.6
|
7.7--12.0
|
8.4
|
7.0--10.0
|
|
Mississippi
|
29.6
|
25.7--33.7
|
28.6
|
24.2--33.5
|
29.1
|
26.4--32.1
|
|
8.2
|
6.3--10.6
|
13.1
|
10.8--15.9
|
10.7
|
8.9--12.7
|
|
Missouri
|
23.4
|
17.6--30.5
|
25.6
|
21.3--30.5
|
24.6
|
20.0--30.0
|
|
9.9
|
7.3--13.3
|
10.6
|
7.5--14.9
|
10.3
|
7.6--13.8
|
|
Montana
|
29.5
|
24.1--35.6
|
28.1
|
24.3--32.2
|
28.8
|
25.0--33.0
|
|
12.2
|
9.1--16.0
|
14.7
|
11.5--18.5
|
13.5
|
11.0--16.5
|
|
Nevada
|
24.9
|
21.8--28.3
|
21.3
|
17.9--25.1
|
23.0
|
20.5--25.8
|
|
5.1
|
3.9--6.7
|
9.4
|
7.2--12.1
|
7.3
|
5.9--9.0
|
|
New Hampshire
|
24.6
|
20.2--29.6
|
21.7
|
18.8--24.9
|
23.2
|
20.3--26.3
|
|
7.8
|
5.5--10.9
|
9.0
|
6.7--12.1
|
8.5
|
6.7--10.7
|
|
New Jersey
|
22.2
|
18.5--26.5
|
23.5
|
20.2--27.0
|
22.9
|
20.1--26.0
|
|
5.0
|
3.3--7.4
|
10.3
|
8.0--13.3
|
7.7
|
6.4--9.2
|
|
New Mexico
|
27.2
|
24.7--29.8
|
25.7
|
22.0--29.7
|
26.4
|
23.8--29.2
|
|
9.6
|
8.1--11.4
|
9.8
|
7.7--12.3
|
9.7
|
8.1--11.6
|
|
New York
|
---
|
---
|
---
|
---
|
---
|
---
|
|
5.2
|
3.9--6.8
|
10.9
|
8.7--13.6
|
8.2
|
7.1--9.6
|
|
North Carolina
|
21.0
|
17.8--24.6
|
20.2
|
16.4--24.7
|
20.7
|
17.9--23.8
|
|
5.9
|
4.1--8.6
|
10.6
|
8.5--13.1
|
8.2
|
6.4--10.4
|
|
North Dakota
|
30.0
|
26.4--33.8
|
26.6
|
23.2--30.2
|
28.3
|
25.8--30.9
|
|
13.4
|
10.9--16.3
|
17.1
|
14.2--20.4
|
15.2
|
13.3--17.4
|
|
Oklahoma
|
22.8
|
18.4--27.8
|
23.6
|
18.5--29.6
|
23.1
|
20.2--26.3
|
|
8.6
|
6.2--11.9
|
13.2
|
9.4--18.3
|
11.0
|
8.7--13.7
|
|
Pennsylvania
|
21.1
|
18.7--23.8
|
21.7
|
18.2--25.7
|
21.5
|
19.6--23.6
|
|
4.6
|
3.4--6.4
|
9.1
|
6.7--12.1
|
6.9
|
5.4--8.8
|
|
Rhode Island
|
24.2
|
21.7--26.8
|
22.0
|
19.8--24.4
|
23.1
|
21.1--25.4
|
|
5.9
|
4.3--8.0
|
8.3
|
6.7--10.2
|
7.2
|
5.6--9.0
|
|
South Carolina
|
26.1
|
21.9--30.7
|
28.5
|
23.6--33.9
|
27.4
|
24.0--31.0
|
|
6.7
|
4.9--9.2
|
13.3
|
8.8--19.5
|
10.0
|
7.2--13.9
|
|
South Dakota
|
22.2
|
18.7--26.2
|
21.6
|
17.8--25.9
|
21.8
|
19.3--24.6
|
|
9.6
|
7.2--12.7
|
12.3
|
10.3--14.6
|
10.9
|
9.1--13.1
|
|
Tennessee
|
22.1
|
19.1--25.4
|
22.5
|
19.3--26.0
|
22.2
|
20.1--24.5
|
|
5.9
|
4.3--8.1
|
9.8
|
7.0--13.7
|
7.9
|
5.9--10.4
|
|
Texas
|
34.9
|
31.9--38.0
|
32.2
|
30.4--34.1
|
33.5
|
31.7--35.3
|
|
8.5
|
6.7--10.8
|
15.1
|
12.3--18.3
|
11.8
|
9.8--14.2
|
|
Utah
|
13.0
|
9.4--17.6
|
13.8
|
9.6--19.5
|
13.6
|
10.2--17.8
|
|
3.5
|
2.2--5.4
|
6.0
|
3.6--9.8
|
4.9
|
3.4--7.0
|
|
Vermont
|
22.0
|
19.7--24.5
|
24.2
|
21.3--27.3
|
23.2
|
20.9--25.7
|
|
5.6
|
4.5--7.0
|
10.1
|
8.1--12.4
|
8.0
|
6.7--9.5
|
|
West Virginia
|
25.9
|
22.1--30.0
|
24.7
|
21.2--28.7
|
25.6
|
23.3--28.1
|
|
5.9
|
3.8--9.1
|
8.8
|
6.8--11.3
|
7.5
|
6.2--9.1
|
|
Wisconsin
|
24.2
|
21.3--27.4
|
24.2
|
20.9--27.7
|
24.3
|
22.1--26.5
|
|
7.5
|
5.9--9.5
|
10.3
|
8.7--12.2
|
8.9
|
7.8--10.2
|
|
Wyoming
|
29.4
|
26.9--32.0
|
28.3
|
25.6--31.3
|
28.9
|
26.8--31.1
|
|
10.5
|
8.7--12.6
|
15.4
|
13.1--17.9
|
13.0
|
11.4--14.8
|
|
Median
|
25.9
|
24.9
|
25.6
|
|
7.4
|
10.5
|
8.9
|
|
Range
|
13.0--40.7
|
13.8--34.9
|
13.6--37.1
|
|
3.5--13.8
|
6.0--17.1
|
4.9--15.2
|
|
Local surveys
|
|
|
|
|
|
|
|
|
|
|
|
|
|
|
Boston, MA
|
24.4
|
20.6--28.7
|
25.3
|
19.6--32.0
|
24.8
|
21.2--29.0
|
|
4.1
|
2.9--5.9
|
7.7
|
4.3--13.5
|
5.9
|
3.9--8.8
|
|
Broward County, FL
|
30.2
|
27.0--33.6
|
26.9
|
23.5--30.5
|
28.3
|
26.0--30.8
|
|
9.8
|
7.7--12.3
|
11.2
|
9.0--13.9
|
10.5
|
9.1--12.1
|
|
Charlotte-Mecklenburg, NC
|
23.2
|
19.9--26.9
|
22.5
|
18.8--26.7
|
23.0
|
20.2--25.9
|
|
3.9
|
2.7--5.5
|
7.0
|
5.2--9.5
|
5.5
|
4.3--6.9
|
|
Chicago, IL
|
29.9
|
25.1--35.3
|
31.9
|
27.6--36.6
|
31.5
|
27.4--35.9
|
|
6.0
|
3.4--10.2
|
11.0
|
7.7--15.4
|
8.8
|
6.3--12.1
|
|
Clark County, NV
|
25.1
|
21.2--29.5
|
20.2
|
15.8--25.5
|
22.6
|
19.4--26.1
|
|
3.8
|
2.6--5.5
|
7.9
|
5.6--10.9
|
5.9
|
4.5--7.7
|
|
Dallas, TX
|
34.1
|
29.8--38.7
|
34.4
|
29.7--39.5
|
34.2
|
30.7--37.9
|
|
5.7
|
3.8--8.4
|
10.5
|
7.5--14.6
|
8.1
|
6.2--10.4
|
|
Detroit, MI
|
39.2
|
35.0--43.6
|
38.0
|
32.8--43.4
|
38.7
|
34.8--42.8
|
|
4.3
|
3.0--6.1
|
5.8
|
3.9--8.7
|
5.1
|
3.7--6.8
|
|
Duval County, FL
|
30.8
|
27.6--34.2
|
30.4
|
27.3--33.6
|
30.8
|
28.7--33.1
|
|
9.3
|
7.1--12.2
|
12.7
|
10.2--15.7
|
11.1
|
9.1--13.6
|
|
Los Angeles, CA
|
27.2
|
23.3--31.4
|
27.8
|
23.5--32.6
|
27.5
|
24.9--30.3
|
|
3.7
|
2.8--4.9
|
9.0
|
6.7--12.0
|
6.4
|
5.0--8.3
|
|
Memphis, TN
|
25.3
|
21.4--29.5
|
26.7
|
22.5--31.3
|
25.9
|
22.9--29.1
|
|
2.5
|
1.4--4.3
|
3.9
|
2.7--5.5
|
3.1
|
2.2--4.5
|
|
Miami-Dade County, FL
|
31.0
|
28.4--33.6
|
30.5
|
26.9--34.5
|
30.9
|
28.7--33.2
|
|
7.1
|
5.2--9.5
|
11.4
|
8.7--14.8
|
9.2
|
7.4--11.4
|
|
Milwaukee, WI
|
26.5
|
24.1--29.0
|
29.0
|
25.5--32.8
|
27.9
|
25.8--30.0
|
|
3.2
|
2.5--4.3
|
6.4
|
4.8--8.5
|
4.8
|
3.8--6.1
|
|
New York City, NY
|
---
|
---
|
---
|
---
|
---
|
---
|
|
2.2
|
1.7--2.8
|
4.8
|
3.8--5.9
|
3.4
|
2.8--4.1
|
|
Orange County, FL
|
29.1
|
25.2--33.4
|
23.7
|
19.9--28.0
|
26.4
|
24.3--28.7
|
|
5.7
|
4.0--8.0
|
10.5
|
8.1--13.5
|
8.1
|
6.7--9.9
|
|
Palm Beach County, FL
|
28.8
|
25.9--31.9
|
29.5
|
26.2--33.0
|
29.1
|
26.9--31.4
|
|
8.2
|
6.4--10.3
|
13.7
|
11.1--16.7
|
10.9
|
9.3--12.9
|
|
Philadelphia, PA
|
27.9
|
24.1--32.0
|
23.3
|
20.5--26.4
|
25.9
|
23.5--28.5
|
|
3.6
|
2.2--5.8
|
4.7
|
2.7--8.0
|
4.2
|
3.2--5.6
|
|
San Bernardino, CA
|
29.8
|
26.4--33.4
|
32.4
|
28.4--36.6
|
31.1
|
28.4--34.0
|
|
5.1
|
3.8--7.0
|
13.0
|
10.4--16.1
|
9.1
|
7.5--11.0
|
|
San Diego, CA
|
24.8
|
21.8--28.1
|
25.1
|
22.0--28.4
|
25.0
|
22.7--27.4
|
|
5.6
|
4.1--7.4
|
8.6
|
6.5--11.2
|
7.1
|
5.6--9.0
|
|
San Francisco, CA
|
16.2
|
13.9--18.8
|
18.4
|
15.7--21.4
|
17.5
|
15.5--19.6
|
|
3.0
|
1.8--5.0
|
5.5
|
4.1--7.3
|
4.3
|
3.4--5.4
|
|
Seattle, WA
|
24.7
|
21.4--28.3
|
24.3
|
21.4--27.5
|
24.7
|
22.5--27.0
|
|
5.6
|
4.0--7.8
|
8.8
|
6.8--11.2
|
7.3
|
5.9--9.1
|
|
Median
|
27.9
|
26.9
|
27.5
|
|
4.7
|
8.7
|
6.7
|
|
Range
|
16.2--39.2
|
18.4--38.0
|
17.5--38.7
|
|
2.2--9.8
|
3.9--13.7
|
3.1--11.1
|
|
|
Carried a weapon
|
|
Carried a gun
|
|
|
Female
|
Male
|
Total
|
|
Female
|
Male
|
Total
|
|
Category
|
%
|
CI§
|
%
|
CI
|
%
|
CI
|
|
%
|
CI
|
%
|
CI
|
%
|
CI
|
|
Race/Ethnicity
|
|
|
|
|
|
|
|
|
|
|
|
|
|
|
White¶
|
6.5
|
5.4--7.7
|
29.3
|
24.7--34.4
|
18.6
|
16.4--21.1
|
|
1.5
|
0.9--2.7
|
9.5
|
7.4--12.1
|
5.8
|
4.7--7.2
|
|
Black¶
|
7.8
|
5.6--10.6
|
21.0
|
17.5--24.9
|
14.4
|
11.9--17.3
|
|
1.8
|
1.1--3.1
|
13.2
|
9.4--18.3
|
7.6
|
5.4--10.5
|
|
Hispanic
|
7.9
|
6.6--9.4
|
26.5
|
23.5--29.7
|
17.2
|
15.4--19.1
|
|
1.9
|
1.2--2.9
|
8.2
|
6.5--10.3
|
5.1
|
4.1--6.2
|
|
Grade
|
|
|
|
|
|
|
|
|
|
|
|
|
|
|
9
|
7.6
|
6.3--9.1
|
27.3
|
24.1--30.7
|
18.0
|
16.4--19.9
|
|
1.4
|
1.0--2.2
|
9.8
|
7.9--12.3
|
5.9
|
4.9--7.2
|
|
10
|
7.2
|
5.6--9.3
|
28.5
|
23.6--33.9
|
18.4
|
15.5--21.6
|
|
1.8
|
1.0--3.4
|
9.9
|
7.5--13.1
|
6.1
|
4.6--8.1
|
|
11
|
6.3
|
4.9--7.9
|
25.6
|
22.0--29.6
|
16.2
|
14.4--18.1
|
|
1.7
|
1.1--2.8
|
8.9
|
7.3--10.8
|
5.4
|
4.6--6.4
|
|
12
|
6.4
|
5.3--7.8
|
26.5
|
23.6--29.6
|
16.6
|
15.0--18.4
|
|
1.6
|
0.9--2.9
|
10.6
|
8.4--13.2
|
6.2
|
5.0--7.7
|
|
Total
|
7.1
|
6.3--7.9
|
27.1
|
24.3--30.2
|
17.5
|
16.1--19.0
|
|
1.7
|
1.3--2.3
|
9.8
|
8.3--11.7
|
5.9
|
5.1--6.9
|
|
|
Carried a weapon
|
|
Carried a gun
|
|
|
Female
|
Male
|
Total
|
|
Female
|
Male
|
Total
|
|
Site
|
%
|
CI§
|
%
|
CI
|
%
|
CI
|
|
%
|
CI
|
%
|
CI
|
%
|
CI
|
|
State surveys
|
|
|
|
|
|
|
|
|
|
|
|
|
|
|
Alabama
|
10.8
|
8.0--14.4
|
35.4
|
28.9--42.4
|
22.9
|
18.6--28.0
|
|
2.8
|
1.3--5.9
|
16.5
|
11.6--23.0
|
9.7
|
6.5--14.3
|
|
Alaska
|
9.5
|
7.3--12.2
|
30.3
|
26.5--34.5
|
20.0
|
17.5--22.7
|
|
1.9
|
1.1--3.5
|
11.5
|
9.0--14.7
|
6.9
|
5.5--8.7
|
|
Arizona
|
9.7
|
7.7--12.1
|
29.5
|
26.1--33.2
|
19.9
|
17.4--22.5
|
|
2.5
|
1.6--3.8
|
10.7
|
8.1--13.9
|
6.8
|
5.2--8.9
|
|
Arkansas
|
10.1
|
7.4--13.6
|
36.1
|
31.0--41.5
|
22.9
|
19.4--26.9
|
|
2.9
|
1.6--5.1
|
18.3
|
14.4--23.0
|
10.7
|
8.4--13.5
|
|
Colorado
|
8.2
|
6.1--11.1
|
25.0
|
20.7--29.8
|
16.7
|
14.2--19.5
|
|
2.2
|
1.2--4.2
|
9.2
|
6.2--13.4
|
5.8
|
4.2--8.0
|
|
Connecticut
|
5.8
|
4.5--7.5
|
18.6
|
16.0--21.5
|
12.4
|
10.7--14.4
|
|
---¶
|
---
|
---
|
---
|
---
|
---
|
|
Delaware
|
9.9
|
8.2--11.9
|
26.7
|
23.9--29.7
|
18.5
|
16.7--20.4
|
|
1.9
|
1.0--3.6
|
10.2
|
8.4--12.4
|
6.3
|
5.1--7.7
|
|
Florida
|
7.5
|
6.6--8.5
|
26.4
|
24.2--28.8
|
17.3
|
16.1--18.5
|
|
---
|
---
|
---
|
---
|
---
|
---
|
|
Georgia
|
8.6
|
6.6--11.1
|
29.5
|
26.2--33.1
|
18.8
|
16.6--21.2
|
|
2.2
|
1.5--3.2
|
13.7
|
11.9--15.8
|
7.9
|
6.8--9.2
|
|
Hawaii
|
9.1
|
6.7--12.3
|
22.1
|
15.9--29.8
|
15.9
|
12.1--20.5
|
|
---
|
---
|
---
|
---
|
---
|
---
|
|
Idaho
|
8.8
|
7.3--10.8
|
34.2
|
30.4--38.1
|
21.8
|
19.6--24.2
|
|
2.6
|
1.8--3.9
|
14.2
|
11.9--17.0
|
8.6
|
7.1--10.3
|
|
Illinois
|
6.9
|
5.3--8.8
|
24.7
|
21.3--28.5
|
16.0
|
14.0--18.2
|
|
1.3
|
0.8--2.2
|
10.7
|
8.8--13.0
|
6.2
|
5.2--7.3
|
|
Indiana
|
6.7
|
4.7--9.6
|
29.2
|
24.3--34.6
|
18.1
|
15.1--21.6
|
|
1.9
|
1.1--3.4
|
11.7
|
8.8--15.3
|
6.9
|
5.3--8.8
|
|
Kansas
|
5.9
|
4.1--8.5
|
25.6
|
21.9--29.7
|
16.0
|
13.5--18.7
|
|
1.5
|
0.8--2.7
|
11.2
|
8.7--14.3
|
6.5
|
5.0--8.4
|
|
Kentucky
|
9.3
|
6.7--12.8
|
33.8
|
29.5--38.5
|
21.7
|
18.4--25.4
|
|
1.9
|
1.0--3.3
|
11.3
|
9.1--13.9
|
6.6
|
5.2--8.3
|
|
Louisiana
|
9.5
|
6.6--13.5
|
30.8
|
25.7--36.5
|
19.6
|
16.2--23.6
|
|
3.2
|
1.9--5.2
|
14.0
|
9.7--19.7
|
8.4
|
6.0--11.7
|
|
Maine
|
---
|
---
|
---
|
---
|
---
|
---
|
|
---
|
---
|
---
|
---
|
---
|
---
|
|
Maryland
|
7.8
|
5.6--10.7
|
25.3
|
21.5--29.4
|
16.6
|
14.2--19.3
|
|
1.6
|
0.9--2.8
|
7.4
|
5.8--9.5
|
4.6
|
3.8--5.7
|
|
Massachusetts
|
5.3
|
3.7--7.4
|
20.3
|
17.6--23.2
|
12.8
|
10.9--15.0
|
|
0.9
|
0.5--1.7
|
6.0
|
4.3--8.1
|
3.5
|
2.6--4.7
|
|
Michigan
|
7.5
|
6.1--9.2
|
25.5
|
22.9--28.3
|
16.6
|
15.3--18.1
|
|
1.9
|
1.2--2.9
|
9.5
|
7.8--11.5
|
5.8
|
4.9--6.9
|
|
Mississippi
|
7.0
|
5.4--9.0
|
28.0
|
24.6--31.7
|
17.2
|
15.2--19.4
|
|
1.9
|
1.3--2.9
|
13.1
|
9.9--17.0
|
7.4
|
5.6--9.8
|
|
Missouri
|
5.9
|
4.2--8.1
|
25.7
|
21.3--30.5
|
16.0
|
13.1--19.4
|
|
1.2
|
0.7--2.3
|
10.2
|
7.6--13.7
|
5.8
|
4.2--7.9
|
|
Montana
|
7.7
|
6.1--9.7
|
37.8
|
34.1--41.5
|
23.0
|
20.9--25.2
|
|
2.3
|
1.5--3.5
|
15.9
|
12.6--19.7
|
9.2
|
7.6--11.1
|
|
Nevada
|
8.8
|
7.1--10.8
|
29.0
|
25.5--32.7
|
19.1
|
17.0--21.4
|
|
---
|
---
|
---
|
---
|
---
|
---
|
|
New Hampshire
|
---
|
---
|
---
|
---
|
---
|
---
|
|
---
|
---
|
---
|
---
|
---
|
---
|
|
New Jersey
|
3.6
|
2.0--6.3
|
15.7
|
13.1--18.6
|
9.6
|
8.0--11.5
|
|
0.3
|
0.1--0.9
|
3.4
|
2.1--5.4
|
1.8
|
1.2--2.7
|
|
New Mexico
|
15.0
|
13.0--17.3
|
39.3
|
36.7--42.0
|
27.4
|
25.4--29.4
|
|
4.1
|
2.8--5.9
|
17.2
|
14.7--20.1
|
10.8
|
9.0--12.9
|
|
New York
|
5.7
|
4.4--7.4
|
21.4
|
18.7--24.5
|
13.9
|
12.1--15.9
|
|
1.7
|
1.0--2.8
|
8.7
|
7.0--10.9
|
5.4
|
4.3--6.8
|
|
North Carolina
|
8.0
|
6.8--9.4
|
32.0
|
28.4--35.8
|
19.6
|
17.8--21.6
|
|
---
|
---
|
---
|
---
|
---
|
---
|
|
North Dakota
|
---
|
---
|
---
|
---
|
---
|
---
|
|
---
|
---
|
---
|
---
|
---
|
---
|
|
Oklahoma
|
7.7
|
5.5--10.7
|
29.9
|
25.4--34.8
|
19.0
|
16.2--22.2
|
|
0.6
|
0.2--1.4
|
10.5
|
7.7--14.1
|
5.6
|
4.0--7.7
|
|
Pennsylvania
|
6.3
|
4.6--8.6
|
23.1
|
18.9--27.9
|
14.8
|
12.4--17.7
|
|
1.8
|
1.1--2.9
|
9.2
|
6.4--13.2
|
5.6
|
4.1--7.7
|
|
Rhode Island
|
5.0
|
3.6--6.9
|
15.7
|
14.2--17.3
|
10.4
|
9.4--11.5
|
|
---
|
---
|
---
|
---
|
---
|
---
|
|
South Carolina
|
9.4
|
6.1--14.0
|
31.7
|
25.2--39.0
|
20.4
|
16.2--25.5
|
|
1.7
|
0.7--3.7
|
13.5
|
10.3--17.4
|
7.6
|
5.9--9.7
|
|
South Dakota
|
---
|
---
|
---
|
---
|
---
|
---
|
|
---
|
---
|
---
|
---
|
---
|
---
|
|
Tennessee
|
8.2
|
6.2--10.7
|
32.6
|
27.8--37.7
|
20.5
|
17.3--24.1
|
|
1.7
|
1.1--2.7
|
11.3
|
9.1--14.0
|
6.5
|
5.2--8.3
|
|
Texas
|
7.2
|
5.8--8.9
|
28.8
|
25.5--32.3
|
18.2
|
16.4--20.1
|
|
1.4
|
0.9--2.2
|
11.4
|
9.5--13.8
|
6.5
|
5.5--7.7
|
|
Utah
|
5.3
|
3.8--7.3
|
26.2
|
21.5--31.5
|
16.0
|
13.4--19.1
|
|
1.3
|
0.6--2.8
|
11.2
|
8.3--14.8
|
6.4
|
4.9--8.3
|
|
Vermont
|
---
|
---
|
---
|
---
|
---
|
---
|
|
---
|
---
|
---
|
---
|
---
|
---
|
|
West Virginia
|
10.5
|
8.2--13.3
|
37.9
|
34.1--41.9
|
24.4
|
22.3--26.7
|
|
2.9
|
1.8--4.6
|
17.2
|
14.3--20.7
|
10.1
|
8.5--12.1
|
|
Wisconsin
|
3.3
|
2.5--4.4
|
18.0
|
15.1--21.2
|
10.9
|
9.3--12.6
|
|
1.0
|
0.5--1.9
|
6.2
|
5.2--7.5
|
3.7
|
3.0--4.4
|
|
Wyoming
|
11.1
|
9.6--12.9
|
40.0
|
37.1--42.9
|
26.0
|
24.0--28.1
|
|
3.9
|
3.0--5.0
|
18.5
|
16.2--21.1
|
11.5
|
10.1--13.0
|
|
Median
|
7.8
|
28.8
|
18.2
|
|
1.9
|
11.3
|
6.5
|
|
Range
|
3.3--15.0
|
15.7--40.0
|
9.6--27.4
|
|
0.3--4.1
|
3.4--18.5
|
1.8--11.5
|
|
Local surveys
|
|
|
|
|
|
|
|
|
|
|
|
|
|
|
Boston, MA
|
6.9
|
4.8--9.6
|
22.5
|
18.0--27.8
|
14.6
|
11.8--18.0
|
|
0.8
|
0.3--1.9
|
7.3
|
4.3--12.1
|
4.1
|
2.5--6.5
|
|
Broward County, FL
|
6.2
|
4.4--8.6
|
16.6
|
13.8--19.8
|
11.3
|
9.5--13.3
|
|
2.4
|
1.3--4.2
|
7.1
|
4.8--10.3
|
4.8
|
3.4--6.8
|
|
Charlotte-Mecklenburg, NC
|
6.5
|
4.9--8.5
|
22.6
|
19.2--26.4
|
14.4
|
12.4--16.7
|
|
---
|
---
|
---
|
---
|
---
|
---
|
|
Chicago, IL
|
13.4
|
8.6--20.3
|
21.6
|
18.5--25.2
|
18.1
|
15.0--21.6
|
|
2.6
|
1.3--4.9
|
8.4
|
5.9--11.8
|
6.0
|
4.2--8.5
|
|
Clark County, NV
|
8.1
|
6.3--10.5
|
24.3
|
20.3--28.9
|
16.5
|
14.1--19.1
|
|
---
|
---
|
---
|
---
|
---
|
---
|
|
Dallas, TX
|
6.2
|
4.1--9.3
|
30.6
|
23.5--38.8
|
18.2
|
14.1--23.1
|
|
1.3
|
0.5--3.0
|
12.1
|
9.0--16.1
|
6.6
|
4.8--9.0
|
|
Detroit, MI
|
13.8
|
10.9--17.2
|
22.7
|
18.7--27.2
|
18.3
|
15.6--21.2
|
|
2.6
|
1.6--4.2
|
10.7
|
8.6--13.4
|
6.7
|
5.4--8.2
|
|
Duval County, FL
|
13.3
|
11.1--15.8
|
31.8
|
28.7--35.2
|
22.3
|
20.3--24.6
|
|
3.2
|
2.3--4.6
|
14.0
|
11.5--16.9
|
8.5
|
7.1--10.3
|
|
Los Angeles, CA
|
5.0
|
3.5--7.3
|
18.9
|
14.7--23.8
|
12.2
|
9.9--15.0
|
|
0.7
|
0.3--1.5
|
6.2
|
4.6--8.1
|
3.5
|
2.7--4.5
|
|
Memphis, TN
|
8.1
|
6.1--10.9
|
17.6
|
14.2--21.5
|
12.8
|
10.7--15.2
|
|
1.2
|
0.5--2.8
|
10.4
|
7.6--14.1
|
5.8
|
4.3--7.9
|
|
Miami-Dade County, FL
|
6.3
|
4.5--8.7
|
19.8
|
17.2--22.8
|
13.1
|
11.3--15.1
|
|
2.9
|
1.7--4.8
|
9.7
|
7.3--12.7
|
6.3
|
4.7--8.4
|
|
Milwaukee, WI
|
9.6
|
7.4--12.3
|
23.3
|
19.8--27.1
|
16.5
|
14.3--18.8
|
|
1.7
|
1.0--2.9
|
12.7
|
10.4--15.5
|
7.2
|
5.9--8.8
|
|
New York City, NY
|
7.6
|
6.4--8.9
|
15.3
|
13.8--16.8
|
11.2
|
10.1--12.4
|
|
1.3
|
1.0--1.7
|
4.9
|
4.2--5.7
|
3.0
|
2.6--3.4
|
|
Orange County, FL
|
7.4
|
5.6--9.7
|
19.8
|
16.7--23.3
|
13.6
|
11.7--15.7
|
|
1.8
|
1.0--3.0
|
7.0
|
5.2--9.3
|
4.3
|
3.4--5.5
|
|
Palm Beach County, FL
|
6.6
|
5.0--8.8
|
22.1
|
19.3--25.3
|
14.4
|
12.6--16.5
|
|
1.9
|
1.1--3.5
|
10.0
|
7.9--12.6
|
6.0
|
4.8--7.5
|
|
Philadelphia, PA
|
11.0
|
8.5--14.1
|
20.0
|
16.9--23.6
|
15.5
|
13.7--17.6
|
|
2.0
|
0.9--4.1
|
10.4
|
7.6--14.3
|
6.3
|
4.8--8.4
|
|
San Bernardino, CA
|
8.9
|
6.7--11.7
|
25.8
|
21.8--30.3
|
17.4
|
14.9--20.3
|
|
1.2
|
0.6--2.5
|
8.6
|
6.2--11.8
|
4.9
|
3.6--6.8
|
|
San Diego, CA
|
6.0
|
4.5--8.0
|
19.5
|
16.7--22.7
|
12.9
|
11.0--15.1
|
|
0.7
|
0.3--1.6
|
4.8
|
3.4--6.7
|
2.8
|
1.9--3.9
|
|
San Francisco, CA
|
7.6
|
6.0--9.6
|
15.0
|
12.8--17.5
|
11.6
|
10.2--13.1
|
|
1.9
|
1.1--3.3
|
5.8
|
4.5--7.6
|
4.0
|
3.1--5.2
|
|
Seattle, WA
|
7.7
|
6.1--9.8
|
17.1
|
14.2--20.5
|
12.8
|
10.8--15.1
|
|
1.6
|
1.0--2.8
|
5.1
|
3.7--7.0
|
3.6
|
2.8--4.8
|
|
Median
|
7.6
|
20.8
|
14.4
|
|
1.7
|
8.5
|
5.3
|
|
Range
|
5.0--13.8
|
15.0--31.8
|
11.2--22.3
|
|
0.7--3.2
|
4.8--14.0
|
2.8--8.5
|
|
|
In a physical fight
|
|
Injured in a physical fight
|
|
|
Female
|
Male
|
Total
|
|
Female
|
Male
|
Total
|
|
Category
|
%
|
CI§
|
%
|
CI
|
%
|
CI
|
|
%
|
CI
|
%
|
CI
|
%
|
CI
|
|
Race/Ethnicity
|
|
|
|
|
|
|
|
|
|
|
|
|
|
|
White¶
|
18.2
|
16.4--20.2
|
36.0
|
33.0--39.1
|
27.8
|
26.0--29.6
|
|
1.3
|
0.9--1.9
|
4.2
|
3.3--5.4
|
2.9
|
2.4--3.5
|
|
Black¶
|
33.9
|
29.8--38.1
|
48.3
|
44.4--52.2
|
41.1
|
37.7--44.6
|
|
4.4
|
2.9--6.5
|
7.0
|
5.4--9.0
|
5.7
|
4.6--7.1
|
|
Hispanic
|
28.5
|
26.4--30.7
|
43.8
|
40.5--47.1
|
36.2
|
34.3--38.1
|
|
3.3
|
2.3--4.7
|
6.0
|
4.8--7.5
|
4.7
|
3.9--5.6
|
|
Grade
|
|
|
|
|
|
|
|
|
|
|
|
|
|
|
9
|
27.8
|
24.9--30.7
|
45.1
|
41.7--48.7
|
37.0
|
34.6--39.5
|
|
2.5
|
1.8--3.4
|
5.5
|
3.9--7.5
|
4.1
|
3.1--5.4
|
|
10
|
24.8
|
22.7--27.0
|
41.2
|
36.9--45.7
|
33.5
|
31.1--35.9
|
|
2.7
|
2.1--3.5
|
5.2
|
4.1--6.5
|
4.1
|
3.4--4.8
|
|
11
|
20.5
|
18.6--22.6
|
36.1
|
33.3--39.1
|
28.6
|
26.7--30.5
|
|
2.1
|
1.5--3.0
|
5.4
|
4.1--7.1
|
3.8
|
3.1--4.7
|
|
12
|
17.0
|
14.7--19.7
|
32.5
|
29.9--35.1
|
24.9
|
23.0--27.0
|
|
1.4
|
0.9--2.2
|
4.2
|
3.3--5.5
|
2.9
|
2.3--3.6
|
|
Total
|
22.9
|
21.4--24.4
|
39.3
|
36.9--41.7
|
31.5
|
30.1--32.9
|
|
2.2
|
1.8--2.8
|
5.1
|
4.4--6.0
|
3.8
|
3.3--4.3
|
|
|
In a physical fight
|
|
Injured in a physical fight
|
|
|
Female
|
Male
|
Total
|
|
Female
|
Male
|
Total
|
|
Site
|
%
|
CI§
|
%
|
CI
|
%
|
CI
|
|
%
|
CI
|
%
|
CI
|
%
|
CI
|
|
State surveys
|
|
|
|
|
|
|
|
|
|
|
|
|
|
|
Alabama
|
22.5
|
18.2--27.4
|
40.4
|
33.9--47.3
|
31.7
|
26.8--37.0
|
|
1.5
|
0.7--3.4
|
6.0
|
4.3--8.5
|
3.8
|
2.7--5.4
|
|
Alaska
|
21.0
|
17.3--25.2
|
34.1
|
30.6--37.9
|
27.8
|
24.9--31.0
|
|
2.1
|
1.3--3.4
|
3.7
|
2.5--5.4
|
3.0
|
2.2--4.1
|
|
Arizona
|
27.8
|
24.0--31.9
|
43.6
|
39.4--47.9
|
35.9
|
32.3--39.7
|
|
---¶
|
---
|
---
|
---
|
---
|
---
|
|
Arkansas
|
25.1
|
20.5--30.3
|
44.1
|
39.6--48.7
|
34.7
|
30.5--39.1
|
|
3.0
|
1.6--5.6
|
10.7
|
8.2--13.9
|
6.9
|
5.2--9.1
|
|
Colorado
|
21.8
|
18.0--26.3
|
42.0
|
37.5--46.6
|
32.0
|
28.9--35.3
|
|
3.3
|
2.1--5.0
|
4.7
|
3.2--6.8
|
4.0
|
2.9--5.4
|
|
Connecticut
|
20.7
|
17.4--24.4
|
35.7
|
32.1--39.3
|
28.3
|
25.8--31.0
|
|
2.8
|
1.7--4.4
|
4.3
|
3.3--5.6
|
3.6
|
3.0--4.4
|
|
Delaware
|
24.2
|
21.7--26.9
|
36.2
|
33.0--39.5
|
30.4
|
28.1--32.9
|
|
3.0
|
2.1--4.4
|
4.9
|
3.7--6.4
|
4.2
|
3.4--5.3
|
|
Florida
|
22.6
|
20.7--24.7
|
36.7
|
34.3--39.1
|
29.8
|
28.1--31.5
|
|
2.5
|
1.9--3.2
|
5.7
|
4.7--6.8
|
4.2
|
3.7--4.7
|
|
Georgia
|
24.2
|
19.6--29.6
|
40.6
|
37.1--44.1
|
32.3
|
28.8--36.1
|
|
2.4
|
1.4--3.9
|
4.7
|
3.3--6.5
|
3.5
|
2.4--5.0
|
|
Hawaii
|
26.2
|
21.5--31.5
|
32.3
|
28.7--36.2
|
29.5
|
25.7--33.5
|
|
3.0
|
1.5--5.7
|
4.1
|
2.2--7.4
|
3.6
|
2.1--6.0
|
|
Idaho
|
20.3
|
17.4--23.5
|
37.1
|
34.0--40.3
|
29.0
|
26.9--31.2
|
|
2.1
|
1.1--3.7
|
4.7
|
3.5--6.2
|
3.4
|
2.5--4.6
|
|
Illinois
|
25.0
|
20.7--29.8
|
40.6
|
37.8--43.5
|
33.0
|
30.2--35.9
|
|
3.2
|
2.0--5.1
|
5.4
|
3.9--7.4
|
4.4
|
3.4--5.7
|
|
Indiana
|
23.4
|
18.8--28.6
|
34.6
|
29.9--39.5
|
29.1
|
26.1--32.3
|
|
2.5
|
1.4--4.5
|
3.1
|
2.2--4.4
|
2.8
|
2.0--4.0
|
|
Kansas
|
19.7
|
15.6--24.6
|
35.4
|
32.6--38.3
|
27.8
|
25.0--30.6
|
|
1.6
|
0.9--2.9
|
5.1
|
3.8--6.7
|
3.4
|
2.7--4.2
|
|
Kentucky
|
21.7
|
17.8--26.2
|
35.6
|
31.5--39.8
|
28.7
|
25.4--32.2
|
|
2.6
|
1.4--4.8
|
6.6
|
4.7--9.1
|
4.6
|
3.2--6.6
|
|
Louisiana
|
30.9
|
27.1--35.0
|
41.8
|
35.9--48.0
|
36.1
|
32.7--39.6
|
|
3.4
|
2.0--5.7
|
8.5
|
5.1--13.8
|
5.8
|
4.0--8.5
|
|
Maine
|
15.4
|
14.2--16.7
|
29.5
|
28.0--31.1
|
22.8
|
21.8--23.9
|
|
2.3
|
1.9--2.9
|
4.7
|
4.0--5.4
|
3.6
|
3.2--4.1
|
|
Maryland
|
26.6
|
22.0--31.7
|
38.1
|
32.6--44.0
|
32.5
|
27.9--37.4
|
|
3.9
|
2.4--6.2
|
7.2
|
5.4--9.7
|
5.8
|
4.5--7.5
|
|
Massachusetts
|
20.8
|
18.1--23.7
|
37.3
|
33.9--40.9
|
29.2
|
26.7--31.8
|
|
2.0
|
1.2--3.3
|
4.6
|
3.2--6.6
|
3.4
|
2.5--4.6
|
|
Michigan
|
22.9
|
19.0--27.4
|
40.0
|
36.3--43.9
|
31.6
|
28.2--35.3
|
|
3.3
|
2.5--4.3
|
5.4
|
4.3--6.9
|
4.5
|
3.7--5.4
|
|
Mississippi
|
26.2
|
21.5--31.5
|
42.2
|
38.5--46.1
|
34.1
|
30.6--37.7
|
|
2.8
|
1.8--4.5
|
4.1
|
2.9--5.9
|
3.5
|
2.7--4.5
|
|
Missouri
|
21.9
|
19.1--24.9
|
35.3
|
31.6--39.2
|
28.7
|
25.9--31.7
|
|
3.0
|
1.9--4.6
|
4.6
|
3.1--6.6
|
3.8
|
2.8--5.3
|
|
Montana
|
24.7
|
19.9--30.3
|
38.4
|
33.6--43.5
|
31.7
|
27.3--36.4
|
|
3.3
|
1.3--8.2
|
6.4
|
3.6--10.9
|
4.9
|
2.6--9.1
|
|
Nevada
|
26.8
|
23.0--30.9
|
42.8
|
39.5--46.2
|
35.0
|
32.2--38.0
|
|
---
|
---
|
---
|
---
|
---
|
---
|
|
New Hampshire
|
20.3
|
16.0--25.5
|
31.1
|
27.2--35.2
|
25.9
|
22.8--29.2
|
|
3.6
|
2.3--5.6
|
4.3
|
3.0--6.2
|
3.9
|
3.0--5.1
|
|
New Jersey
|
17.3
|
13.7--21.5
|
37.4
|
33.4--41.5
|
27.5
|
24.5--30.6
|
|
---
|
---
|
---
|
---
|
---
|
---
|
|
New Mexico
|
29.8
|
27.2--32.6
|
44.5
|
41.1--47.9
|
37.3
|
35.0--39.6
|
|
---
|
---
|
---
|
---
|
---
|
---
|
|
New York
|
21.8
|
19.5--24.4
|
37.0
|
33.7--40.4
|
29.6
|
27.3--32.1
|
|
---
|
---
|
---
|
---
|
---
|
---
|
|
North Carolina
|
19.6
|
17.5--21.8
|
38.1
|
34.7--41.5
|
28.6
|
26.7--30.5
|
|
2.2
|
1.4--3.3
|
5.2
|
4.1--6.6
|
3.7
|
3.0--4.6
|
|
North Dakota
|
---
|
---
|
---
|
---
|
---
|
---
|
|
---
|
---
|
---
|
---
|
---
|
---
|
|
Oklahoma
|
22.5
|
18.1--27.5
|
38.7
|
32.9--44.7
|
30.8
|
26.7--35.3
|
|
1.9
|
0.9--3.8
|
6.1
|
4.3--8.8
|
4.0
|
2.8--5.9
|
|
Pennsylvania
|
22.2
|
18.4--26.6
|
36.6
|
32.6--40.8
|
29.6
|
26.1--33.3
|
|
1.9
|
1.2--2.9
|
5.2
|
3.6--7.3
|
3.6
|
2.6--5.0
|
|
Rhode Island
|
19.2
|
17.3--21.2
|
30.5
|
28.1--33.1
|
25.1
|
23.4--26.9
|
|
---
|
---
|
---
|
---
|
---
|
---
|
|
South Carolina
|
29.7
|
25.1--34.7
|
43.1
|
36.7--49.7
|
36.4
|
32.2--40.8
|
|
2.7
|
1.5--4.9
|
5.7
|
3.9--8.2
|
4.2
|
2.9--6.0
|
|
South Dakota
|
18.9
|
15.4--23.0
|
35.0
|
30.7--39.5
|
27.1
|
24.4--30.0
|
|
2.0
|
0.9--4.4
|
3.5
|
2.4--5.1
|
2.8
|
2.0--3.9
|
|
Tennessee
|
22.8
|
19.7--26.2
|
41.5
|
37.9--45.1
|
32.3
|
29.6--35.0
|
|
2.5
|
1.7--3.6
|
4.7
|
3.5--6.4
|
3.6
|
2.9--4.6
|
|
Texas
|
23.0
|
20.1--26.1
|
43.2
|
40.1--46.3
|
33.3
|
31.1--35.5
|
|
2.9
|
1.9--4.2
|
5.5
|
4.3--7.1
|
4.2
|
3.4--5.3
|
|
Utah
|
20.2
|
16.6--24.3
|
35.6
|
31.9--39.5
|
28.2
|
25.0--31.6
|
|
1.9
|
1.1--3.4
|
5.4
|
3.6--8.0
|
3.8
|
2.8--5.0
|
|
Vermont
|
17.7
|
16.2--19.3
|
32.8
|
29.9--35.8
|
25.6
|
24.1--27.2
|
|
1.7
|
1.2--2.4
|
3.5
|
2.8--4.4
|
2.7
|
2.4--3.1
|
|
West Virginia
|
24.4
|
20.1--29.2
|
38.3
|
32.3--44.7
|
31.7
|
27.7--36.0
|
|
3.3
|
2.3--4.7
|
4.7
|
3.1--7.1
|
4.2
|
3.2--5.6
|
|
Wisconsin
|
18.5
|
15.4--22.1
|
32.6
|
29.0--36.5
|
25.8
|
22.8--29.0
|
|
2.5
|
1.6--3.8
|
2.0
|
1.2--3.2
|
2.2
|
1.6--3.1
|
|
Wyoming
|
21.6
|
19.4--24.0
|
39.7
|
36.5--42.9
|
30.9
|
28.6--33.3
|
|
2.8
|
2.1--3.8
|
4.8
|
3.7--6.3
|
3.9
|
3.2--4.7
|
|
Median
|
22.5
|
37.4
|
29.8
|
|
2.6
|
4.8
|
3.8
|
|
Range
|
15.4--30.9
|
29.5--44.5
|
22.8--37.3
|
|
1.5--3.9
|
2.0--10.7
|
2.2--6.9
|
|
Local surveys
|
|
|
|
|
|
|
|
|
|
|
|
|
|
|
Boston, MA
|
29.4
|
25.1--34.1
|
43.5
|
37.4--49.9
|
36.3
|
32.2--40.6
|
|
3.9
|
2.6--5.9
|
7.0
|
4.5--11.0
|
5.5
|
3.9--7.7
|
|
Broward County, FL
|
24.4
|
20.6--28.6
|
37.4
|
33.5--41.4
|
30.8
|
27.8--34.1
|
|
4.1
|
2.7--6.3
|
6.5
|
5.0--8.5
|
5.3
|
4.2--6.7
|
|
Charlotte-Mecklenburg, NC
|
21.7
|
18.9--24.9
|
39.8
|
35.3--44.6
|
30.7
|
27.8--33.7
|
|
---
|
---
|
---
|
---
|
---
|
---
|
|
Chicago, IL
|
35.5
|
28.2--43.4
|
46.7
|
40.0--53.5
|
41.6
|
35.4--48.0
|
|
5.4
|
3.6--8.0
|
8.2
|
5.6--12.0
|
7.2
|
5.5--9.4
|
|
Clark County, NV
|
26.0
|
21.8--30.7
|
41.5
|
37.3--45.7
|
33.9
|
30.5--37.6
|
|
---
|
---
|
---
|
---
|
---
|
---
|
|
Dallas, TX
|
29.3
|
24.0--35.3
|
45.7
|
39.0--52.7
|
37.4
|
32.2--42.9
|
|
2.3
|
1.2--4.5
|
5.5
|
3.0--9.7
|
3.9
|
2.4--6.1
|
|
Detroit, MI
|
43.4
|
38.8--48.1
|
54.4
|
48.7--59.9
|
49.0
|
45.0--53.1
|
|
3.9
|
2.5--6.0
|
8.8
|
6.5--11.8
|
6.3
|
4.9--8.2
|
|
Duval County, FL
|
27.6
|
24.6--30.9
|
42.4
|
39.0--45.9
|
35.0
|
32.4--37.6
|
|
2.6
|
1.8--3.7
|
7.6
|
5.8--9.8
|
5.1
|
4.1--6.4
|
|
Los Angeles, CA
|
23.6
|
21.0--26.3
|
38.1
|
32.3--44.2
|
31.0
|
27.2--35.1
|
|
2.3
|
1.5--3.7
|
5.2
|
3.4--7.9
|
3.8
|
2.6--5.6
|
|
Memphis, TN
|
31.8
|
27.8--36.1
|
44.5
|
39.8--49.3
|
37.8
|
34.0--41.8
|
|
3.6
|
2.3--5.7
|
4.7
|
3.1--7.2
|
4.1
|
3.1--5.6
|
|
Miami-Dade County, FL
|
26.2
|
23.0--29.8
|
36.8
|
33.3--40.5
|
31.5
|
28.8--34.5
|
|
4.2
|
2.9--6.1
|
6.9
|
5.5--8.8
|
5.7
|
4.6--7.0
|
|
Milwaukee, WI
|
43.3
|
39.6--47.1
|
49.2
|
45.1--53.3
|
46.3
|
43.4--49.3
|
|
4.6
|
3.4--6.1
|
7.2
|
5.4--9.6
|
6.0
|
4.8--7.5
|
|
New York City, NY
|
25.7
|
23.6--27.9
|
37.9
|
35.9--40.0
|
31.5
|
29.7--33.3
|
|
---
|
---
|
---
|
---
|
---
|
---
|
|
Orange County, FL
|
23.0
|
18.7--28.0
|
41.9
|
37.2--46.8
|
32.4
|
28.7--36.3
|
|
3.5
|
2.2--5.6
|
5.3
|
3.6--7.7
|
4.4
|
3.2--6.0
|
|
Palm Beach County, FL
|
23.9
|
20.8--27.2
|
38.3
|
34.5--42.2
|
31.1
|
28.6--33.8
|
|
3.0
|
2.1--4.4
|
6.3
|
4.5--8.8
|
4.8
|
3.6--6.2
|
|
Philadelphia, PA
|
42.5
|
38.0--47.1
|
48.7
|
41.9--55.5
|
45.6
|
41.2--50.1
|
|
4.4
|
3.0--6.4
|
7.1
|
4.8--10.3
|
5.9
|
4.4--7.7
|
|
San Bernardino, CA
|
29.9
|
25.7--34.5
|
47.5
|
42.6--52.5
|
38.9
|
35.5--42.5
|
|
4.5
|
3.2--6.3
|
7.2
|
5.0--10.3
|
5.9
|
4.5--7.6
|
|
San Diego, CA
|
25.1
|
21.5--29.1
|
38.5
|
34.5--42.5
|
31.9
|
28.9--35.1
|
|
2.4
|
1.5--4.0
|
5.8
|
4.2--7.9
|
4.2
|
3.3--5.4
|
|
San Francisco, CA
|
17.2
|
14.4--20.4
|
26.1
|
23.0--29.4
|
21.8
|
19.6--24.3
|
|
1.6
|
0.9--2.6
|
4.3
|
3.0--6.0
|
3.0
|
2.2--4.0
|
|
Seattle, WA
|
18.0
|
15.1--21.3
|
37.6
|
33.7--41.8
|
28.4
|
25.5--31.6
|
|
3.3
|
2.4--4.7
|
6.1
|
4.7--7.9
|
5.0
|
4.0--6.2
|
|
Median
|
26.1
|
41.7
|
33.1
|
|
3.6
|
6.5
|
5.1
|
|
Range
|
17.2--43.4
|
26.1--54.4
|
21.8--49.0
|
|
1.6--5.4
|
4.3--8.8
|
3.0--7.2
|
|
|
Dating violence
|
|
Forced to have sexual intercourse
|
|
|
Female
|
Male
|
Total
|
|
Female
|
Male
|
Total
|
|
Category
|
%
|
CI§
|
%
|
CI
|
%
|
CI
|
|
%
|
CI
|
%
|
CI
|
%
|
CI
|
|
Race/Ethnicity
|
|
|
|
|
|
|
|
|
|
|
|
|
|
|
White¶
|
7.2
|
6.0--8.6
|
8.8
|
7.5--10.3
|
8.0
|
7.1--9.1
|
|
10.0
|
8.6--11.6
|
3.2
|
2.4--4.2
|
6.3
|
5.3--7.5
|
|
Black¶
|
14.8
|
12.7--17.1
|
13.8
|
11.0--17.2
|
14.3
|
12.6--16.2
|
|
12.0
|
10.5--13.8
|
7.9
|
5.9--10.6
|
10.0
|
8.4--11.8
|
|
Hispanic
|
11.4
|
9.7--13.3
|
11.7
|
10.2--13.3
|
11.5
|
10.6--12.5
|
|
11.2
|
9.8--12.9
|
5.7
|
4.5--7.4
|
8.4
|
7.5--9.5
|
|
Grade
|
|
|
|
|
|
|
|
|
|
|
|
|
|
|
9
|
9.4
|
8.1--10.9
|
9.1
|
7.6--10.9
|
9.2
|
8.3--10.3
|
|
9.4
|
8.0--11.1
|
4.1
|
3.0--5.4
|
6.6
|
5.6--7.7
|
|
10
|
9.0
|
7.7--10.6
|
9.3
|
7.1--12.0
|
9.2
|
7.6--11.1
|
|
10.6
|
9.1--12.3
|
4.0
|
2.8--5.6
|
7.1
|
5.9--8.5
|
|
11
|
9.1
|
7.3--11.4
|
11.5
|
10.2--13.0
|
10.4
|
9.1--11.8
|
|
11.2
|
9.2--13.5
|
5.4
|
3.9--7.6
|
8.2
|
6.9--9.8
|
|
12
|
9.5
|
8.0--11.2
|
11.4
|
9.7--13.3
|
10.4
|
9.3--11.7
|
|
10.8
|
9.2--12.6
|
4.9
|
3.6--6.6
|
7.8
|
6.6--9.2
|
|
Total
|
9.3
|
8.4--10.3
|
10.3
|
9.1--11.6
|
9.8
|
8.9--10.8
|
|
10.5
|
9.6--11.4
|
4.5
|
3.7--5.6
|
7.4
|
6.7--8.3
|
|
|
Dating violence
|
|
Forced to have sexual intercourse
|
|
|
Female
|
Male
|
Total
|
|
Female
|
Male
|
Total
|
|
Site
|
%
|
CI§
|
%
|
CI
|
%
|
CI
|
|
%
|
CI
|
%
|
CI
|
%
|
CI
|
|
State surveys
|
|
|
|
|
|
|
|
|
|
|
|
|
|
|
Alabama
|
15.3
|
12.5--18.5
|
18.0
|
14.7--21.8
|
16.8
|
14.6--19.1
|
|
12.4
|
9.3--16.4
|
9.3
|
6.4--13.5
|
11.0
|
8.7--13.9
|
|
Alaska
|
12.1
|
9.6--15.1
|
14.2
|
11.6--17.4
|
13.3
|
11.4--15.4
|
|
14.3
|
11.3--17.9
|
6.1
|
4.5--8.3
|
10.1
|
8.6--11.9
|
|
Arizona
|
11.0
|
9.0--13.5
|
12.3
|
9.8--15.3
|
11.8
|
9.9--14.0
|
|
14.2
|
11.4--17.6
|
7.5
|
5.5--10.2
|
11.0
|
9.1--13.2
|
|
Arkansas
|
16.5
|
12.7--21.1
|
17.0
|
12.4--22.9
|
16.7
|
12.9--21.2
|
|
15.1
|
12.2--18.5
|
11.0
|
7.9--15.1
|
13.1
|
11.0--15.5
|
|
Colorado
|
6.9
|
4.7--9.9
|
11.2
|
8.4--14.8
|
9.1
|
7.2--11.5
|
|
11.1
|
8.9--13.7
|
4.4
|
2.7--7.2
|
7.7
|
6.2--9.4
|
|
Connecticut
|
9.1
|
7.2--11.3
|
10.7
|
8.2--13.9
|
9.9
|
8.1--12.1
|
|
8.4
|
6.9--10.2
|
6.3
|
4.8--8.3
|
7.4
|
6.1--8.9
|
|
Delaware
|
8.4
|
6.7--10.5
|
9.4
|
7.4--11.8
|
9.1
|
7.7--10.8
|
|
13.8
|
11.2--16.8
|
5.8
|
4.2--8.0
|
9.9
|
8.4--11.6
|
|
Florida
|
10.0
|
8.9--11.3
|
11.9
|
10.6--13.3
|
11.0
|
10.2--11.9
|
|
10.7
|
9.1--12.6
|
6.2
|
5.3--7.3
|
8.5
|
7.6--9.6
|
|
Georgia
|
15.6
|
13.1--18.6
|
16.3
|
13.3--19.8
|
16.0
|
13.8--18.3
|
|
---¶
|
---
|
---
|
---
|
---
|
---
|
|
Hawaii
|
11.6
|
8.8--15.1
|
14.1
|
10.8--18.2
|
13.0
|
10.4--16.1
|
|
12.4
|
10.4--14.7
|
8.2
|
5.8--11.6
|
10.3
|
8.4--12.7
|
|
Idaho
|
10.6
|
8.7--13.0
|
10.5
|
8.7--12.5
|
10.6
|
9.2--12.1
|
|
14.4
|
12.2--16.9
|
5.0
|
4.0--6.2
|
9.6
|
8.3--11.1
|
|
Illinois
|
13.6
|
11.5--16.0
|
13.7
|
11.0--17.0
|
13.8
|
12.1--15.6
|
|
10.8
|
8.9--13.1
|
7.1
|
6.0--8.5
|
9.0
|
7.6--10.6
|
|
Indiana
|
13.7
|
10.6--17.6
|
10.5
|
8.1--13.6
|
12.1
|
10.1--14.4
|
|
17.3
|
14.3--20.8
|
5.2
|
3.9--6.7
|
11.1
|
9.2--13.3
|
|
Kansas
|
8.7
|
6.1--12.2
|
9.5
|
7.4--12.1
|
9.1
|
7.1--11.7
|
|
10.2
|
8.4--12.3
|
4.9
|
3.5--6.6
|
7.5
|
6.2--9.1
|
|
Kentucky
|
15.6
|
12.4--19.5
|
15.3
|
13.2--17.8
|
15.5
|
13.5--17.6
|
|
13.6
|
10.6--17.4
|
6.4
|
4.8--8.5
|
9.9
|
8.2--11.9
|
|
Louisiana
|
17.5
|
13.6--22.3
|
18.1
|
13.5--23.8
|
17.8
|
14.0--22.4
|
|
---
|
---
|
---
|
---
|
---
|
---
|
|
Maine
|
13.9
|
12.8--15.1
|
16.6
|
15.4--17.9
|
15.4
|
14.5--16.2
|
|
12.8
|
11.8--13.9
|
8.6
|
7.7--9.6
|
10.7
|
10.0--11.5
|
|
Maryland
|
18.6
|
16.2--21.1
|
15.2
|
12.6--18.3
|
16.9
|
15.0--18.9
|
|
---
|
---
|
---
|
---
|
---
|
---
|
|
Massachusetts
|
---
|
---
|
---
|
---
|
---
|
---
|
|
---
|
---
|
---
|
---
|
---
|
---
|
|
Michigan
|
15.1
|
12.5--18.0
|
15.4
|
13.4--17.6
|
15.2
|
13.5--17.1
|
|
12.8
|
10.7--15.3
|
8.0
|
6.3--9.9
|
10.4
|
9.0--12.1
|
|
Mississippi
|
15.0
|
12.0--18.7
|
13.2
|
11.1--15.6
|
14.2
|
12.0--16.6
|
|
13.8
|
11.3--16.6
|
6.1
|
4.1--8.8
|
10.1
|
8.3--12.2
|
|
Missouri
|
10.2
|
7.0--14.4
|
11.3
|
8.4--15.1
|
10.7
|
8.1--14.0
|
|
12.0
|
8.3--17.0
|
4.4
|
2.5--7.7
|
8.1
|
5.8--11.2
|
|
Montana
|
8.0
|
6.4--10.0
|
10.9
|
8.2--14.4
|
9.6
|
8.0--11.6
|
|
13.7
|
11.8--15.8
|
4.8
|
3.5--6.6
|
9.2
|
8.0--10.7
|
|
Nevada
|
10.8
|
8.7--13.2
|
12.0
|
9.7--14.8
|
11.4
|
9.8--13.2
|
|
13.1
|
10.8--15.8
|
7.1
|
5.3--9.6
|
10.1
|
8.6--11.8
|
|
New Hampshire
|
8.0
|
6.0--10.5
|
11.1
|
8.4--14.4
|
9.6
|
8.0--11.6
|
|
9.4
|
7.1--12.3
|
4.8
|
3.4--6.7
|
7.0
|
5.6--8.8
|
|
New Jersey
|
---
|
---
|
---
|
---
|
---
|
---
|
|
10.4
|
8.3--12.8
|
5.1
|
3.3--7.7
|
7.7
|
6.3--9.5
|
|
New Mexico
|
9.5
|
7.9--11.4
|
10.0
|
9.0--11.1
|
9.8
|
8.7--11.1
|
|
11.6
|
10.2--13.2
|
5.8
|
4.9--7.0
|
8.7
|
8.0--9.4
|
|
New York
|
9.6
|
8.1--11.3
|
11.3
|
9.5--13.3
|
10.6
|
9.3--12.2
|
|
8.2
|
7.1--9.6
|
6.9
|
5.1--9.2
|
7.8
|
6.5--9.4
|
|
North Carolina
|
12.2
|
10.4--14.3
|
13.0
|
10.9--15.6
|
12.6
|
11.2--14.2
|
|
12.4
|
10.6--14.3
|
4.7
|
3.7--5.9
|
8.6
|
7.5--9.9
|
|
North Dakota
|
8.3
|
6.4--10.7
|
8.6
|
6.9--10.7
|
8.5
|
7.1--10.2
|
|
9.0
|
6.7--12.0
|
4.1
|
2.6--6.3
|
6.5
|
5.1--8.3
|
|
Oklahoma
|
6.2
|
4.7--8.1
|
8.6
|
6.7--10.9
|
7.4
|
6.3--8.7
|
|
9.1
|
6.5--12.6
|
3.8
|
2.2--6.3
|
6.4
|
4.8--8.4
|
|
Pennsylvania
|
10.8
|
8.4--13.7
|
8.2
|
6.2--10.8
|
9.6
|
7.9--11.7
|
|
8.9
|
6.8--11.5
|
4.7
|
3.0--7.4
|
6.8
|
5.3--8.8
|
|
Rhode Island
|
10.8
|
9.4--12.3
|
10.8
|
9.0--12.8
|
10.8
|
9.9--11.8
|
|
8.9
|
7.0--11.3
|
5.3
|
4.0--7.0
|
7.1
|
6.3--8.1
|
|
South Carolina
|
16.6
|
11.4--23.5
|
15.5
|
12.2--19.5
|
16.1
|
12.8--20.0
|
|
10.5
|
7.3--14.8
|
6.4
|
4.8--8.5
|
8.6
|
6.5--11.2
|
|
South Dakota
|
10.4
|
8.1--13.3
|
12.2
|
8.9--16.6
|
11.3
|
8.7--14.6
|
|
12.5
|
10.6--14.8
|
6.3
|
4.5--8.8
|
9.3
|
8.2--10.5
|
|
Tennessee
|
10.0
|
8.0--12.5
|
9.8
|
8.1--11.7
|
9.9
|
8.5--11.4
|
|
12.8
|
10.5--15.5
|
3.5
|
2.3--5.4
|
8.1
|
6.8--9.5
|
|
Texas
|
10.3
|
9.0--11.9
|
8.8
|
7.6--10.1
|
9.5
|
8.7--10.5
|
|
10.5
|
8.7--12.6
|
3.6
|
2.6--4.9
|
7.0
|
6.1--7.9
|
|
Utah
|
8.9
|
6.8--11.6
|
12.5
|
9.7--16.1
|
10.9
|
8.9--13.4
|
|
8.2
|
5.6--11.9
|
5.8
|
3.3--10.0
|
7.2
|
5.6--9.1
|
|
Vermont
|
6.7
|
5.6--8.1
|
8.0
|
7.2--8.9
|
7.4
|
6.7--8.2
|
|
---
|
---
|
---
|
---
|
---
|
---
|
|
West Virginia
|
12.0
|
9.7--14.8
|
15.5
|
12.0--19.7
|
13.8
|
12.0--15.7
|
|
14.1
|
11.1--17.8
|
8.3
|
6.4--10.8
|
11.2
|
9.4--13.2
|
|
Wisconsin
|
8.0
|
6.2--10.2
|
8.8
|
7.1--10.8
|
8.4
|
6.9--10.2
|
|
---
|
---
|
---
|
---
|
---
|
---
|
|
Wyoming
|
13.7
|
11.9--15.8
|
16.0
|
14.0--18.1
|
15.0
|
13.5--16.5
|
|
18.0
|
15.9--20.4
|
8.6
|
7.1--10.4
|
13.2
|
11.8--14.8
|
|
Median
|
10.8
|
11.9
|
11.1
|
|
12.4
|
5.9
|
8.8
|
|
Range
|
6.2--18.6
|
8.0--18.1
|
7.4--17.8
|
|
8.2--18.0
|
3.5--11.0
|
6.4--13.2
|
|
Local surveys
|
|
|
|
|
|
|
|
|
|
|
|
|
|
|
Boston, MA
|
14.3
|
11.6--17.5
|
13.1
|
10.3--16.5
|
13.6
|
11.7--15.8
|
|
13.0
|
10.2--16.5
|
6.2
|
4.5--8.4
|
9.6
|
7.8--11.8
|
|
Broward County, FL
|
10.8
|
8.8--13.3
|
13.0
|
10.6--15.8
|
11.8
|
10.0--13.9
|
|
7.5
|
5.7--9.9
|
6.2
|
4.6--8.2
|
6.8
|
5.5--8.3
|
|
Charlotte-Mecklenburg, NC
|
10.2
|
8.1--12.7
|
13.2
|
10.7--16.2
|
11.7
|
10.1--13.6
|
|
9.2
|
7.2--11.6
|
5.3
|
3.6--7.6
|
7.2
|
5.9--8.8
|
|
Chicago, IL
|
18.9
|
14.4--24.4
|
17.2
|
13.5--21.8
|
18.5
|
15.4--22.0
|
|
8.7
|
6.3--11.8
|
9.1
|
6.6--12.5
|
9.0
|
7.0--11.4
|
|
Clark County, NV
|
10.7
|
8.5--13.5
|
11.5
|
8.8--14.8
|
11.1
|
9.5--13.0
|
|
12.9
|
10.0--16.3
|
7.0
|
4.8--10.2
|
9.9
|
8.1--12.0
|
|
Dallas, TX
|
13.7
|
10.6--17.5
|
16.4
|
12.0--21.9
|
15.1
|
12.1--18.8
|
|
10.9
|
8.7--13.6
|
6.1
|
3.9--9.2
|
8.5
|
6.8--10.6
|
|
Detroit, MI
|
16.6
|
13.6--20.1
|
16.2
|
13.4--19.4
|
16.3
|
14.1--18.8
|
|
11.5
|
9.6--13.7
|
8.3
|
6.2--10.8
|
9.8
|
8.4--11.5
|
|
Duval County, FL
|
17.1
|
14.6--19.9
|
18.3
|
15.5--21.5
|
17.8
|
15.7--20.0
|
|
14.7
|
12.6--16.9
|
8.4
|
6.3--11.2
|
12.0
|
10.4--13.8
|
|
Los Angeles, CA
|
9.7
|
7.8--12.0
|
14.3
|
10.5--19.1
|
12.0
|
10.1--14.4
|
|
8.1
|
5.6--11.7
|
7.6
|
5.3--10.8
|
7.8
|
5.8--10.5
|
|
Memphis, TN
|
11.7
|
9.0--15.2
|
11.3
|
8.0--15.8
|
11.5
|
9.4--14.0
|
|
9.5
|
7.2--12.4
|
5.8
|
3.8--8.6
|
7.6
|
6.0--9.7
|
|
Miami-Dade County, FL
|
11.6
|
9.6--14.0
|
12.3
|
9.9--15.1
|
12.0
|
10.5--13.8
|
|
9.8
|
7.8--12.2
|
8.2
|
5.8--11.5
|
9.2
|
7.6--11.1
|
|
Milwaukee, WI
|
16.6
|
13.5--20.1
|
11.8
|
9.7--14.4
|
14.2
|
12.1--16.7
|
|
---
|
---
|
---
|
---
|
---
|
---
|
|
New York City, NY
|
9.8
|
8.6--11.1
|
12.2
|
10.7--13.9
|
10.9
|
9.9--12.1
|
|
8.2
|
6.9--9.8
|
6.1
|
5.3--7.1
|
7.3
|
6.4--8.3
|
|
Orange County, FL
|
8.1
|
6.3--10.4
|
10.8
|
8.0--14.4
|
9.5
|
7.7--11.7
|
|
9.1
|
6.8--12.0
|
4.7
|
3.0--7.2
|
6.8
|
5.4--8.6
|
|
Palm Beach County, FL
|
11.2
|
8.9--13.9
|
10.8
|
8.7--13.4
|
11.1
|
9.4--13.1
|
|
10.6
|
8.4--13.4
|
8.4
|
6.2--11.4
|
9.5
|
7.7--11.7
|
|
Philadelphia, PA
|
19.2
|
15.7--23.3
|
15.0
|
12.0--18.6
|
17.3
|
14.7--20.2
|
|
12.7
|
10.5--15.3
|
10.7
|
8.2--13.8
|
12.0
|
10.4--13.8
|
|
San Bernardino, CA
|
9.7
|
7.4--12.7
|
10.4
|
7.9--13.4
|
10.0
|
8.2--12.3
|
|
8.8
|
6.8--11.4
|
5.8
|
4.2--8.1
|
7.3
|
6.0--8.9
|
|
San Diego, CA
|
10.9
|
8.6--13.7
|
13.7
|
11.8--15.9
|
12.4
|
10.9--14.0
|
|
9.3
|
7.1--12.2
|
4.7
|
3.6--6.1
|
7.1
|
5.8--8.6
|
|
San Francisco, CA
|
6.8
|
5.3--8.6
|
9.0
|
7.4--10.8
|
8.0
|
6.8--9.3
|
|
7.0
|
5.4--9.1
|
4.9
|
3.8--6.3
|
6.0
|
4.9--7.4
|
|
Seattle, WA
|
11.1
|
8.9--13.8
|
14.7
|
12.1--17.8
|
13.1
|
11.2--15.3
|
|
9.0
|
7.1--11.2
|
6.9
|
5.2--9.1
|
7.9
|
6.7--9.4
|
|
Median
|
11.1
|
13.0
|
12.0
|
|
9.3
|
6.2
|
7.9
|
|
Range
|
6.8--19.2
|
9.0--18.3
|
8.0--18.5
|
|
7.0--14.7
|
4.7--10.7
|
6.0--12.0
|
|
|
Carried a weapon on school property
|
|
Threatened or injured with a weapon on school property
|
|
|
Female
|
Male
|
Total
|
|
Female
|
Male
|
Total
|
|
Category
|
%
|
CI¶
|
%
|
CI
|
%
|
CI
|
|
%
|
CI
|
%
|
CI
|
%
|
CI
|
|
Race/Ethnicity
|
|
|
|
|
|
|
|
|
|
|
|
|
|
|
White**
|
2.4
|
1.9--3.0
|
8.3
|
6.9--10.0
|
5.6
|
4.7--6.5
|
|
4.9
|
4.1--6.0
|
7.8
|
6.5--9.2
|
6.4
|
5.6--7.4
|
|
Black**
|
4.0
|
2.6--6.1
|
6.6
|
4.8--9.1
|
5.3
|
4.0--7.1
|
|
7.4
|
5.9--9.3
|
11.2
|
9.0--14.0
|
9.4
|
7.9--11.2
|
|
Hispanic
|
3.7
|
2.8--4.9
|
7.9
|
6.3--9.9
|
5.8
|
4.8--7.1
|
|
6.3
|
5.2--7.6
|
12.0
|
10.0--14.3
|
9.1
|
8.0--10.4
|
|
Grade
|
|
|
|
|
|
|
|
|
|
|
|
|
|
|
9
|
3.2
|
2.5--4.0
|
6.4
|
5.1--8.1
|
4.9
|
4.0--5.9
|
|
7.7
|
6.6--9.0
|
9.5
|
7.8--11.6
|
8.7
|
7.7--9.8
|
|
10
|
3.1
|
2.2--4.4
|
8.9
|
7.2--10.9
|
6.1
|
5.1--7.4
|
|
5.2
|
3.9--6.9
|
11.1
|
9.0--13.7
|
8.4
|
7.0--10.0
|
|
11
|
2.3
|
1.7--3.1
|
7.9
|
6.5--9.6
|
5.2
|
4.4--6.2
|
|
4.8
|
3.8--6.2
|
10.7
|
9.1--12.7
|
7.9
|
6.7--9.2
|
|
12
|
2.9
|
2.2--3.8
|
9.1
|
7.2--11.4
|
6.0
|
5.0--7.3
|
|
3.8
|
2.9--5.0
|
6.5
|
5.2--8.2
|
5.2
|
4.3--6.4
|
|
Total
|
2.9
|
2.5--3.4
|
8.0
|
7.1--9.2
|
5.6
|
5.0--6.3
|
|
5.5
|
4.8--6.3
|
9.6
|
8.5--10.8
|
7.7
|
6.9--8.5
|
|
|
Carried a weapon on school property
|
|
Threatened or injured with a weapon on school property
|
|
|
Female
|
Male
|
Total
|
|
Female
|
Male
|
Total
|
|
Site
|
%
|
CI¶
|
%
|
CI
|
%
|
CI
|
|
%
|
CI
|
%
|
CI
|
%
|
CI
|
|
State surveys
|
|
|
|
|
|
|
|
|
|
|
|
|
|
|
Alabama
|
4.8
|
2.7--8.5
|
12.5
|
8.3--18.6
|
8.7
|
6.2--12.1
|
|
6.8
|
4.0--11.4
|
13.6
|
9.5--19.0
|
10.4
|
7.5--14.1
|
|
Alaska
|
2.8
|
1.6--4.8
|
12.3
|
9.6--15.6
|
7.8
|
6.3--9.6
|
|
5.4
|
3.9--7.3
|
8.6
|
6.3--11.6
|
7.3
|
5.7--9.3
|
|
Arizona
|
3.4
|
2.3--5.0
|
9.0
|
7.3--11.1
|
6.5
|
5.3--7.9
|
|
5.5
|
4.2--7.2
|
12.6
|
10.0--15.7
|
9.3
|
7.6--11.3
|
|
Arkansas
|
4.6
|
3.3--6.4
|
12.0
|
9.0--15.8
|
8.4
|
6.6--10.8
|
|
8.6
|
5.9--12.4
|
15.2
|
12.0--18.9
|
11.9
|
9.4--15.1
|
|
Colorado
|
3.0
|
2.0--4.4
|
8.0
|
5.2--12.1
|
5.5
|
3.9--7.8
|
|
5.1
|
3.6--7.2
|
10.8
|
8.6--13.3
|
8.0
|
6.6--9.7
|
|
Connecticut
|
2.2
|
1.4--3.4
|
5.5
|
4.2--7.2
|
3.9
|
3.1--4.9
|
|
5.9
|
4.3--8.1
|
7.9
|
6.3--9.8
|
7.0
|
5.8--8.4
|
|
Delaware
|
4.1
|
2.8--5.9
|
5.9
|
4.6--7.4
|
5.1
|
4.1--6.4
|
|
6.3
|
4.8--8.3
|
8.8
|
6.9--11.0
|
7.8
|
6.6--9.1
|
|
Florida
|
2.2
|
1.7--2.8
|
7.1
|
5.8--8.6
|
4.7
|
4.0--5.5
|
|
5.8
|
5.0--6.7
|
10.3
|
9.2--11.7
|
8.2
|
7.4--9.0
|
|
Georgia
|
3.3
|
2.1--5.3
|
8.8
|
6.2--12.2
|
6.0
|
4.4--8.2
|
|
4.7
|
3.5--6.4
|
11.6
|
9.0--14.8
|
8.2
|
6.6--10.1
|
|
Hawaii
|
3.3
|
1.6--6.5
|
5.8
|
4.0--8.1
|
4.7
|
3.6--6.2
|
|
5.9
|
3.7--9.1
|
9.3
|
6.6--12.8
|
7.7
|
5.8--10.1
|
|
Idaho
|
2.5
|
1.6--4.1
|
10.6
|
8.9--12.5
|
6.7
|
5.6--8.0
|
|
5.8
|
4.6--7.4
|
9.8
|
8.0--12.0
|
7.9
|
6.7--9.3
|
|
Illinois
|
2.1
|
1.4--3.1
|
7.1
|
5.2--9.6
|
4.8
|
3.7--6.1
|
|
6.6
|
5.1--8.6
|
10.6
|
8.5--13.2
|
8.8
|
7.2--10.7
|
|
Indiana
|
2.7
|
1.5--4.8
|
8.6
|
6.0--12.0
|
5.7
|
4.2--7.6
|
|
6.3
|
4.7--8.4
|
6.7
|
5.0--8.8
|
6.5
|
5.2--8.0
|
|
Kansas
|
1.9
|
1.2--2.9
|
8.1
|
6.1--10.7
|
5.1
|
3.9--6.6
|
|
4.9
|
3.5--6.8
|
7.4
|
5.7--9.4
|
6.2
|
5.0--7.6
|
|
Kentucky
|
2.5
|
1.3--4.7
|
10.3
|
7.9--13.2
|
6.5
|
5.1--8.2
|
|
5.2
|
3.5--7.5
|
10.4
|
7.7--13.8
|
7.9
|
6.1--10.2
|
|
Louisiana
|
3.0
|
1.7--5.3
|
8.6
|
5.0--14.6
|
5.8
|
3.8--8.7
|
|
6.3
|
4.8--8.2
|
12.9
|
8.5--19.1
|
9.5
|
7.1--12.7
|
|
Maine
|
---**
|
---
|
---
|
---
|
---
|
---
|
|
5.4
|
4.8--6.2
|
9.5
|
8.6--10.4
|
7.7
|
7.1--8.3
|
|
Maryland
|
2.6
|
1.6--4.3
|
6.3
|
4.6--8.6
|
4.6
|
3.5--6.0
|
|
7.8
|
5.5--11.0
|
10.0
|
7.9--12.5
|
9.1
|
7.6--10.8
|
|
Massachusetts
|
1.9
|
1.2--3.1
|
6.7
|
5.0--8.9
|
4.4
|
3.3--5.7
|
|
4.2
|
3.2--5.4
|
9.7
|
8.0--11.9
|
7.0
|
5.9--8.3
|
|
Michigan
|
3.2
|
2.3--4.3
|
7.3
|
6.2--8.6
|
5.4
|
4.7--6.1
|
|
7.0
|
5.5--9.0
|
11.5
|
9.8--13.4
|
9.4
|
8.2--10.8
|
|
Mississippi
|
2.3
|
1.5--3.4
|
6.8
|
5.3--8.7
|
4.5
|
3.6--5.6
|
|
6.0
|
4.6--7.7
|
9.9
|
8.1--12.2
|
8.0
|
6.6--9.5
|
|
Missouri
|
1.9
|
1.2--2.9
|
8.6
|
5.1--14.1
|
5.3
|
3.5--8.0
|
|
5.3
|
3.7--7.5
|
10.2
|
7.5--13.6
|
7.8
|
6.3--9.6
|
|
Montana
|
2.3
|
1.4--3.8
|
13.2
|
10.8--16.1
|
7.9
|
6.6--9.4
|
|
5.3
|
3.0--9.0
|
9.4
|
7.4--11.9
|
7.4
|
5.7--9.7
|
|
Nevada
|
3.5
|
2.4--5.1
|
8.9
|
6.8--11.4
|
6.2
|
5.1--7.6
|
|
8.4
|
6.9--10.3
|
12.8
|
10.5--15.6
|
10.7
|
9.1--12.5
|
|
New Hampshire
|
3.4
|
2.1--5.3
|
13.7
|
10.7--17.4
|
8.8
|
7.0--11.0
|
|
---
|
---
|
---
|
---
|
---
|
---
|
|
New Jersey
|
1.5
|
0.5--4.1
|
4.8
|
3.4--6.7
|
3.1
|
2.3--4.2
|
|
5.3
|
3.7--7.4
|
7.8
|
5.7--10.7
|
6.6
|
5.1--8.4
|
|
New Mexico
|
4.9
|
3.9--6.1
|
11.1
|
9.5--13.1
|
8.1
|
6.9--9.5
|
|
---
|
---
|
---
|
---
|
---
|
---
|
|
New York
|
2.4
|
1.7--3.6
|
6.6
|
5.3--8.3
|
4.8
|
3.7--6.2
|
|
4.7
|
3.5--6.2
|
9.9
|
8.5--11.6
|
7.5
|
6.5--8.7
|
|
North Carolina
|
2.5
|
1.7--3.7
|
7.0
|
5.4--9.0
|
4.7
|
3.7--6.0
|
|
5.1
|
4.2--6.2
|
8.4
|
6.7--10.6
|
6.8
|
5.7--8.1
|
|
North Dakota
|
2.0
|
1.0--4.0
|
8.5
|
6.5--11.0
|
5.4
|
4.3--6.8
|
|
---
|
---
|
---
|
---
|
---
|
---
|
|
Oklahoma
|
3.6
|
2.3--5.7
|
7.4
|
5.1--10.6
|
5.6
|
4.2--7.5
|
|
4.0
|
2.4--6.5
|
7.6
|
6.0--9.6
|
5.8
|
4.6--7.4
|
|
Pennsylvania
|
2.1
|
1.1--3.8
|
4.5
|
3.1--6.5
|
3.3
|
2.5--4.4
|
|
4.5
|
3.1--6.7
|
6.6
|
4.8--9.2
|
5.6
|
4.3--7.3
|
|
Rhode Island
|
2.3
|
1.6--3.1
|
5.8
|
4.9--6.8
|
4.0
|
3.4--4.8
|
|
3.8
|
2.8--5.1
|
9.2
|
6.8--12.3
|
6.5
|
5.3--8.0
|
|
South Carolina
|
3.9
|
2.2--6.8
|
5.4
|
3.3--8.8
|
4.6
|
3.4--6.3
|
|
6.5
|
3.8--11.0
|
10.9
|
7.5--15.6
|
8.8
|
6.2--12.4
|
|
South Dakota
|
3.0
|
2.1--4.2
|
15.0
|
12.3--18.2
|
9.2
|
7.7--10.8
|
|
4.6
|
3.2--6.6
|
8.9
|
6.9--11.4
|
6.8
|
5.2--8.8
|
|
Tennessee
|
2.4
|
1.5--3.6
|
7.7
|
5.6--10.5
|
5.1
|
3.8--6.7
|
|
5.0
|
3.5--6.9
|
9.0
|
7.2--11.2
|
7.0
|
5.7--8.6
|
|
Texas
|
3.1
|
2.1--4.5
|
9.6
|
7.3--12.5
|
6.4
|
5.0--8.2
|
|
5.5
|
4.1--7.4
|
8.8
|
7.4--10.5
|
7.2
|
6.2--8.4
|
|
Utah
|
1.6
|
0.8--3.0
|
7.1
|
5.1--10.0
|
4.6
|
3.4--6.1
|
|
4.2
|
2.6--6.7
|
10.7
|
8.2--13.7
|
7.7
|
6.1--9.7
|
|
Vermont
|
3.3
|
2.9--3.7
|
14.1
|
11.7--16.9
|
9.0
|
7.7--10.4
|
|
4.5
|
3.6--5.6
|
7.3
|
6.3--8.5
|
6.0
|
5.4--6.7
|
|
West Virginia
|
3.0
|
1.9--4.9
|
9.8
|
7.4--12.7
|
6.5
|
5.1--8.2
|
|
5.7
|
4.0--8.0
|
11.9
|
9.6--14.8
|
9.2
|
7.7--11.0
|
|
Wisconsin
|
1.5
|
1.0--2.2
|
5.2
|
3.7--7.3
|
3.4
|
2.5--4.6
|
|
4.8
|
3.5--6.6
|
8.5
|
6.7--10.7
|
6.7
|
5.3--8.4
|
|
Wyoming
|
5.2
|
4.2--6.4
|
17.1
|
14.7--19.8
|
11.5
|
10.0--13.2
|
|
6.3
|
5.2--7.6
|
12.3
|
10.7--14.2
|
9.4
|
8.3--10.6
|
|
Median
|
2.7
|
8.1
|
5.4
|
|
5.4
|
9.8
|
7.7
|
|
Range
|
1.5--5.2
|
4.5--17.1
|
3.1--11.5
|
|
3.8--8.6
|
6.6--15.2
|
5.6--11.9
|
|
Local surveys
|
|
|
|
|
|
|
|
|
|
|
|
|
|
|
Boston, MA
|
3.3
|
2.1--5.2
|
11.1
|
7.5--16.2
|
7.2
|
5.3--9.8
|
|
3.8
|
2.5--5.7
|
11.1
|
8.6--14.2
|
7.5
|
6.1--9.1
|
|
Broward County, FL
|
2.5
|
1.6--4.1
|
6.6
|
5.0--8.8
|
4.5
|
3.5--6.0
|
|
6.5
|
4.7--9.1
|
9.7
|
7.4--12.6
|
8.1
|
6.5--10.1
|
|
Charlotte-Mecklenburg, NC
|
2.0
|
1.1--3.4
|
5.0
|
3.3--7.4
|
3.5
|
2.5--4.9
|
|
5.1
|
3.7--7.0
|
11.7
|
9.0--15.1
|
8.4
|
6.7--10.6
|
|
Chicago, IL
|
5.6
|
2.8--11.2
|
8.1
|
5.6--11.6
|
7.5
|
5.2--10.6
|
|
9.5
|
7.5--12.0
|
15.3
|
10.8--21.3
|
13.2
|
10.4--16.8
|
|
Clark County, NV
|
3.5
|
2.1--5.7
|
5.2
|
3.7--7.2
|
4.4
|
3.4--5.6
|
|
8.7
|
6.9--11.1
|
12.7
|
10.2--15.6
|
10.7
|
9.0--12.8
|
|
Dallas, TX
|
2.1
|
1.0--4.4
|
7.2
|
4.7--11.0
|
4.6
|
3.2--6.6
|
|
4.5
|
3.0--6.5
|
10.4
|
7.8--13.7
|
7.5
|
5.9--9.6
|
|
Detroit, MI
|
6.1
|
4.4--8.3
|
9.2
|
6.7--12.5
|
7.6
|
6.1--9.6
|
|
10.1
|
7.5--13.6
|
15.8
|
12.4--19.9
|
13.0
|
10.6--15.8
|
|
Duval County, FL
|
6.1
|
4.8--7.8
|
9.4
|
7.3--11.9
|
7.8
|
6.6--9.3
|
|
10.2
|
8.3--12.5
|
16.5
|
13.8--19.6
|
13.9
|
12.0--16.0
|
|
Los Angeles, CA
|
1.2
|
0.6--2.6
|
5.9
|
3.6--9.4
|
3.7
|
2.5--5.4
|
|
5.4
|
3.4--8.3
|
11.1
|
8.1--15.0
|
8.4
|
6.4--10.8
|
|
Memphis, TN
|
1.6
|
0.8--3.2
|
3.4
|
2.1--5.5
|
2.6
|
1.8--3.7
|
|
5.7
|
4.0--8.1
|
9.2
|
6.7--12.4
|
7.5
|
6.0--9.3
|
|
Miami-Dade County, FL
|
2.1
|
1.2--3.7
|
6.5
|
5.0--8.4
|
4.2
|
3.3--5.5
|
|
4.9
|
3.5--6.8
|
10.0
|
8.1--12.3
|
7.4
|
6.1--8.9
|
|
Milwaukee, WI
|
2.8
|
1.8--4.4
|
7.1
|
5.6--9.1
|
5.1
|
4.2--6.2
|
|
8.8
|
6.8--11.4
|
16.0
|
13.6--18.8
|
12.6
|
10.9--14.5
|
|
New York City, NY
|
2.5
|
2.0--3.0
|
5.2
|
4.5--6.0
|
3.8
|
3.3--4.2
|
|
5.0
|
4.1--6.0
|
9.7
|
8.6--11.0
|
7.2
|
6.4--8.2
|
|
Orange County, FL
|
2.6
|
1.4--4.7
|
5.6
|
4.0--8.0
|
4.2
|
3.0--5.8
|
|
6.9
|
4.8--9.7
|
9.5
|
7.6--11.7
|
8.1
|
6.6--10.1
|
|
Palm Beach County, FL
|
2.8
|
1.9--4.2
|
7.3
|
5.6--9.5
|
5.1
|
4.1--6.3
|
|
6.8
|
5.1--9.2
|
12.7
|
10.5--15.3
|
9.8
|
8.4--11.5
|
|
Philadelphia, PA
|
3.0
|
2.0--4.7
|
5.8
|
3.8--8.8
|
4.6
|
3.3--6.3
|
|
6.0
|
4.1--8.7
|
9.3
|
6.9--12.4
|
8.0
|
6.2--10.2
|
|
San Bernardino, CA
|
5.2
|
3.5--7.6
|
10.3
|
7.7--13.5
|
7.7
|
6.1--9.8
|
|
8.0
|
6.2--10.3
|
15.4
|
12.9--18.4
|
11.8
|
10.1--13.6
|
|
San Diego, CA
|
3.2
|
2.2--4.5
|
5.5
|
4.1--7.4
|
4.4
|
3.4--5.5
|
|
5.5
|
3.7--8.2
|
9.1
|
7.4--11.2
|
7.4
|
6.0--9.0
|
|
San Francisco, CA
|
4.0
|
2.8--5.7
|
8.5
|
6.9--10.4
|
6.5
|
5.4--7.8
|
|
3.3
|
2.2--4.9
|
10.6
|
8.8--12.7
|
7.2
|
6.1--8.6
|
|
Seattle, WA
|
3.0
|
2.1--4.5
|
7.7
|
5.9--10.0
|
5.6
|
4.4--7.0
|
|
5.4
|
3.8--7.5
|
9.5
|
7.5--12.0
|
7.8
|
6.5--9.3
|
|
Median
|
2.9
|
6.8
|
4.6
|
|
5.8
|
10.8
|
8.1
|
|
Range
|
1.2--6.1
|
3.4--11.1
|
2.6--7.8
|
|
3.3--10.2
|
9.1--16.5
|
7.2--13.9
|
|
|
In a physical fight on school property
|
|
Bullied on school property
|
|
|
Female
|
Male
|
Total
|
|
Female
|
Male
|
Total
|
|
Category
|
%
|
CI§
|
%
|
CI
|
%
|
CI
|
|
%
|
CI
|
%
|
CI
|
%
|
CI
|
|
Race/Ethnicity
|
|
|
|
|
|
|
|
|
|
|
|
|
|
|
White¶
|
4.3
|
3.5--5.2
|
12.4
|
10.1--15.2
|
8.6
|
7.5--9.9
|
|
23.5
|
21.3--25.9
|
19.9
|
18.0--21.9
|
21.6
|
19.9--23.4
|
|
Black¶
|
12.5
|
9.8--15.7
|
22.2
|
19.5--25.1
|
17.4
|
15.4--19.4
|
|
15.5
|
13.0--18.4
|
11.9
|
9.4--14.9
|
13.7
|
11.8--15.8
|
|
Hispanic
|
9.3
|
7.6--11.3
|
17.7
|
15.3--20.4
|
13.5
|
12.0--15.3
|
|
18.9
|
17.1--20.9
|
18.0
|
15.4--21.0
|
18.5
|
16.8--20.2
|
|
Grade
|
|
|
|
|
|
|
|
|
|
|
|
|
|
|
9
|
9.5
|
8.1--11.0
|
19.7
|
16.4--23.4
|
14.9
|
13.1--17.0
|
|
26.0
|
23.5--28.5
|
23.3
|
20.5--26.4
|
24.5
|
22.4--26.8
|
|
10
|
7.3
|
6.0--9.0
|
16.4
|
13.3--20.0
|
12.1
|
10.6--13.9
|
|
22.2
|
19.8--24.7
|
20.8
|
18.9--22.9
|
21.5
|
19.9--23.2
|
|
11
|
5.5
|
4.2--7.1
|
13.3
|
11.5--15.4
|
9.5
|
8.3--10.9
|
|
20.5
|
17.8--23.4
|
17.1
|
15.0--19.4
|
18.7
|
16.8--20.8
|
|
12
|
3.8
|
3.0--4.9
|
9.3
|
7.6--11.4
|
6.6
|
5.5--7.9
|
|
15.3
|
13.5--17.4
|
11.8
|
9.8--14.1
|
13.5
|
12.1--15.2
|
|
Total
|
6.7
|
5.9--7.6
|
15.1
|
13.1--17.3
|
11.1
|
10.0--12.2
|
|
21.2
|
19.8--22.7
|
18.7
|
17.4--20.1
|
19.9
|
18.8--21.1
|
|
|
In a physical fight on school property
|
|
Bullied on school property
|
|
|
Female
|
Male
|
Total
|
|
Female
|
Male
|
Total
|
|
Site
|
%
|
CI§
|
%
|
CI
|
%
|
CI
|
|
%
|
CI
|
%
|
CI
|
%
|
CI
|
|
State surveys
|
|
|
|
|
|
|
|
|
|
|
|
|
|
|
Alabama
|
6.6
|
4.5--9.7
|
19.2
|
15.1--24.1
|
13.1
|
10.4--16.3
|
|
21.9
|
18.3--26.0
|
16.7
|
13.4--20.5
|
19.3
|
16.5--22.6
|
|
Alaska
|
6.8
|
4.8--9.6
|
12.5
|
9.8--15.8
|
9.8
|
7.9--12.1
|
|
22.6
|
19.3--26.3
|
18.5
|
15.5--22.1
|
20.7
|
18.3--23.4
|
|
Arizona
|
7.3
|
5.8--9.2
|
16.4
|
14.3--18.8
|
12.0
|
10.5--13.8
|
|
---¶
|
---
|
---
|
---
|
---
|
---
|
|
Arkansas
|
10.0
|
7.5--13.3
|
19.6
|
16.4--23.4
|
14.8
|
12.3--17.7
|
|
---
|
---
|
---
|
---
|
---
|
---
|
|
Colorado
|
5.0
|
3.7--6.7
|
16.2
|
14.0--18.8
|
10.7
|
9.1--12.6
|
|
20.3
|
16.2--25.0
|
17.5
|
13.9--21.7
|
18.8
|
15.7--22.4
|
|
Connecticut
|
5.9
|
4.1--8.5
|
13.0
|
10.3--16.2
|
9.6
|
8.1--11.3
|
|
---
|
---
|
---
|
---
|
---
|
---
|
|
Delaware
|
7.3
|
5.7--9.2
|
9.6
|
7.7--11.9
|
8.6
|
7.3--10.2
|
|
18.8
|
16.0--22.0
|
12.7
|
10.6--15.1
|
15.9
|
13.8--18.2
|
|
Florida
|
7.4
|
6.3--8.6
|
13.6
|
12.1--15.2
|
10.5
|
9.6--11.5
|
|
13.8
|
12.4--15.3
|
13.0
|
11.7--14.3
|
13.4
|
12.4--14.4
|
|
Georgia
|
9.2
|
6.7--12.5
|
14.2
|
11.6--17.3
|
11.7
|
9.4--14.4
|
|
---
|
---
|
---
|
---
|
---
|
---
|
|
Hawaii
|
8.2
|
6.2--10.7
|
11.7
|
8.8--15.3
|
10.2
|
8.3--12.4
|
|
---
|
---
|
---
|
---
|
---
|
---
|
|
Idaho
|
5.8
|
4.3--7.9
|
14.3
|
12.1--16.9
|
10.2
|
8.7--11.9
|
|
23.8
|
21.1--26.7
|
20.8
|
18.1--23.8
|
22.3
|
20.3--24.5
|
|
Illinois
|
8.0
|
6.2--10.3
|
14.7
|
12.7--17.0
|
11.5
|
9.9--13.3
|
|
20.3
|
17.5--23.4
|
19.0
|
15.0--23.7
|
19.6
|
16.8--22.8
|
|
Indiana
|
8.4
|
5.9--11.9
|
10.6
|
8.4--13.3
|
9.5
|
7.3--12.2
|
|
25.4
|
21.7--29.6
|
20.3
|
16.3--25.0
|
22.8
|
19.4--26.4
|
|
Kansas
|
4.7
|
3.2--6.9
|
13.1
|
11.0--15.6
|
9.0
|
7.5--10.9
|
|
20.8
|
17.4--24.6
|
16.3
|
13.5--19.6
|
18.5
|
16.1--21.1
|
|
Kentucky
|
5.1
|
3.5--7.3
|
13.8
|
11.3--16.7
|
9.5
|
7.8--11.6
|
|
21.9
|
19.0--25.0
|
19.7
|
16.4--23.5
|
20.8
|
18.3--23.6
|
|
Louisiana
|
10.9
|
8.5--13.9
|
16.5
|
11.6--23.0
|
13.7
|
11.2--16.7
|
|
18.8
|
15.2--22.9
|
12.9
|
8.8--18.5
|
15.9
|
12.3--20.4
|
|
Maine
|
5.3
|
4.6--6.1
|
12.4
|
11.4--13.4
|
9.1
|
8.4--9.7
|
|
22.1
|
20.9--23.4
|
22.6
|
21.2--24.1
|
22.4
|
21.4--23.3
|
|
Maryland
|
7.8
|
5.5--11.1
|
14.3
|
10.7--18.8
|
11.2
|
8.8--14.3
|
|
22.2
|
19.6--24.9
|
19.5
|
16.4--23.0
|
20.9
|
19.0--23.1
|
|
Massachusetts
|
5.8
|
4.4--7.5
|
11.5
|
9.4--14.0
|
8.7
|
7.4--10.2
|
|
19.8
|
17.5--22.3
|
19.0
|
16.5--21.8
|
19.4
|
17.6--21.3
|
|
Michigan
|
7.4
|
5.6--9.8
|
14.9
|
12.6--17.6
|
11.3
|
9.4--13.6
|
|
26.6
|
22.6--31.0
|
21.3
|
17.6--25.6
|
24.0
|
20.5--27.8
|
|
Mississippi
|
9.8
|
7.3--13.0
|
15.5
|
12.5--19.0
|
12.6
|
10.7--14.9
|
|
17.9
|
15.3--20.9
|
14.0
|
11.6--16.7
|
16.0
|
13.9--18.3
|
|
Missouri
|
6.4
|
4.1--9.9
|
11.5
|
9.2--14.3
|
9.0
|
7.1--11.4
|
|
24.5
|
19.9--29.8
|
21.2
|
17.2--25.9
|
22.8
|
19.2--26.8
|
|
Montana
|
6.8
|
4.5--10.0
|
14.7
|
11.7--18.3
|
10.8
|
8.4--13.8
|
|
24.8
|
21.4--28.6
|
21.2
|
17.7--25.2
|
23.1
|
20.5--25.8
|
|
Nevada
|
7.0
|
5.3--9.3
|
12.9
|
11.0--15.2
|
10.0
|
8.5--11.8
|
|
---
|
---
|
---
|
---
|
---
|
---
|
|
New Hampshire
|
6.8
|
4.8--9.5
|
11.2
|
8.6--14.4
|
9.1
|
7.5--11.0
|
|
24.4
|
20.5--28.8
|
19.9
|
16.0--24.4
|
22.1
|
19.2--25.3
|
|
New Jersey
|
---
|
---
|
---
|
---
|
---
|
---
|
|
20.0
|
16.3--24.2
|
21.5
|
18.6--24.8
|
20.7
|
17.8--23.9
|
|
New Mexico
|
10.8
|
8.9--12.9
|
19.1
|
16.7--21.8
|
15.0
|
13.3--17.0
|
|
21.2
|
18.8--23.8
|
17.7
|
16.4--19.1
|
19.5
|
17.8--21.3
|
|
New York
|
7.9
|
6.4--9.8
|
14.5
|
12.3--16.9
|
11.4
|
9.7--13.3
|
|
18.8
|
16.6--21.1
|
17.3
|
14.6--20.4
|
18.2
|
16.3--20.3
|
|
North Carolina
|
5.9
|
4.8--7.1
|
13.0
|
11.3--15.0
|
9.4
|
8.6--10.3
|
|
19.2
|
16.3--22.4
|
13.7
|
11.5--16.1
|
16.6
|
14.7--18.6
|
|
North Dakota
|
4.4
|
2.7--6.9
|
10.2
|
8.3--12.5
|
7.4
|
6.0--9.1
|
|
22.7
|
19.0--26.8
|
19.4
|
16.3--23.0
|
21.1
|
18.7--23.8
|
|
Oklahoma
|
8.2
|
5.7--11.8
|
17.3
|
13.2--22.3
|
12.8
|
10.1--16.1
|
|
20.6
|
16.8--25.0
|
14.6
|
11.8--17.9
|
17.5
|
15.1--20.2
|
|
Pennsylvania
|
6.0
|
4.3--8.4
|
13.5
|
10.5--17.2
|
9.9
|
8.0--12.2
|
|
20.4
|
17.5--23.7
|
17.9
|
15.1--21.1
|
19.2
|
16.9--21.8
|
|
Rhode Island
|
6.4
|
5.1--8.1
|
11.7
|
9.9--13.7
|
9.1
|
7.7--10.8
|
|
17.4
|
14.2--21.0
|
15.3
|
13.5--17.3
|
16.3
|
14.6--18.2
|
|
South Carolina
|
9.2
|
6.5--13.0
|
15.0
|
11.1--19.9
|
12.1
|
9.4--15.4
|
|
15.3
|
11.2--20.5
|
14.7
|
11.2--19.0
|
15.1
|
12.2--18.6
|
|
South Dakota
|
2.8
|
1.8--4.4
|
13.6
|
11.7--15.7
|
8.3
|
7.3--9.4
|
|
---
|
---
|
---
|
---
|
---
|
---
|
|
Tennessee
|
7.8
|
6.2--9.8
|
14.5
|
11.8--17.7
|
11.3
|
9.4--13.4
|
|
19.9
|
16.8--23.3
|
14.7
|
12.2--17.6
|
17.3
|
14.9--20.0
|
|
Texas
|
7.3
|
6.2--8.6
|
18.8
|
16.8--21.0
|
13.2
|
11.8--14.7
|
|
20.9
|
18.8--23.2
|
16.5
|
13.5--19.9
|
18.7
|
16.6--21.0
|
|
Utah
|
4.4
|
3.0--6.2
|
16.1
|
13.4--19.2
|
10.6
|
9.0--12.4
|
|
16.6
|
13.4--20.5
|
20.8
|
17.6--24.4
|
18.8
|
16.8--21.0
|
|
Vermont
|
6.4
|
5.4--7.7
|
15.1
|
13.3--17.1
|
11.0
|
10.2--11.8
|
|
---
|
---
|
---
|
---
|
---
|
---
|
|
West Virginia
|
7.6
|
5.9--9.7
|
14.4
|
11.2--18.4
|
11.3
|
9.3--13.8
|
|
25.6
|
22.2--29.5
|
21.3
|
17.6--25.6
|
23.5
|
20.8--26.4
|
|
Wisconsin
|
6.7
|
4.8--9.1
|
12.5
|
10.1--15.2
|
9.6
|
8.0--11.6
|
|
23.0
|
19.8--26.6
|
22.1
|
18.8--25.8
|
22.5
|
20.0--25.2
|
|
Wyoming
|
7.5
|
6.3--9.0
|
17.4
|
15.3--19.8
|
12.6
|
11.3--14.2
|
|
25.5
|
23.0--28.2
|
23.5
|
21.1--26.2
|
24.4
|
22.6--26.3
|
|
Median
|
7.0
|
14.3
|
10.6
|
|
20.8
|
18.8
|
19.4
|
|
Range
|
2.8--10.9
|
9.6--19.6
|
7.4--15.0
|
|
13.8--26.6
|
12.7--23.5
|
13.4--24.4
|
|
Local surveys
|
|
|
|
|
|
|
|
|
|
|
|
|
|
|
Boston, MA
|
8.0
|
6.0--10.5
|
16.1
|
12.2--21.0
|
12.0
|
9.6--14.9
|
|
11.8
|
9.4--14.8
|
11.4
|
8.7--14.7
|
11.6
|
9.6--14.1
|
|
Broward County, FL
|
8.1
|
6.0--10.9
|
13.7
|
11.1--16.7
|
11.0
|
9.0--13.3
|
|
14.2
|
11.5--17.3
|
10.6
|
8.1--13.7
|
12.4
|
10.3--14.7
|
|
Charlotte-Mecklenburg, NC
|
6.0
|
4.2--8.5
|
13.0
|
9.9--16.9
|
9.4
|
7.5--11.8
|
|
17.2
|
14.4--20.5
|
15.3
|
12.8--18.1
|
16.4
|
14.5--18.4
|
|
Chicago, IL
|
15.3
|
10.9--21.0
|
24.9
|
20.5--29.8
|
20.6
|
16.8--25.0
|
|
9.3
|
7.2--12.0
|
12.6
|
10.1--15.6
|
11.1
|
9.4--13.1
|
|
Clark County, NV
|
6.4
|
4.5--8.9
|
12.2
|
10.1--14.8
|
9.3
|
7.6--11.4
|
|
---
|
---
|
---
|
---
|
---
|
---
|
|
Dallas, TX
|
11.7
|
9.0--15.0
|
17.4
|
12.7--23.3
|
14.5
|
11.7--17.8
|
|
13.4
|
10.6--16.9
|
12.6
|
8.8--17.7
|
13.0
|
10.6--15.9
|
|
Detroit, MI
|
19.4
|
16.2--23.0
|
30.9
|
26.3--36.0
|
25.4
|
22.0--29.2
|
|
18.1
|
15.1--21.7
|
21.6
|
16.2--28.2
|
20.1
|
16.2--24.6
|
|
Duval County, FL
|
11.5
|
9.5--13.8
|
16.2
|
13.7--18.9
|
14.0
|
12.2--16.0
|
|
17.8
|
15.7--20.0
|
14.4
|
12.1--17.2
|
16.3
|
14.6--18.1
|
|
Los Angeles, CA
|
8.7
|
6.6--11.2
|
16.9
|
14.4--19.8
|
12.9
|
10.8--15.2
|
|
14.9
|
12.8--17.3
|
15.1
|
12.7--17.8
|
15.0
|
13.2--16.9
|
|
Memphis, TN
|
14.4
|
11.1--18.6
|
20.7
|
16.0--26.2
|
17.4
|
14.1--21.3
|
|
9.8
|
7.5--12.7
|
8.6
|
6.6--11.1
|
9.3
|
7.8--11.1
|
|
Miami-Dade County, FL
|
10.8
|
8.5--13.7
|
16.9
|
13.8--20.4
|
13.9
|
11.5--16.6
|
|
11.1
|
9.3--13.1
|
10.4
|
8.6--12.5
|
10.7
|
9.3--12.3
|
|
Milwaukee, WI
|
14.7
|
12.2--17.7
|
23.2
|
20.4--26.3
|
19.0
|
16.9--21.2
|
|
13.7
|
11.4--16.3
|
11.5
|
8.8--14.8
|
12.6
|
10.7--14.8
|
|
New York City, NY
|
9.4
|
7.9--11.1
|
16.1
|
14.8--17.5
|
12.6
|
11.2--14.0
|
|
11.2
|
10.0--12.5
|
11.1
|
9.9--12.4
|
11.2
|
10.5--11.9
|
|
Orange County, FL
|
7.5
|
5.2--10.8
|
17.2
|
13.2--22.1
|
12.4
|
9.7--15.6
|
|
14.9
|
11.8--18.6
|
12.5
|
9.4--16.4
|
13.6
|
11.4--16.2
|
|
Palm Beach County, FL
|
7.2
|
5.6--9.1
|
12.5
|
10.2--15.1
|
9.9
|
8.4--11.6
|
|
17.1
|
14.7--19.9
|
15.1
|
12.9--17.7
|
16.2
|
14.4--18.2
|
|
Philadelphia, PA
|
16.0
|
12.8--19.8
|
22.7
|
18.3--27.8
|
19.3
|
16.3--22.8
|
|
11.7
|
9.6--14.3
|
14.4
|
11.3--18.2
|
13.0
|
11.1--15.2
|
|
San Bernardino, CA
|
12.0
|
9.3--15.4
|
23.4
|
19.5--27.8
|
17.9
|
15.2--20.9
|
|
15.4
|
12.6--18.7
|
12.8
|
9.9--16.3
|
14.1
|
11.9--16.5
|
|
San Diego, CA
|
8.0
|
5.8--10.9
|
13.7
|
11.3--16.4
|
10.8
|
9.0--12.9
|
|
---
|
---
|
---
|
---
|
---
|
---
|
|
San Francisco, CA
|
6.1
|
4.5--8.2
|
14.1
|
11.7--16.9
|
10.3
|
8.8--12.1
|
|
10.0
|
8.5--11.7
|
15.0
|
13.0--17.2
|
12.6
|
11.3--14.1
|
|
Seattle, WA
|
5.4
|
3.9--7.5
|
14.7
|
12.1--17.7
|
10.5
|
8.7--12.5
|
|
13.1
|
10.8--15.8
|
16.7
|
14.1--19.7
|
14.9
|
13.0--17.1
|
|
Median
|
9.0
|
16.5
|
12.7
|
|
13.5
|
12.7
|
13.0
|
|
Range
|
5.4--19.4
|
12.2--30.9
|
9.3--25.4
|
|
9.3--18.1
|
8.6--21.6
|
9.3--20.1
|
|
|
Female
|
Male
|
Total
|
|
Category
|
%
|
CI†
|
%
|
CI
|
%
|
CI
|
|
Race/Ethnicity
|
|
|
|
|
|
|
|
White§
|
3.8
|
3.1--4.8
|
3.3
|
2.5--4.2
|
3.5
|
2.9--4.3
|
|
Black§
|
6.6
|
4.7--9.2
|
5.9
|
4.6--7.7
|
6.3
|
4.9--8.0
|
|
Hispanic
|
8.3
|
6.9--10.0
|
7.9
|
6.0--10.3
|
8.1
|
6.9--9.4
|
|
Grade
|
|
|
|
|
|
|
|
9
|
6.4
|
5.0--8.0
|
5.4
|
4.3--6.8
|
5.8
|
5.0--6.8
|
|
10
|
5.3
|
4.2--6.8
|
4.6
|
3.4--6.1
|
5.0
|
4.0--6.1
|
|
11
|
5.8
|
4.3--7.7
|
4.9
|
3.7--6.6
|
5.3
|
4.3--6.7
|
|
12
|
3.3
|
2.5--4.4
|
3.4
|
2.3--4.9
|
3.4
|
2.6--4.3
|
|
Total
|
5.3
|
4.6--6.1
|
4.6
|
3.8--5.6
|
5.0
|
4.3--5.7
|
|
|
Female
|
Male
|
Total
|
|
Site
|
%
|
CI†
|
%
|
CI
|
%
|
CI
|
|
State surveys
|
|
|
|
|
|
|
|
Alabama
|
7.2
|
5.1--10.0
|
11.8
|
7.2--18.8
|
9.6
|
6.6--13.7
|
|
Alaska
|
6.5
|
4.8--8.7
|
5.4
|
3.8--7.6
|
6.0
|
4.9--7.5
|
|
Arizona
|
7.5
|
5.4--10.2
|
6.8
|
5.6--8.2
|
7.4
|
6.1--8.8
|
|
Arkansas
|
8.3
|
5.7--11.8
|
12.4
|
8.9--16.9
|
10.4
|
7.6--14.0
|
|
Colorado
|
4.8
|
3.5--6.5
|
5.5
|
3.3--9.2
|
5.1
|
3.8--7.0
|
|
Connecticut
|
4.6
|
3.2--6.8
|
5.1
|
3.7--7.0
|
4.9
|
4.0--6.0
|
|
Delaware
|
7.2
|
5.8--8.9
|
5.1
|
3.8--6.9
|
6.3
|
5.2--7.6
|
|
Florida
|
6.7
|
5.8--7.8
|
7.0
|
5.8--8.5
|
6.9
|
6.1--7.9
|
|
Georgia
|
6.6
|
4.5--9.7
|
7.1
|
4.7--10.7
|
6.9
|
5.1--9.2
|
|
Hawaii
|
9.1
|
6.9--11.8
|
6.7
|
4.7--9.3
|
7.9
|
6.4--9.9
|
|
Idaho
|
3.8
|
2.3--6.2
|
4.2
|
2.7--6.4
|
4.0
|
2.7--5.9
|
|
Illinois
|
7.5
|
5.7--9.8
|
7.1
|
5.4--9.3
|
7.4
|
5.9--9.1
|
|
Indiana
|
5.4
|
3.2--8.9
|
2.8
|
2.0--3.9
|
4.1
|
2.8--5.9
|
|
Kansas
|
3.5
|
2.4--5.1
|
3.6
|
2.2--5.7
|
3.5
|
2.5--5.0
|
|
Kentucky
|
4.3
|
2.9--6.4
|
6.4
|
4.4--9.2
|
5.4
|
4.1--7.0
|
|
Louisiana
|
7.0
|
4.8--10.0
|
11.0
|
7.5--15.9
|
9.1
|
6.5--12.5
|
|
Maine
|
4.7
|
4.1--5.4
|
6.1
|
5.4--7.0
|
5.5
|
5.0--6.1
|
|
Maryland
|
5.8
|
4.0--8.2
|
7.8
|
5.7--10.5
|
7.1
|
5.7--8.9
|
|
Massachusetts
|
3.6
|
2.6--4.9
|
4.3
|
3.0--6.1
|
4.0
|
3.0--5.3
|
|
Michigan
|
7.0
|
4.6--10.5
|
7.4
|
5.0--10.9
|
7.4
|
5.0--10.8
|
|
Mississippi
|
4.3
|
2.9--6.4
|
3.9
|
2.6--5.7
|
4.1
|
3.0--5.7
|
|
Missouri
|
5.7
|
3.4--9.4
|
5.7
|
3.7--8.7
|
5.7
|
3.8--8.5
|
|
Montana
|
6.9
|
3.4--13.4
|
3.6
|
1.8--7.2
|
5.2
|
2.7--9.6
|
|
Nevada
|
7.0
|
5.5--8.8
|
7.9
|
5.9--10.6
|
7.5
|
6.2--8.9
|
|
New Hampshire
|
4.8
|
2.8--8.2
|
4.2
|
2.8--6.4
|
4.5
|
3.2--6.3
|
|
New Jersey
|
5.4
|
3.5--8.3
|
4.9
|
3.3--7.4
|
5.2
|
3.6--7.6
|
|
New Mexico
|
7.6
|
5.9--9.7
|
6.8
|
5.0--9.0
|
7.2
|
5.6--9.1
|
|
New York
|
6.5
|
5.3--8.0
|
5.9
|
4.6--7.4
|
6.3
|
5.4--7.4
|
|
North Carolina
|
5.6
|
4.2--7.5
|
5.3
|
3.9--7.2
|
5.6
|
4.4--7.0
|
|
North Dakota
|
---§
|
---
|
---
|
---
|
---
|
---
|
|
Oklahoma
|
4.3
|
2.8--6.5
|
3.9
|
2.2--7.0
|
4.1
|
2.9--5.9
|
|
Pennsylvania
|
6.0
|
4.4--8.0
|
4.7
|
3.2--6.9
|
5.4
|
4.1--7.0
|
|
Rhode Island
|
7.8
|
5.7--10.7
|
6.9
|
5.2--9.1
|
7.4
|
5.7--9.7
|
|
South Carolina
|
7.4
|
4.8--11.4
|
5.3
|
3.3--8.6
|
6.5
|
4.5--9.4
|
|
South Dakota
|
2.6
|
1.6--4.3
|
3.1
|
2.0--4.8
|
2.9
|
2.1--3.9
|
|
Tennessee
|
5.5
|
3.9--7.6
|
5.8
|
4.1--8.2
|
5.6
|
4.4--7.2
|
|
Texas
|
5.2
|
3.7--7.3
|
4.9
|
4.1--6.0
|
5.1
|
4.2--6.2
|
|
Utah
|
5.5
|
3.9--7.7
|
7.1
|
5.5--9.1
|
6.5
|
5.3--7.8
|
|
Vermont
|
5.5
|
3.8--7.8
|
4.3
|
2.8--6.3
|
4.9
|
3.5--7.0
|
|
West Virginia
|
7.5
|
5.4--10.3
|
7.7
|
5.2--11.4
|
7.8
|
6.2--9.8
|
|
Wisconsin
|
3.5
|
2.6--4.7
|
3.7
|
2.8--5.0
|
3.7
|
2.9--4.6
|
|
Wyoming
|
6.6
|
5.4--8.0
|
5.7
|
4.6--7.1
|
6.1
|
5.2--7.1
|
|
Median
|
5.8
|
5.7
|
5.7
|
|
Range
|
2.6--9.1
|
2.8--12.4
|
2.9--10.4
|
|
Local surveys
|
|
|
|
|
|
|
|
Boston, MA
|
5.7
|
4.0--8.1
|
5.1
|
3.4--7.7
|
5.5
|
4.2--7.2
|
|
Broward County, FL
|
9.0
|
6.9--11.6
|
9.2
|
7.2--11.7
|
9.1
|
7.5--10.9
|
|
Charlotte-Mecklenburg, NC
|
4.6
|
3.3--6.5
|
5.3
|
3.7--7.5
|
5.0
|
3.9--6.4
|
|
Chicago, IL
|
15.9
|
11.8--21.1
|
13.8
|
9.9--18.8
|
15.1
|
11.7--19.2
|
|
Clark County, NV
|
7.6
|
6.0--9.8
|
9.0
|
6.3--12.7
|
8.3
|
6.8--10.2
|
|
Dallas, TX
|
7.4
|
5.1--10.5
|
7.0
|
4.7--10.3
|
7.4
|
5.5--9.8
|
|
Detroit, MI
|
17.0
|
14.2--20.3
|
20.8
|
15.7--26.9
|
19.1
|
15.5--23.4
|
|
Duval County, FL
|
14.7
|
12.4--17.3
|
13.7
|
11.6--16.1
|
14.4
|
12.8--16.1
|
|
Los Angeles, CA
|
7.1
|
4.4--11.3
|
9.0
|
6.4--12.5
|
8.1
|
5.8--11.2
|
|
Memphis, TN
|
8.0
|
5.8--10.8
|
9.3
|
7.2--12.0
|
8.6
|
6.9--10.7
|
|
Miami-Dade County, FL
|
8.2
|
6.4--10.4
|
8.3
|
6.4--10.8
|
8.3
|
6.7--10.1
|
|
Milwaukee, WI
|
9.3
|
7.7--11.3
|
9.8
|
7.4--12.7
|
9.7
|
8.1--11.6
|
|
New York City, NY
|
10.2
|
8.4--12.2
|
7.9
|
6.7--9.3
|
9.1
|
7.8--10.6
|
|
Orange County, FL
|
7.3
|
5.3--10.0
|
6.6
|
4.6--9.3
|
7.0
|
5.4--9.1
|
|
Palm Beach County, FL
|
6.9
|
5.1--9.2
|
10.0
|
7.7--12.8
|
8.5
|
7.0--10.3
|
|
Philadelphia, PA
|
9.9
|
7.3--13.2
|
6.6
|
4.0--10.6
|
8.5
|
6.4--11.1
|
|
San Bernardino, CA
|
12.8
|
10.1--16.1
|
10.7
|
8.3--13.7
|
11.8
|
9.8--14.1
|
|
San Diego, CA
|
5.0
|
3.7--6.6
|
4.5
|
3.2--6.3
|
4.8
|
3.7--6.0
|
|
San Francisco, CA
|
4.5
|
3.2--6.3
|
8.8
|
7.0--11.2
|
7.0
|
5.7--8.7
|
|
Seattle, WA
|
4.6
|
3.3--6.3
|
5.9
|
4.3--8.2
|
5.5
|
4.3--7.0
|
|
Median
|
7.8
|
8.9
|
8.4
|
|
Range
|
4.5--17.0
|
4.5--20.8
|
4.8--19.1
|
|
|
Female
|
Male
|
Total
|
|
Category
|
%
|
CI§
|
%
|
CI
|
%
|
CI
|
|
Race/Ethnicity
|
|
|
|
|
|
|
|
White¶
|
31.1
|
29.3--33.0
|
17.2
|
15.3--19.3
|
23.7
|
22.1--25.3
|
|
Black¶
|
37.5
|
33.6--41.6
|
17.9
|
14.8--21.6
|
27.7
|
25.1--30.4
|
|
Hispanic
|
39.7
|
37.4--41.9
|
23.6
|
20.9--26.6
|
31.6
|
29.8--33.4
|
|
Grade
|
|
|
|
|
|
|
|
9
|
35.8
|
33.3--38.4
|
18.6
|
16.4--21.0
|
26.6
|
24.7--28.5
|
|
10
|
34.7
|
31.7--37.8
|
18.2
|
15.9--20.8
|
26.1
|
24.0--28.2
|
|
11
|
35.5
|
32.3--38.8
|
19.6
|
17.5--21.8
|
27.3
|
25.3--29.4
|
|
12
|
28.9
|
26.2--31.9
|
19.8
|
17.7--22.1
|
24.3
|
22.4--26.2
|
|
Total
|
33.9
|
32.3--35.5
|
19.1
|
17.6--20.6
|
26.1
|
24.8--27.5
|
|
|
Female
|
Male
|
Total
|
|
Site
|
%
|
CI§
|
%
|
CI
|
%
|
CI
|
|
State surveys
|
|
|
|
|
|
|
|
Alabama
|
34.5
|
30.5--38.6
|
22.8
|
19.2--26.9
|
28.6
|
25.7--31.8
|
|
Alaska
|
33.5
|
29.6--37.8
|
17.2
|
14.0--21.0
|
25.2
|
22.4--28.3
|
|
Arizona
|
41.0
|
36.9--45.2
|
28.9
|
26.0--32.0
|
34.9
|
32.1--37.8
|
|
Arkansas
|
35.3
|
30.1--40.8
|
21.0
|
17.2--25.4
|
28.1
|
24.5--32.0
|
|
Colorado
|
31.7
|
27.7--36.0
|
19.3
|
15.4--23.9
|
25.4
|
22.8--28.2
|
|
Connecticut
|
32.9
|
29.5--36.4
|
17.2
|
14.4--20.4
|
25.0
|
22.3--28.0
|
|
Delaware
|
32.8
|
29.7--36.1
|
20.2
|
17.8--22.9
|
26.5
|
24.7--28.4
|
|
Florida
|
33.0
|
31.4--34.7
|
19.6
|
18.2--21.1
|
26.3
|
25.2--27.3
|
|
Georgia
|
35.9
|
33.0--39.0
|
21.6
|
18.6--24.9
|
28.8
|
27.0--30.7
|
|
Hawaii
|
39.0
|
33.2--45.2
|
22.9
|
18.8--27.5
|
30.6
|
25.9--35.7
|
|
Idaho
|
36.2
|
32.7--39.8
|
20.9
|
18.3--23.8
|
28.3
|
26.1--30.7
|
|
Illinois
|
32.9
|
27.7--38.6
|
22.9
|
20.2--25.9
|
27.8
|
24.5--31.3
|
|
Indiana
|
37.0
|
33.0--41.3
|
19.6
|
16.4--23.3
|
28.1
|
25.3--31.2
|
|
Kansas
|
28.0
|
24.8--31.4
|
15.4
|
13.7--17.2
|
21.5
|
19.9--23.2
|
|
Kentucky
|
32.1
|
28.1--36.4
|
21.7
|
18.6--25.2
|
26.7
|
23.8--29.9
|
|
Louisiana
|
35.5
|
32.9--38.2
|
26.1
|
22.6--29.8
|
31.2
|
28.7--33.9
|
|
Maine
|
26.9
|
25.4--28.3
|
18.5
|
17.4--19.8
|
22.7
|
21.7--23.6
|
|
Maryland
|
30.1
|
27.1--33.4
|
20.2
|
16.5--24.4
|
25.1
|
22.4--28.1
|
|
Massachusetts
|
29.1
|
25.6--32.8
|
19.2
|
17.5--21.0
|
24.0
|
21.9--26.3
|
|
Michigan
|
34.7
|
31.4--38.1
|
20.3
|
18.0--22.7
|
27.4
|
25.0--29.9
|
|
Mississippi
|
36.3
|
32.9--39.9
|
21.8
|
19.0--24.8
|
29.0
|
26.3--31.9
|
|
Missouri
|
33.2
|
27.9--39.0
|
21.3
|
18.2--24.7
|
27.1
|
23.9--30.5
|
|
Montana
|
33.2
|
29.2--37.3
|
21.7
|
18.8--24.9
|
27.3
|
24.4--30.4
|
|
Nevada
|
37.9
|
34.6--41.3
|
23.0
|
19.9--26.3
|
30.3
|
27.8--32.9
|
|
New Hampshire
|
32.1
|
28.3--36.2
|
18.4
|
15.4--21.9
|
25.1
|
22.8--27.6
|
|
New Jersey
|
---¶
|
---
|
---
|
---
|
---
|
---
|
|
New Mexico
|
37.3
|
35.1--39.5
|
22.3
|
19.9--25.0
|
29.7
|
28.0--31.5
|
|
New York
|
28.3
|
25.8--31.0
|
16.5
|
14.4--18.9
|
22.6
|
20.7--24.6
|
|
North Carolina
|
32.8
|
30.6--35.1
|
21.6
|
19.8--23.5
|
27.4
|
25.9--29.0
|
|
North Dakota
|
30.6
|
26.9--34.6
|
15.6
|
13.4--18.2
|
22.9
|
20.5--25.4
|
|
Oklahoma
|
36.8
|
31.2--42.8
|
20.1
|
16.3--24.4
|
28.2
|
24.7--32.0
|
|
Pennsylvania
|
31.5
|
28.2--35.1
|
15.8
|
12.9--19.2
|
23.5
|
20.8--26.5
|
|
Rhode Island
|
29.5
|
25.9--33.4
|
20.3
|
17.3--23.7
|
25.0
|
22.0--28.2
|
|
South Carolina
|
31.3
|
27.7--35.0
|
18.8
|
15.2--23.1
|
25.1
|
22.9--27.4
|
|
South Dakota
|
---
|
---
|
---
|
---
|
---
|
---
|
|
Tennessee
|
33.9
|
31.0--36.8
|
21.6
|
18.4--25.3
|
27.6
|
25.2--30.2
|
|
Texas
|
34.9
|
32.2--37.8
|
20.8
|
18.5--23.3
|
27.7
|
26.0--29.4
|
|
Utah
|
32.8
|
28.6--37.4
|
19.4
|
15.6--23.7
|
26.0
|
23.1--29.1
|
|
Vermont
|
27.3
|
24.7--30.1
|
15.0
|
14.2--15.7
|
21.1
|
19.8--22.4
|
|
West Virginia
|
36.7
|
32.9--40.8
|
22.9
|
19.8--26.2
|
29.7
|
27.1--32.5
|
|
Wisconsin
|
25.9
|
22.9--29.1
|
16.1
|
13.7--18.8
|
20.8
|
18.8--23.1
|
|
Wyoming
|
35.3
|
32.6--38.1
|
19.2
|
17.0--21.5
|
26.9
|
25.0--29.0
|
|
Median
|
33.1
|
20.2
|
27.0
|
|
Range
|
25.9--41.0
|
15.0--28.9
|
20.8--34.9
|
|
Local surveys
|
|
|
|
|
|
|
|
Boston, MA
|
36.0
|
32.1--40.1
|
21.1
|
17.8--24.9
|
28.8
|
26.1--31.7
|
|
Broward County, FL
|
33.0
|
28.8--37.4
|
19.9
|
16.9--23.1
|
26.6
|
24.0--29.4
|
|
Charlotte-Mecklenburg, NC
|
34.3
|
30.8--38.0
|
21.5
|
18.2--25.3
|
28.2
|
25.7--30.8
|
|
Chicago, IL
|
36.7
|
31.1--42.8
|
24.9
|
20.2--30.4
|
30.5
|
26.3--35.0
|
|
Clark County, NV
|
39.0
|
34.9--43.3
|
24.3
|
20.5--28.7
|
31.5
|
28.2--34.9
|
|
Dallas, TX
|
35.5
|
31.8--39.3
|
30.6
|
23.2--39.3
|
33.0
|
28.7--37.6
|
|
Detroit, MI
|
37.5
|
32.3--43.0
|
20.4
|
17.1--24.2
|
28.8
|
25.4--32.5
|
|
Duval County, FL
|
31.5
|
28.9--34.2
|
22.7
|
20.2--25.3
|
27.3
|
25.6--29.0
|
|
Los Angeles, CA
|
35.9
|
30.3--41.9
|
24.6
|
20.9--28.7
|
30.1
|
26.6--33.8
|
|
Memphis, TN
|
29.0
|
24.9--33.4
|
16.7
|
13.6--20.4
|
23.0
|
20.4--25.8
|
|
Miami-Dade County, FL
|
35.7
|
32.5--39.1
|
21.8
|
18.8--25.0
|
28.7
|
26.6--31.0
|
|
Milwaukee, WI
|
37.1
|
34.0--40.3
|
23.5
|
20.5--26.8
|
30.3
|
28.1--32.6
|
|
New York City, NY
|
34.4
|
32.9--36.0
|
21.5
|
20.0--23.1
|
28.3
|
27.2--29.3
|
|
Orange County, FL
|
32.3
|
26.9--38.2
|
20.2
|
16.7--24.3
|
26.2
|
22.8--30.0
|
|
Palm Beach County, FL
|
32.3
|
29.4--35.4
|
21.0
|
18.3--23.9
|
26.5
|
24.4--28.8
|
|
Philadelphia, PA
|
40.8
|
36.6--45.2
|
26.1
|
21.4--31.4
|
33.8
|
30.3--37.5
|
|
San Bernardino, CA
|
38.2
|
34.7--41.9
|
25.7
|
21.7--30.1
|
31.9
|
29.2--34.7
|
|
San Diego, CA
|
33.8
|
30.3--37.4
|
18.3
|
15.9--21.0
|
25.9
|
23.7--28.3
|
|
San Francisco, CA
|
26.8
|
23.9--30.0
|
21.0
|
18.7--23.5
|
23.9
|
21.9--25.9
|
|
Seattle, WA
|
24.3
|
21.1--27.9
|
17.0
|
14.1--20.3
|
20.6
|
18.3--23.0
|
|
Median
|
34.9
|
21.5
|
28.5
|
|
Range
|
24.3--40.8
|
16.7--30.6
|
20.6--33.8
|
|
|
Seriously considered attempting suicide
|
|
Made a suicide plan
|
|
|
Female
|
Male
|
Total
|
|
Female
|
Male
|
Total
|
|
Category
|
%
|
CI†
|
%
|
CI
|
%
|
CI
|
|
%
|
CI
|
%
|
CI
|
%
|
CI
|
|
Race/Ethnicity
|
|
|
|
|
|
|
|
|
|
|
|
|
|
|
White§
|
16.1
|
14.8--17.5
|
10.5
|
9.1--12.1
|
13.1
|
12.1--14.1
|
|
12.3
|
11.2--13.5
|
8.5
|
7.1--10.3
|
10.3
|
9.3--11.4
|
|
Black§
|
18.1
|
15.8--20.5
|
7.8
|
6.1--9.8
|
13.0
|
11.5--14.6
|
|
13.3
|
11.2--15.7
|
6.2
|
4.9--7.8
|
9.8
|
8.3--11.5
|
|
Hispanic
|
20.2
|
18.3--22.3
|
10.7
|
8.6--13.3
|
15.4
|
13.9--17.0
|
|
15.4
|
13.7--17.2
|
9.0
|
7.3--10.9
|
12.2
|
11.2--13.2
|
|
Grade
|
|
|
|
|
|
|
|
|
|
|
|
|
|
|
9
|
20.3
|
18.4--22.3
|
10.0
|
8.3--12.2
|
14.8
|
13.3--16.4
|
|
14.9
|
13.4--16.5
|
7.3
|
5.8--9.1
|
10.8
|
9.5--12.3
|
|
10
|
17.2
|
15.2--19.5
|
10.0
|
8.4--11.8
|
13.4
|
12.3--14.7
|
|
14.3
|
12.8--16.1
|
9.3
|
7.7--11.2
|
11.7
|
10.6--12.9
|
|
11
|
17.8
|
15.6--20.2
|
11.4
|
9.4--13.8
|
14.5
|
12.9--16.3
|
|
13.4
|
11.5--15.6
|
9.4
|
7.2--12.1
|
11.3
|
9.8--13.1
|
|
12
|
13.6
|
12.0--15.5
|
10.5
|
8.6--12.7
|
12.1
|
10.7--13.5
|
|
9.6
|
8.1--11.3
|
8.8
|
7.1--10.8
|
9.2
|
7.9--10.7
|
|
Total
|
17.4
|
16.5--18.4
|
10.5
|
9.4--11.6
|
13.8
|
13.1--14.6
|
|
13.2
|
12.4--14.1
|
8.6
|
7.4--10.0
|
10.9
|
10.0--11.8
|
|
|
Seriously considered attempting suicide
|
|
Made a suicide plan
|
|
|
Female
|
Male
|
Total
|
|
Female
|
Male
|
Total
|
|
Site
|
%
|
CI†
|
%
|
CI
|
%
|
CI
|
|
%
|
CI
|
%
|
CI
|
%
|
CI
|
|
State surveys
|
|
|
|
|
|
|
|
|
|
|
|
|
|
|
Alabama
|
18.5
|
14.4--23.4
|
16.1
|
13.5--19.0
|
17.4
|
14.8--20.2
|
|
18.7
|
14.8--23.4
|
11.8
|
9.8--14.1
|
15.2
|
13.2--17.5
|
|
Alaska
|
19.5
|
16.0--23.5
|
8.3
|
6.1--11.2
|
13.9
|
11.4--16.8
|
|
15.3
|
12.2--18.9
|
8.2
|
6.1--10.8
|
11.7
|
9.5--14.2
|
|
Arizona
|
21.1
|
18.2--24.4
|
13.3
|
11.3--15.5
|
17.3
|
15.3--19.4
|
|
14.4
|
12.1--16.9
|
9.3
|
7.1--12.1
|
12.1
|
10.3--14.2
|
|
Arkansas
|
21.1
|
16.2--27.1
|
14.8
|
11.9--18.3
|
18.0
|
14.7--21.8
|
|
16.4
|
12.6--21.2
|
11.8
|
9.1--15.1
|
14.1
|
11.5--17.2
|
|
Colorado
|
17.9
|
15.4--20.8
|
9.7
|
7.7--12.1
|
13.7
|
12.3--15.3
|
|
12.8
|
10.0--16.3
|
9.3
|
7.0--12.3
|
11.0
|
9.2--13.1
|
|
Connecticut
|
16.6
|
13.4--20.2
|
11.7
|
9.4--14.5
|
14.1
|
12.3--16.1
|
|
12.2
|
10.1--14.7
|
9.8
|
7.9--12.2
|
11.0
|
9.5--12.7
|
|
Delaware
|
17.2
|
14.5--20.2
|
9.8
|
7.9--12.2
|
13.5
|
12.0--15.3
|
|
12.2
|
10.0--14.7
|
7.4
|
5.9--9.4
|
9.9
|
8.6--11.3
|
|
Florida
|
13.8
|
12.6--15.2
|
9.2
|
8.1--10.5
|
11.6
|
10.7--12.7
|
|
10.7
|
9.8--11.8
|
8.0
|
7.0--9.1
|
9.4
|
8.6--10.2
|
|
Georgia
|
17.5
|
14.9--20.4
|
9.9
|
7.9--12.3
|
13.7
|
12.2--15.4
|
|
14.4
|
11.8--17.5
|
11.5
|
8.7--15.1
|
13.0
|
11.1--15.1
|
|
Hawaii
|
25.2
|
20.2--31.1
|
12.9
|
10.4--16.0
|
18.9
|
15.9--22.2
|
|
19.9
|
15.8--24.7
|
12.4
|
9.6--15.9
|
16.0
|
13.2--19.3
|
|
Idaho
|
17.4
|
14.7--20.6
|
10.9
|
9.0--13.2
|
14.2
|
12.3--16.2
|
|
15.6
|
13.1--18.5
|
11.0
|
8.8--13.8
|
13.3
|
11.3--15.7
|
|
Illinois
|
17.6
|
14.5--21.2
|
11.5
|
10.0--13.2
|
14.5
|
12.9--16.3
|
|
13.0
|
11.3--14.9
|
9.7
|
8.2--11.4
|
11.3
|
10.1--12.7
|
|
Indiana
|
22.4
|
19.9--25.2
|
12.2
|
10.3--14.4
|
17.2
|
16.0--18.5
|
|
18.0
|
15.6--20.6
|
9.3
|
7.5--11.6
|
13.5
|
12.0--15.2
|
|
Kansas
|
16.5
|
13.9--19.4
|
9.0
|
7.0--11.5
|
12.6
|
10.8--14.6
|
|
12.3
|
10.1--14.8
|
7.0
|
5.2--9.3
|
9.5
|
8.0--11.3
|
|
Kentucky
|
16.9
|
13.6--20.8
|
12.4
|
10.2--15.0
|
14.6
|
12.3--17.2
|
|
14.2
|
11.1--18.1
|
10.9
|
8.4--14.0
|
12.5
|
10.2--15.3
|
|
Louisiana
|
15.1
|
12.3--18.4
|
13.1
|
8.5--19.7
|
14.4
|
11.1--18.5
|
|
14.3
|
13.4--15.3
|
8.8
|
6.3--12.1
|
11.6
|
10.2--13.3
|
|
Maine
|
13.9
|
12.8--15.1
|
10.5
|
9.5--11.5
|
12.2
|
11.5--13.0
|
|
11.3
|
10.3--12.3
|
10.6
|
9.6--11.6
|
10.9
|
10.2--11.7
|
|
Maryland
|
17.4
|
13.7--21.9
|
11.3
|
9.2--13.8
|
14.5
|
12.1--17.3
|
|
13.0
|
10.7--15.8
|
10.0
|
8.1--12.3
|
11.6
|
10.3--13.1
|
|
Massachusetts
|
15.7
|
13.3--18.5
|
11.1
|
9.5--13.0
|
13.5
|
11.9--15.2
|
|
12.4
|
10.2--14.9
|
9.5
|
7.9--11.5
|
11.1
|
9.5--12.8
|
|
Michigan
|
19.2
|
17.1--21.6
|
12.8
|
11.2--14.5
|
16.0
|
14.3--17.8
|
|
16.4
|
14.6--18.3
|
12.7
|
11.3--14.3
|
14.6
|
13.3--16.1
|
|
Mississippi
|
19.0
|
16.7--21.4
|
11.9
|
9.9--14.1
|
15.4
|
14.1--16.8
|
|
13.7
|
11.9--15.8
|
9.0
|
7.4--10.7
|
11.4
|
10.3--12.6
|
|
Missouri
|
20.6
|
17.1--24.5
|
10.6
|
8.3--13.3
|
15.4
|
13.4--17.6
|
|
14.2
|
11.9--17.0
|
8.6
|
7.2--10.3
|
11.3
|
10.0--12.8
|
|
Montana
|
20.3
|
17.5--23.4
|
14.6
|
11.6--18.3
|
17.4
|
14.9--20.3
|
|
15.5
|
12.8--18.6
|
11.3
|
8.9--14.1
|
13.4
|
11.3--15.8
|
|
Nevada
|
23.4
|
20.5--26.5
|
12.8
|
10.7--15.3
|
18.0
|
16.0--20.2
|
|
17.2
|
14.6--20.2
|
11.5
|
9.5--13.8
|
14.3
|
12.7--16.1
|
|
New Hampshire
|
13.8
|
10.7--17.7
|
10.2
|
7.8--13.3
|
12.1
|
10.0--14.4
|
|
11.9
|
8.8--15.9
|
7.7
|
5.8--10.2
|
9.8
|
7.8--12.2
|
|
New Jersey
|
---§
|
---
|
---
|
---
|
---
|
---
|
|
---
|
---
|
---
|
---
|
---
|
---
|
|
New Mexico
|
20.0
|
17.7--22.6
|
11.9
|
9.7--14.4
|
15.9
|
14.0--18.0
|
|
15.5
|
13.5--17.7
|
10.8
|
8.5--13.5
|
13.1
|
11.2--15.4
|
|
New York
|
15.1
|
13.4--16.9
|
11.0
|
9.4--12.9
|
13.3
|
11.8--14.9
|
|
---
|
---
|
---
|
---
|
---
|
---
|
|
North Carolina
|
16.1
|
14.2--18.2
|
10.3
|
8.7--12.1
|
13.2
|
12.0--14.6
|
|
11.3
|
9.8--13.0
|
8.6
|
7.0--10.7
|
10.1
|
9.3--10.9
|
|
North Dakota
|
16.0
|
13.5--18.8
|
8.8
|
7.0--11.0
|
12.4
|
10.8--14.1
|
|
13.8
|
11.4--16.6
|
7.4
|
5.7--9.5
|
10.5
|
9.0--12.3
|
|
Oklahoma
|
20.8
|
16.3--26.1
|
9.3
|
6.7--12.8
|
14.9
|
12.2--18.0
|
|
14.0
|
10.6--18.3
|
8.1
|
6.3--10.3
|
10.9
|
9.3--12.8
|
|
Pennsylvania
|
18.9
|
16.2--21.9
|
8.3
|
6.5--10.5
|
13.5
|
12.0--15.1
|
|
13.0
|
11.0--15.1
|
6.4
|
5.4--7.6
|
9.6
|
8.5--10.9
|
|
Rhode Island
|
14.6
|
12.5--17.0
|
9.0
|
7.6--10.6
|
11.8
|
10.3--13.6
|
|
12.7
|
11.1--14.4
|
9.8
|
8.8--11.0
|
11.3
|
10.2--12.4
|
|
South Carolina
|
15.1
|
11.9--18.9
|
10.3
|
7.7--13.6
|
12.7
|
10.3--15.6
|
|
11.5
|
9.1--14.4
|
9.3
|
6.3--13.6
|
10.5
|
8.0--13.6
|
|
South Dakota
|
19.1
|
17.2--21.3
|
15.0
|
12.4--18.0
|
17.0
|
15.1--19.0
|
|
12.2
|
10.6--14.0
|
12.8
|
9.6--16.9
|
12.5
|
10.4--14.9
|
|
Tennessee
|
17.5
|
14.6--20.8
|
9.9
|
7.8--12.4
|
13.6
|
11.5--16.0
|
|
14.0
|
12.2--16.1
|
9.4
|
7.7--11.4
|
11.7
|
10.3--13.2
|
|
Texas
|
17.8
|
14.8--21.2
|
9.8
|
8.3--11.7
|
13.7
|
12.2--15.4
|
|
13.2
|
11.1--15.6
|
7.5
|
5.8--9.5
|
10.3
|
9.1--11.7
|
|
Utah
|
16.3
|
12.8--20.5
|
14.2
|
11.2--17.8
|
15.3
|
12.9--18.2
|
|
11.9
|
9.4--14.9
|
11.3
|
8.7--14.4
|
11.5
|
9.7--13.7
|
|
Vermont
|
---
|
---
|
---
|
---
|
---
|
---
|
|
10.4
|
9.1--12.0
|
7.0
|
6.2--7.9
|
8.7
|
7.9--9.6
|
|
West Virginia
|
21.0
|
17.9--24.4
|
15.0
|
11.8--18.9
|
18.0
|
15.4--20.8
|
|
15.9
|
14.1--17.8
|
12.1
|
9.7--15.0
|
13.9
|
12.4--15.7
|
|
Wisconsin
|
16.4
|
14.2--18.9
|
10.0
|
8.1--12.2
|
13.2
|
11.6--14.9
|
|
13.1
|
11.1--15.5
|
8.7
|
7.2--10.5
|
11.0
|
9.6--12.5
|
|
Wyoming
|
21.2
|
18.9--23.8
|
13.6
|
11.7--15.8
|
17.3
|
15.7--19.1
|
|
18.7
|
16.4--21.1
|
12.1
|
10.0--14.6
|
15.3
|
13.6--17.2
|
|
Median
|
17.5
|
11.0
|
14.3
|
|
13.7
|
9.4
|
11.4
|
|
Range
|
13.8--25.2
|
8.3--16.1
|
11.6--18.9
|
|
10.4--19.9
|
6.4--12.8
|
8.7--16.0
|
|
Local surveys
|
|
|
|
|
|
|
|
|
|
|
|
|
|
|
Boston, MA
|
15.9
|
13.1--19.1
|
8.8
|
6.4--11.9
|
12.3
|
10.3--14.5
|
|
14.6
|
12.0--17.6
|
8.4
|
5.8--12.0
|
11.5
|
9.6--13.5
|
|
Broward County, FL
|
13.8
|
10.8--17.4
|
8.1
|
6.3--10.3
|
11.0
|
9.2--13.1
|
|
10.7
|
8.4--13.6
|
7.7
|
5.9--9.9
|
9.2
|
7.7--10.9
|
|
Charlotte-Mecklenburg, NC
|
17.8
|
15.1--20.9
|
9.6
|
7.2--12.7
|
13.9
|
12.0--16.0
|
|
10.0
|
8.1--12.4
|
10.4
|
7.9--13.4
|
10.3
|
8.7--12.2
|
|
Chicago, IL
|
15.2
|
12.1--19.0
|
10.9
|
8.6--13.8
|
13.3
|
11.0--16.0
|
|
10.8
|
8.2--14.1
|
9.4
|
7.2--12.2
|
10.4
|
8.5--12.8
|
|
Clark County, NV
|
23.5
|
20.1--27.2
|
13.3
|
11.0--16.1
|
18.2
|
16.0--20.7
|
|
16.6
|
13.2--20.7
|
11.8
|
9.8--14.2
|
14.2
|
12.3--16.3
|
|
Dallas, TX
|
17.4
|
14.1--21.3
|
13.5
|
10.5--17.2
|
15.6
|
13.5--18.1
|
|
16.3
|
13.2--20.0
|
12.1
|
9.4--15.6
|
14.4
|
12.3--16.8
|
|
Detroit, MI
|
18.9
|
16.4--21.7
|
10.3
|
7.2--14.6
|
14.5
|
12.3--17.1
|
|
15.8
|
13.9--17.9
|
9.2
|
6.8--12.4
|
12.5
|
10.7--14.5
|
|
Duval County, FL
|
15.3
|
13.2--17.7
|
12.5
|
10.6--14.7
|
14.2
|
12.8--15.8
|
|
12.6
|
10.8--14.6
|
10.2
|
8.5--12.2
|
11.5
|
10.3--12.9
|
|
Los Angeles, CA
|
13.7
|
11.6--16.2
|
11.4
|
9.6--13.5
|
12.6
|
11.3--13.9
|
|
9.6
|
7.6--12.1
|
11.8
|
10.3--13.5
|
10.7
|
9.0--12.7
|
|
Memphis, TN
|
14.9
|
11.6--18.9
|
6.3
|
4.6--8.5
|
10.7
|
8.8--12.9
|
|
11.7
|
9.3--14.7
|
6.2
|
4.4--8.7
|
9.1
|
7.6--10.9
|
|
Miami-Dade County, FL
|
13.8
|
11.5--16.4
|
9.6
|
7.9--11.6
|
11.6
|
10.2--13.2
|
|
8.9
|
7.1--11.1
|
7.9
|
6.3--9.9
|
8.4
|
7.0--10.0
|
|
Milwaukee, WI
|
14.7
|
12.6--17.2
|
9.4
|
6.9--12.6
|
12.1
|
10.5--13.8
|
|
13.1
|
10.9--15.7
|
10.7
|
8.6--13.2
|
11.9
|
10.1--13.8
|
|
New York City, NY
|
16.6
|
15.2--18.1
|
10.2
|
9.4--11.2
|
13.6
|
12.8--14.4
|
|
---
|
---
|
---
|
---
|
---
|
---
|
|
Orange County, FL
|
16.3
|
12.6--20.7
|
7.7
|
5.4--10.8
|
12.0
|
9.9--14.6
|
|
11.6
|
8.8--15.2
|
7.8
|
5.5--11.0
|
9.7
|
8.0--11.9
|
|
Palm Beach County, FL
|
15.6
|
13.4--17.9
|
10.1
|
8.1--12.5
|
12.9
|
11.3--14.6
|
|
11.3
|
9.5--13.5
|
8.7
|
6.9--10.9
|
10.0
|
8.7--11.5
|
|
Philadelphia, PA
|
17.9
|
14.8--21.5
|
9.9
|
6.8--14.2
|
14.2
|
11.6--17.2
|
|
15.8
|
13.2--18.6
|
7.5
|
5.0--11.1
|
11.8
|
10.0--13.8
|
|
San Bernardino, CA
|
17.1
|
13.8--20.9
|
10.9
|
8.4--14.1
|
14.0
|
11.7--16.8
|
|
12.3
|
9.6--15.6
|
9.2
|
6.9--12.3
|
10.8
|
8.8--13.3
|
|
San Diego, CA
|
18.1
|
15.2--21.3
|
9.9
|
7.9--12.5
|
13.9
|
12.1--15.8
|
|
13.3
|
11.1--15.9
|
8.0
|
6.2--10.3
|
10.6
|
9.0--12.4
|
|
San Francisco, CA
|
13.8
|
11.6--16.5
|
10.8
|
9.1--12.7
|
12.4
|
10.9--14.1
|
|
12.9
|
10.8--15.4
|
10.6
|
9.1--12.3
|
11.9
|
10.5--13.5
|
|
Seattle, WA
|
13.0
|
10.6--15.7
|
8.4
|
6.5--10.7
|
10.5
|
9.0--12.3
|
|
10.0
|
8.1--12.2
|
6.6
|
5.0--8.7
|
8.3
|
7.1--9.6
|
|
Median
|
15.7
|
10.0
|
13.1
|
|
12.3
|
9.2
|
10.7
|
|
Range
|
13.0--23.5
|
6.3--13.5
|
10.5--18.2
|
|
8.9--16.6
|
6.2--12.1
|
8.3--14.4
|
|
|
Attempted suicide
|
|
Suicide attempt treated by a doctor or nurse
|
|
|
Female
|
Male
|
Total
|
|
Female
|
Male
|
Total
|
|
Category
|
%
|
CI§
|
%
|
CI
|
%
|
CI
|
|
%
|
CI
|
%
|
CI
|
%
|
CI
|
|
Race/Ethnicity
|
|
|
|
|
|
|
|
|
|
|
|
|
|
|
White¶
|
6.5
|
5.5--7.5
|
3.8
|
3.1--4.7
|
5.0
|
4.4--5.7
|
|
2.0
|
1.5--2.7
|
1.2
|
0.9--1.7
|
1.6
|
1.2--2.1
|
|
Black¶
|
10.4
|
8.5--12.7
|
5.4
|
3.8--7.6
|
7.9
|
6.5--9.7
|
|
2.5
|
1.8--3.4
|
2.5
|
1.4--4.4
|
2.5
|
1.8--3.5
|
|
Hispanic
|
11.1
|
9.4--13.0
|
5.1
|
3.8--7.0
|
8.1
|
7.1--9.3
|
|
2.7
|
1.8--3.9
|
1.8
|
0.9--3.4
|
2.2
|
1.6--3.2
|
|
Grade
|
|
|
|
|
|
|
|
|
|
|
|
|
|
|
9
|
10.3
|
8.7--12.2
|
4.5
|
3.4--6.0
|
7.3
|
6.2--8.5
|
|
2.8
|
2.1--3.7
|
1.4
|
0.9--2.2
|
2.1
|
1.6--2.7
|
|
10
|
8.8
|
7.2--10.7
|
5.2
|
3.7--7.2
|
6.9
|
5.8--8.2
|
|
2.3
|
1.6--3.4
|
2.0
|
1.2--3.2
|
2.2
|
1.6--2.9
|
|
11
|
7.8
|
6.5--9.3
|
4.7
|
3.4--6.6
|
6.3
|
5.3--7.3
|
|
2.6
|
1.7--4.0
|
1.7
|
1.0--2.9
|
2.1
|
1.5--3.0
|
|
12
|
4.6
|
3.6--6.0
|
3.8
|
2.8--5.2
|
4.2
|
3.4--5.2
|
|
1.0
|
0.7--1.6
|
1.4
|
0.8--2.3
|
1.2
|
0.8--1.7
|
|
Total
|
8.1
|
7.2--9.0
|
4.6
|
3.9--5.5
|
6.3
|
5.7--7.0
|
|
2.3
|
1.8--2.8
|
1.6
|
1.2--2.1
|
1.9
|
1.6--2.3
|
|
|
Attempted suicide
|
|
Suicide attempt treated by a doctor or nurse
|
|
|
Female
|
Male
|
Total
|
|
Female
|
Male
|
Total
|
|
Site
|
%
|
CI§
|
%
|
CI
|
%
|
CI
|
|
%
|
CI
|
%
|
CI
|
%
|
CI
|
|
State surveys
|
|
|
|
|
|
|
|
|
|
|
|
|
|
|
Alabama
|
12.2
|
8.0--18.2
|
9.0
|
6.2--12.9
|
10.7
|
8.1--14.0
|
|
2.9
|
1.6--5.2
|
3.9
|
2.3--6.6
|
3.4
|
2.4--4.9
|
|
Alaska
|
11.5
|
7.7--16.7
|
5.1
|
3.4--7.5
|
8.5
|
6.3--11.4
|
|
3.0
|
1.5--5.8
|
2.3
|
1.2--4.4
|
2.6
|
1.7--4.2
|
|
Arizona
|
11.1
|
8.7--13.9
|
7.6
|
5.7--10.1
|
9.5
|
7.7--11.6
|
|
3.4
|
2.0--5.7
|
3.7
|
2.5--5.4
|
3.6
|
2.6--4.9
|
|
Arkansas
|
11.3
|
8.6--14.9
|
12.7
|
9.2--17.2
|
12.0
|
9.5--15.0
|
|
4.3
|
2.8--6.4
|
5.4
|
3.1--9.3
|
4.8
|
3.4--6.8
|
|
Colorado
|
9.3
|
7.1--12.1
|
5.6
|
3.5--8.8
|
7.6
|
6.0--9.6
|
|
3.5
|
2.2--5.7
|
2.4
|
1.3--4.6
|
3.1
|
2.2--4.4
|
|
Connecticut
|
7.3
|
5.2--10.1
|
7.5
|
5.4--10.2
|
7.4
|
5.8--9.5
|
|
2.5
|
1.5--3.9
|
3.0
|
2.0--4.4
|
2.7
|
2.0--3.8
|
|
Delaware
|
10.8
|
8.6--13.4
|
5.0
|
3.7--6.8
|
8.2
|
6.8--9.7
|
|
3.0
|
1.9--4.7
|
1.4
|
0.8--2.5
|
2.4
|
1.7--3.4
|
|
Florida
|
7.5
|
6.6--8.5
|
5.5
|
4.5--6.7
|
6.5
|
5.8--7.4
|
|
2.2
|
1.7--3.0
|
2.3
|
1.6--3.1
|
2.3
|
1.8--2.9
|
|
Georgia
|
10.1
|
7.7--13.2
|
6.4
|
4.0--10.0
|
8.3
|
6.4--10.8
|
|
3.6
|
2.4--5.3
|
2.7
|
1.7--4.3
|
3.2
|
2.4--4.1
|
|
Hawaii
|
13.9
|
10.8--17.7
|
11.5
|
8.4--15.5
|
12.8
|
10.1--16.1
|
|
4.7
|
3.2--6.9
|
4.3
|
2.5--7.2
|
4.5
|
3.3--6.1
|
|
Idaho
|
8.2
|
6.4--10.5
|
5.4
|
3.9--7.3
|
6.9
|
5.6--8.4
|
|
2.4
|
1.6--3.7
|
1.7
|
0.9--3.3
|
2.0
|
1.4--3.0
|
|
Illinois
|
9.1
|
6.6--12.4
|
8.6
|
6.9--10.7
|
8.9
|
7.2--10.9
|
|
2.9
|
2.0--4.3
|
2.8
|
2.0--4.0
|
2.9
|
2.4--3.7
|
|
Indiana
|
11.7
|
9.3--14.7
|
6.8
|
4.3--10.7
|
9.3
|
7.2--11.9
|
|
4.3
|
2.9--6.4
|
2.9
|
1.6--5.0
|
3.6
|
2.7--4.8
|
|
Kansas
|
7.9
|
5.7--10.8
|
4.5
|
2.8--7.0
|
6.1
|
4.5--8.3
|
|
2.5
|
1.4--4.3
|
1.2
|
0.6--2.6
|
1.8
|
1.1--3.0
|
|
Kentucky
|
9.1
|
6.5--12.7
|
8.4
|
6.3--11.2
|
8.8
|
7.0--10.9
|
|
3.2
|
2.1--4.8
|
3.8
|
2.2--6.2
|
3.5
|
2.5--4.8
|
|
Louisiana
|
11.1
|
7.5--16.2
|
10.3
|
7.4--14.3
|
10.9
|
8.6--13.6
|
|
4.9
|
3.0--8.0
|
5.0
|
2.8--8.7
|
4.9
|
3.6--6.7
|
|
Maine
|
7.7
|
6.9--8.6
|
8.1
|
7.3--9.0
|
7.9
|
7.4--8.5
|
|
---¶
|
---
|
---
|
---
|
---
|
---
|
|
Maryland
|
9.4
|
7.0--12.6
|
11.2
|
8.2--15.1
|
10.4
|
8.0--13.4
|
|
2.7
|
1.6--4.3
|
4.4
|
2.9--6.5
|
3.5
|
2.5--4.7
|
|
Massachusetts
|
7.0
|
5.5--8.7
|
6.6
|
4.8--8.8
|
6.8
|
5.5--8.4
|
|
2.2
|
1.4--3.4
|
2.9
|
1.8--4.5
|
2.6
|
1.8--3.8
|
|
Michigan
|
11.1
|
8.8--14.0
|
7.2
|
5.5--9.4
|
9.3
|
7.4--11.6
|
|
3.3
|
2.5--4.4
|
2.6
|
1.7--4.0
|
3.0
|
2.4--3.9
|
|
Mississippi
|
11.9
|
9.7--14.4
|
6.4
|
4.4--9.1
|
9.3
|
7.5--11.4
|
|
3.5
|
2.2--5.5
|
1.8
|
0.9--3.4
|
2.7
|
1.9--4.0
|
|
Missouri
|
7.9
|
5.5--11.2
|
5.0
|
3.5--7.1
|
6.4
|
4.7--8.7
|
|
3.3
|
2.3--4.9
|
1.6
|
0.8--3.4
|
2.5
|
1.8--3.4
|
|
Montana
|
7.9
|
6.1--10.1
|
7.4
|
5.2--10.5
|
7.7
|
6.1--9.6
|
|
3.0
|
1.9--4.6
|
2.6
|
1.7--3.9
|
2.8
|
2.0--3.9
|
|
Nevada
|
11.6
|
9.4--14.2
|
8.7
|
6.7--11.2
|
10.2
|
8.6--12.1
|
|
4.3
|
3.0--6.1
|
2.9
|
2.0--4.2
|
3.6
|
2.8--4.6
|
|
New Hampshire
|
5.1
|
3.1--8.3
|
4.2
|
2.7--6.6
|
4.7
|
3.3--6.6
|
|
1.6
|
0.7--3.6
|
1.6
|
0.9--2.8
|
1.6
|
1.0--2.8
|
|
New Jersey
|
---
|
---
|
---
|
---
|
---
|
---
|
|
---
|
---
|
---
|
---
|
---
|
---
|
|
New Mexico
|
11.7
|
9.7--13.9
|
7.6
|
5.2--10.9
|
9.7
|
7.7--12.0
|
|
3.7
|
2.7--5.0
|
2.6
|
1.6--4.2
|
3.2
|
2.4--4.3
|
|
New York
|
7.3
|
6.3--8.5
|
7.1
|
5.7--8.9
|
7.4
|
6.3--8.6
|
|
2.6
|
2.0--3.2
|
2.9
|
1.9--4.4
|
2.8
|
2.0--3.8
|
|
North Carolina
|
9.7
|
7.7--12.2
|
9.9
|
8.6--11.3
|
9.9
|
8.6--11.3
|
|
---
|
---
|
---
|
---
|
---
|
---
|
|
North Dakota
|
5.9
|
4.4--7.8
|
5.4
|
3.9--7.3
|
5.7
|
4.6--7.1
|
|
1.8
|
1.0--3.1
|
2.8
|
1.8--4.4
|
2.3
|
1.6--3.4
|
|
Oklahoma
|
8.9
|
6.5--12.1
|
5.2
|
3.5--7.7
|
7.0
|
5.5--8.9
|
|
3.4
|
1.9--5.7
|
1.9
|
0.8--4.1
|
2.6
|
1.6--4.3
|
|
Pennsylvania
|
8.4
|
6.5--10.8
|
3.1
|
1.9--5.1
|
5.7
|
4.4--7.4
|
|
1.8
|
1.1--2.9
|
1.6
|
0.7--3.8
|
1.7
|
1.0--2.8
|
|
Rhode Island
|
8.3
|
6.6--10.3
|
7.1
|
5.4--9.2
|
7.7
|
6.6--9.0
|
|
3.1
|
1.8--5.3
|
3.5
|
2.1--5.7
|
3.3
|
2.5--4.5
|
|
South Carolina
|
9.7
|
6.8--13.7
|
11.7
|
8.0--16.8
|
10.8
|
8.7--13.3
|
|
3.0
|
1.4--6.0
|
4.6
|
3.3--6.5
|
3.9
|
2.8--5.5
|
|
South Dakota
|
7.0
|
5.7--8.7
|
6.3
|
4.2--9.3
|
6.7
|
5.6--8.0
|
|
1.1
|
0.7--1.9
|
2.5
|
1.3--4.8
|
1.9
|
1.3--2.7
|
|
Tennessee
|
9.3
|
7.7--11.2
|
4.8
|
3.4--6.7
|
7.1
|
6.1--8.3
|
|
2.4
|
1.6--3.7
|
2.0
|
1.1--3.5
|
2.2
|
1.5--3.2
|
|
Texas
|
10.4
|
8.3--13.1
|
4.3
|
3.3--5.7
|
7.4
|
6.3--8.7
|
|
2.7
|
1.8--4.0
|
1.4
|
0.8--2.4
|
2.1
|
1.5--2.8
|
|
Utah
|
8.0
|
5.8--10.9
|
6.4
|
4.5--8.9
|
7.2
|
5.9--8.8
|
|
3.2
|
2.1--4.8
|
3.0
|
1.8--5.1
|
3.2
|
2.3--4.3
|
|
Vermont
|
5.1
|
4.3--6.2
|
3.4
|
2.7--4.4
|
4.3
|
3.9--4.8
|
|
1.8
|
1.3--2.4
|
1.3
|
0.9--1.8
|
1.6
|
1.4--1.8
|
|
West Virginia
|
11.7
|
9.3--14.7
|
9.8
|
7.4--12.7
|
10.7
|
9.0--12.7
|
|
4.0
|
2.6--6.1
|
4.9
|
3.3--7.1
|
4.6
|
3.2--6.7
|
|
Wisconsin
|
7.1
|
5.5--9.1
|
4.6
|
3.4--6.2
|
5.8
|
4.6--7.3
|
|
2.0
|
1.3--3.0
|
1.4
|
0.8--2.5
|
1.7
|
1.2--2.3
|
|
Wyoming
|
10.9
|
9.1--13.1
|
7.9
|
6.4--9.7
|
9.4
|
8.2--10.7
|
|
4.1
|
2.9--5.6
|
3.9
|
2.9--5.3
|
4.0
|
3.2--5.0
|
|
Median
|
9.3
|
6.8
|
7.9
|
|
3.0
|
2.7
|
2.8
|
|
Range
|
5.1--13.9
|
3.1--12.7
|
4.3--12.8
|
|
1.1--4.9
|
1.2--5.4
|
1.6--4.9
|
|
Local surveys
|
|
|
|
|
|
|
|
|
|
|
|
|
|
|
Boston, MA
|
11.6
|
8.9--15.0
|
9.6
|
7.2--12.8
|
10.8
|
8.7--13.4
|
|
3.1
|
1.9--5.2
|
4.1
|
2.6--6.3
|
3.7
|
2.6--5.2
|
|
Broward County, FL
|
8.0
|
5.8--10.9
|
4.7
|
3.1--7.0
|
6.4
|
5.0--8.1
|
|
2.8
|
1.6--5.0
|
3.1
|
1.9--4.9
|
2.9
|
2.0--4.2
|
|
Charlotte-Mecklenburg, NC
|
13.0
|
10.5--15.9
|
13.9
|
11.2--17.1
|
13.5
|
11.4--15.9
|
|
---
|
---
|
---
|
---
|
---
|
---
|
|
Chicago, IL
|
10.7
|
8.3--13.9
|
15.4
|
11.8--19.8
|
13.3
|
11.1--15.8
|
|
3.3
|
2.1--5.1
|
8.1
|
5.5--11.6
|
5.9
|
4.2--8.2
|
|
Clark County, NV
|
11.9
|
9.2--15.4
|
8.0
|
5.5--11.4
|
10.0
|
8.0--12.4
|
|
4.1
|
2.5--6.5
|
2.3
|
1.3--3.8
|
3.2
|
2.2--4.5
|
|
Dallas, TX
|
13.8
|
9.9--19.0
|
10.1
|
6.6--15.0
|
12.0
|
9.6--14.9
|
|
5.1
|
2.6--9.8
|
3.9
|
1.6--9.3
|
4.5
|
2.7--7.6
|
|
Detroit, MI
|
15.6
|
12.5--19.4
|
12.9
|
10.2--16.3
|
14.3
|
11.7--17.3
|
|
4.4
|
2.9--6.7
|
5.7
|
3.6--8.9
|
5.0
|
3.6--7.0
|
|
Duval County, FL
|
9.3
|
7.5--11.4
|
10.2
|
8.0--12.8
|
10.0
|
8.4--11.8
|
|
3.2
|
2.2--4.6
|
3.4
|
2.4--4.9
|
3.4
|
2.7--4.4
|
|
Los Angeles, CA
|
7.4
|
5.6--9.6
|
10.2
|
7.7--13.5
|
8.8
|
6.7--11.5
|
|
2.3
|
1.2--4.5
|
4.2
|
2.6--6.6
|
3.2
|
2.0--5.1
|
|
Memphis, TN
|
10.4
|
7.8--13.8
|
6.4
|
3.9--10.3
|
8.7
|
6.8--11.0
|
|
2.0
|
1.0--4.1
|
3.1
|
1.6--6.0
|
2.6
|
1.7--4.0
|
|
Miami-Dade County, FL
|
8.1
|
6.6--10.1
|
6.4
|
4.9--8.4
|
7.3
|
6.0--8.8
|
|
2.7
|
1.8--4.0
|
2.4
|
1.5--4.0
|
2.6
|
1.9--3.5
|
|
Milwaukee, WI
|
13.7
|
11.3--16.7
|
11.0
|
8.7--13.9
|
12.4
|
10.7--14.5
|
|
4.8
|
3.4--6.8
|
4.4
|
2.8--6.7
|
4.6
|
3.6--5.9
|
|
New York City, NY
|
10.7
|
9.4--12.2
|
9.0
|
7.9--10.3
|
9.9
|
9.0--10.9
|
|
3.4
|
2.7--4.5
|
3.4
|
2.7--4.4
|
3.4
|
2.9--4.0
|
|
Orange County, FL
|
9.5
|
6.7--13.3
|
4.9
|
3.3--7.2
|
7.3
|
5.6--9.6
|
|
2.5
|
1.5--4.2
|
1.9
|
1.0--3.4
|
2.3
|
1.6--3.3
|
|
Palm Beach County, FL
|
9.4
|
7.7--11.5
|
5.8
|
4.1--8.3
|
7.8
|
6.5--9.4
|
|
2.6
|
1.7--4.0
|
2.2
|
1.4--3.5
|
2.6
|
1.9--3.6
|
|
Philadelphia, PA
|
14.7
|
10.9--19.5
|
8.8
|
5.6--13.3
|
12.0
|
9.2--15.5
|
|
4.4
|
2.6--7.5
|
4.7
|
2.2--9.6
|
4.5
|
2.7--7.6
|
|
San Bernardino, CA
|
10.2
|
7.7--13.4
|
8.5
|
6.0--11.9
|
9.4
|
7.4--12.0
|
|
3.1
|
1.8--5.5
|
2.5
|
1.3--4.7
|
2.8
|
1.9--4.1
|
|
San Diego, CA
|
7.9
|
5.8--10.7
|
4.1
|
2.8--5.9
|
6.0
|
4.8--7.5
|
|
1.9
|
1.0--3.7
|
1.3
|
0.7--2.3
|
1.6
|
0.9--2.7
|
|
San Francisco, CA
|
9.0
|
7.2--11.2
|
9.3
|
7.4--11.6
|
9.1
|
7.8--10.7
|
|
3.7
|
2.4--5.5
|
3.9
|
2.7--5.4
|
3.8
|
3.0--4.8
|
|
Seattle, WA
|
8.3
|
6.4--10.6
|
8.5
|
6.2--11.5
|
8.6
|
7.0--10.5
|
|
3.6
|
2.3--5.6
|
4.6
|
3.1--6.7
|
4.1
|
3.1--5.3
|
|
Median
|
10.3
|
8.9
|
9.6
|
|
3.2
|
3.4
|
3.4
|
|
Range
|
7.4--15.6
|
4.1--15.4
|
6.0--14.3
|
|
1.9--5.1
|
1.3--8.1
|
1.6--5.9
|
|
|
Ever smoked cigarettes*
|
|
Ever smoked cigarettes daily†
|
|
|
Female
|
Male
|
Total
|
|
Female
|
Male
|
Total
|
|
Category
|
%
|
CI§
|
%
|
CI
|
%
|
CI
|
|
%
|
CI
|
%
|
CI
|
%
|
CI
|
|
Race/Ethnicity
|
|
|
|
|
|
|
|
|
|
|
|
|
|
|
White¶
|
47.2
|
43.9--50.5
|
45.2
|
39.7--50.9
|
46.1
|
42.3--50.0
|
|
13.8
|
11.8--16.1
|
13.7
|
11.5--16.2
|
13.7
|
12.0--15.7
|
|
Black¶
|
43.4
|
37.3--49.7
|
43.5
|
39.2--47.9
|
43.5
|
39.0--48.0
|
|
3.1
|
2.1--4.6
|
5.4
|
4.0--7.2
|
4.3
|
3.3--5.4
|
|
Hispanic
|
47.6
|
43.4--51.8
|
54.5
|
50.4--58.6
|
51.0
|
47.4--54.6
|
|
7.7
|
6.3--9.5
|
9.4
|
7.8--11.4
|
8.6
|
7.5--9.9
|
|
Grade
|
|
|
|
|
|
|
|
|
|
|
|
|
|
|
9
|
37.4
|
33.3--41.6
|
37.9
|
33.9--42.2
|
37.7
|
34.6--40.8
|
|
7.7
|
6.1--9.6
|
7.8
|
6.6--9.2
|
7.7
|
6.6--8.9
|
|
10
|
44.0
|
40.5--47.6
|
44.0
|
37.6--50.5
|
44.0
|
39.9--48.3
|
|
8.3
|
6.5--10.7
|
9.3
|
6.9--12.4
|
8.9
|
7.2--10.8
|
|
11
|
50.0
|
45.8--54.1
|
50.0
|
45.4--54.7
|
50.0
|
46.2--53.8
|
|
11.7
|
9.4--14.5
|
14.2
|
12.0--16.8
|
13.0
|
11.1--15.2
|
|
12
|
54.8
|
50.8--58.9
|
56.1
|
50.4--61.7
|
55.5
|
52.0--58.9
|
|
15.5
|
13.1--18.2
|
17.1
|
14.6--20.0
|
16.3
|
14.1--18.8
|
|
Total
|
46.1
|
43.7--48.6
|
46.3
|
42.6--50.0
|
46.3
|
43.7--48.9
|
|
10.6
|
9.1--12.3
|
11.7
|
10.4--13.1
|
11.2
|
10.0--12.6
|
|
|
Ever smoked cigarettes*
|
|
Ever smoked cigarettes daily†
|
|
|
Female
|
Male
|
Total
|
|
Female
|
Male
|
Total
|
|
Site
|
%
|
CI§
|
%
|
CI
|
%
|
CI
|
|
%
|
CI
|
%
|
CI
|
%
|
CI
|
|
State surveys
|
|
|
|
|
|
|
|
|
|
|
|
|
|
|
Alabama
|
46.3
|
41.3--51.3
|
59.4
|
54.9--63.8
|
52.8
|
49.0--56.6
|
|
11.8
|
8.7--15.9
|
17.2
|
14.7--20.0
|
14.5
|
12.4--17.0
|
|
Alaska
|
48.1
|
43.6--52.6
|
46.8
|
42.0--51.6
|
47.5
|
44.1--50.9
|
|
11.2
|
8.6--14.3
|
9.4
|
7.1--12.4
|
10.3
|
8.3--12.8
|
|
Arizona
|
50.7
|
45.9--55.5
|
56.2
|
51.3--61.0
|
53.6
|
49.3--57.8
|
|
---¶
|
---
|
---
|
---
|
---
|
---
|
|
Arkansas
|
53.4
|
47.8--58.9
|
56.3
|
51.5--61.0
|
54.9
|
50.8--59.0
|
|
17.3
|
12.3--23.7
|
12.0
|
9.0--15.9
|
14.8
|
11.4--19.0
|
|
Colorado
|
41.4
|
35.0--48.2
|
44.6
|
37.5--51.9
|
43.1
|
36.9--49.5
|
|
10.7
|
7.0--16.0
|
10.5
|
6.8--15.7
|
10.6
|
7.3--15.2
|
|
Connecticut
|
---
|
---
|
---
|
---
|
---
|
---
|
|
---
|
---
|
---
|
---
|
---
|
---
|
|
Delaware
|
50.6
|
46.4--54.7
|
44.8
|
40.7--49.1
|
47.7
|
44.7--50.7
|
|
12.7
|
10.3--15.4
|
10.9
|
8.6--13.6
|
11.9
|
10.0--14.0
|
|
Florida
|
---
|
---
|
---
|
---
|
---
|
---
|
|
8.0
|
6.9--9.2
|
9.2
|
8.0--10.6
|
8.8
|
7.8--9.9
|
|
Georgia
|
45.4
|
40.6--50.3
|
53.2
|
48.6--57.7
|
49.2
|
45.2--53.3
|
|
9.4
|
6.9--12.6
|
11.3
|
8.9--14.3
|
10.3
|
8.3--12.8
|
|
Hawaii
|
---
|
---
|
---
|
---
|
---
|
---
|
|
---
|
---
|
---
|
---
|
---
|
---
|
|
Idaho
|
37.3
|
33.1--41.8
|
41.8
|
37.4--46.3
|
39.6
|
35.7--43.6
|
|
8.5
|
6.6--10.8
|
8.6
|
6.8--10.7
|
8.5
|
7.1--10.2
|
|
Illinois
|
48.5
|
43.7--53.4
|
52.5
|
47.2--57.8
|
50.6
|
46.7--54.4
|
|
9.2
|
7.4--11.5
|
14.5
|
11.4--18.4
|
11.9
|
9.8--14.5
|
|
Indiana
|
52.4
|
47.1--57.6
|
51.9
|
46.4--57.3
|
52.2
|
47.5--56.9
|
|
15.5
|
11.9--19.9
|
18.1
|
14.4--22.4
|
16.9
|
14.1--20.2
|
|
Kansas
|
43.5
|
38.3--48.8
|
44.0
|
39.9--48.1
|
43.7
|
40.3--47.2
|
|
8.7
|
6.1--12.3
|
12.0
|
9.9--14.5
|
10.4
|
8.4--12.7
|
|
Kentucky
|
57.1
|
50.6--63.3
|
61.1
|
55.3--66.6
|
59.0
|
53.9--64.0
|
|
19.8
|
15.3--25.1
|
20.3
|
15.5--26.0
|
20.0
|
16.2--24.4
|
|
Louisiana
|
52.8
|
47.9--57.6
|
57.2
|
50.2--64.0
|
54.8
|
49.9--59.7
|
|
11.1
|
7.3--16.4
|
10.7
|
6.9--16.1
|
10.8
|
8.7--13.4
|
|
Maine
|
---
|
---
|
---
|
---
|
---
|
---
|
|
---
|
---
|
---
|
---
|
---
|
---
|
|
Maryland
|
42.1
|
37.8--46.5
|
44.9
|
41.3--48.6
|
43.5
|
40.0--47.2
|
|
8.6
|
6.5--11.3
|
8.7
|
6.4--11.6
|
8.6
|
7.1--10.4
|
|
Massachusetts
|
41.0
|
36.9--45.3
|
45.6
|
41.1--50.1
|
43.3
|
39.4--47.3
|
|
11.1
|
8.9--13.9
|
13.8
|
11.5--16.4
|
12.5
|
10.6--14.7
|
|
Michigan
|
46.8
|
43.3--50.4
|
45.2
|
41.9--48.6
|
46.0
|
43.4--48.6
|
|
12.2
|
9.5--15.6
|
12.7
|
10.6--15.1
|
12.5
|
10.2--15.1
|
|
Mississippi
|
52.0
|
46.3--57.7
|
55.6
|
50.1--60.9
|
53.7
|
49.0--58.4
|
|
9.9
|
7.3--13.4
|
13.1
|
10.6--16.1
|
11.5
|
9.6--13.7
|
|
Missouri
|
46.0
|
39.9--52.2
|
46.8
|
39.9--53.8
|
46.5
|
40.6--52.4
|
|
10.1
|
7.0--14.4
|
11.4
|
7.9--16.0
|
10.8
|
8.0--14.4
|
|
Montana
|
49.4
|
43.0--55.8
|
50.6
|
44.7--56.5
|
50.0
|
44.6--55.5
|
|
14.3
|
11.2--17.9
|
12.7
|
10.1--15.8
|
13.5
|
11.0--16.4
|
|
Nevada
|
44.4
|
40.7--48.2
|
50.3
|
46.1--54.6
|
47.5
|
44.1--51.0
|
|
---
|
---
|
---
|
---
|
---
|
---
|
|
New Hampshire
|
---
|
---
|
---
|
---
|
---
|
---
|
|
---
|
---
|
---
|
---
|
---
|
---
|
|
New Jersey
|
39.8
|
34.6--45.3
|
45.7
|
40.3--51.2
|
42.8
|
38.2--47.6
|
|
---
|
---
|
---
|
---
|
---
|
---
|
|
New Mexico
|
57.2
|
55.0--59.4
|
58.6
|
55.3--61.8
|
58.0
|
55.7--60.2
|
|
---
|
---
|
---
|
---
|
---
|
---
|
|
New York
|
35.0
|
31.8--38.3
|
39.0
|
35.2--43.0
|
37.2
|
34.1--40.5
|
|
7.6
|
5.9--9.7
|
9.7
|
7.5--12.5
|
9.0
|
7.3--11.0
|
|
North Carolina
|
---
|
---
|
---
|
---
|
---
|
---
|
|
---
|
---
|
---
|
---
|
---
|
---
|
|
North Dakota
|
45.5
|
40.9--50.1
|
47.1
|
43.2--51.0
|
46.5
|
43.0--50.0
|
|
---
|
---
|
---
|
---
|
---
|
---
|
|
Oklahoma
|
49.0
|
41.8--56.1
|
48.7
|
41.9--55.5
|
48.8
|
42.8--54.9
|
|
12.3
|
9.0--16.6
|
14.0
|
10.7--18.3
|
13.3
|
10.3--17.0
|
|
Pennsylvania
|
46.6
|
41.5--51.8
|
43.9
|
39.6--48.4
|
45.1
|
41.2--49.1
|
|
11.6
|
8.7--15.2
|
10.5
|
8.5--13.0
|
11.0
|
9.0--13.5
|
|
Rhode Island
|
38.6
|
35.1--42.1
|
39.9
|
34.7--45.4
|
39.4
|
35.7--43.2
|
|
9.7
|
7.4--12.6
|
8.5
|
6.6--10.9
|
9.2
|
7.5--11.1
|
|
South Carolina
|
49.8
|
41.8--57.8
|
56.8
|
50.4--62.9
|
53.2
|
47.1--59.3
|
|
11.0
|
8.3--14.5
|
13.2
|
9.2--18.6
|
12.2
|
9.2--16.0
|
|
South Dakota
|
46.5
|
41.5--51.5
|
50.9
|
45.5--56.3
|
48.8
|
44.0--53.5
|
|
12.7
|
9.3--17.3
|
14.6
|
11.1--19.0
|
13.7
|
10.9--17.2
|
|
Tennessee
|
48.2
|
43.2--53.2
|
53.2
|
48.0--58.3
|
50.7
|
46.4--55.0
|
|
12.4
|
9.4--16.3
|
14.8
|
12.0--18.0
|
13.7
|
11.1--16.8
|
|
Texas
|
47.4
|
44.1--50.6
|
53.2
|
49.2--57.1
|
50.3
|
47.3--53.3
|
|
8.2
|
6.5--10.3
|
11.1
|
8.8--13.9
|
9.7
|
8.2--11.4
|
|
Utah
|
20.2
|
15.7--25.5
|
26.7
|
20.1--34.6
|
23.5
|
18.9--28.9
|
|
4.3
|
3.0--6.1
|
5.7
|
4.1--7.9
|
5.0
|
3.9--6.4
|
|
Vermont
|
---
|
---
|
---
|
---
|
---
|
---
|
|
---
|
---
|
---
|
---
|
---
|
---
|
|
West Virginia
|
57.0
|
51.5--62.3
|
53.4
|
48.8--57.9
|
55.2
|
51.1--59.1
|
|
19.2
|
14.7--24.6
|
16.3
|
13.1--20.1
|
17.7
|
14.7--21.2
|
|
Wisconsin
|
42.5
|
38.1--47.0
|
44.6
|
40.2--49.1
|
43.6
|
39.5--47.8
|
|
10.8
|
8.7--13.3
|
11.7
|
9.3--14.6
|
11.3
|
9.3--13.7
|
|
Wyoming
|
51.1
|
47.8--54.4
|
53.7
|
50.2--57.2
|
52.5
|
49.7--55.2
|
|
16.8
|
14.3--19.6
|
15.6
|
13.4--18.1
|
16.3
|
14.4--18.3
|
|
Median
|
46.8
|
50.3
|
48.8
|
|
11.1
|
12.0
|
11.5
|
|
Range
|
20.2--57.2
|
26.7--61.1
|
23.5--59.0
|
|
4.3--19.8
|
5.7--20.3
|
5.0--20.0
|
|
Local surveys
|
|
|
|
|
|
|
|
|
|
|
|
|
|
|
Boston, MA
|
38.2
|
33.3--43.3
|
46.3
|
40.6--52.0
|
42.1
|
37.6--46.8
|
|
5.1
|
3.6--7.2
|
6.3
|
4.0--9.6
|
5.7
|
4.3--7.5
|
|
Broward County, FL
|
36.7
|
31.8--41.9
|
34.4
|
30.3--38.7
|
35.4
|
31.8--39.3
|
|
7.1
|
5.4--9.3
|
8.4
|
6.5--10.8
|
7.7
|
6.5--9.2
|
|
Charlotte-Mecklenburg, NC
|
---
|
---
|
---
|
---
|
---
|
---
|
|
---
|
---
|
---
|
---
|
---
|
---
|
|
Chicago, IL
|
48.8
|
43.0--54.7
|
51.5
|
44.9--58.0
|
50.3
|
45.0--55.6
|
|
5.8
|
3.5--9.6
|
8.3
|
5.8--11.6
|
7.1
|
5.1--9.7
|
|
Clark County, NV
|
44.8
|
40.4--49.4
|
48.3
|
43.2--53.3
|
46.7
|
42.6--50.8
|
|
---
|
---
|
---
|
---
|
---
|
---
|
|
Dallas, TX
|
45.8
|
41.6--50.2
|
56.5
|
50.9--61.9
|
51.0
|
47.0--55.0
|
|
3.1
|
1.8--5.6
|
6.6
|
4.5--9.4
|
4.8
|
3.2--7.0
|
|
Detroit, MI
|
47.6
|
42.6--52.6
|
45.5
|
39.0--52.2
|
46.6
|
42.4--50.8
|
|
2.8
|
1.7--4.7
|
5.2
|
3.3--8.0
|
4.0
|
2.9--5.5
|
|
Duval County, FL
|
---
|
---
|
---
|
---
|
---
|
---
|
|
8.4
|
6.6--10.5
|
10.0
|
7.8--12.9
|
9.3
|
7.7--11.2
|
|
Los Angeles, CA
|
37.2
|
30.7--44.1
|
45.5
|
37.5--53.8
|
41.4
|
34.3--48.7
|
|
2.9
|
1.6--5.1
|
4.2
|
2.6--6.8
|
3.6
|
2.3--5.5
|
|
Memphis, TN
|
32.8
|
28.6--37.3
|
37.1
|
32.6--41.7
|
35.0
|
31.9--38.2
|
|
1.6
|
0.7--3.8
|
5.1
|
3.7--7.1
|
3.3
|
2.4--4.6
|
|
Miami-Dade County, FL
|
37.4
|
33.4--41.6
|
43.3
|
38.1--48.7
|
40.4
|
36.7--44.1
|
|
4.4
|
3.0--6.2
|
7.1
|
5.6--9.1
|
5.8
|
4.7--7.1
|
|
Milwaukee, WI
|
46.8
|
43.2--50.4
|
48.8
|
45.1--52.5
|
47.8
|
45.4--50.2
|
|
6.7
|
5.3--8.3
|
8.8
|
6.7--11.5
|
7.8
|
6.2--9.6
|
|
New York City, NY
|
35.1
|
32.2--38.0
|
35.6
|
32.9--38.3
|
35.3
|
32.9--37.8
|
|
4.6
|
3.6--5.8
|
5.3
|
4.5--6.3
|
4.9
|
4.2--5.7
|
|
Orange County, FL
|
40.8
|
36.1--45.7
|
45.5
|
40.6--50.4
|
43.1
|
39.7--46.6
|
|
7.5
|
5.3--10.6
|
7.7
|
5.7--10.3
|
7.6
|
6.0--9.5
|
|
Palm Beach County, FL
|
42.8
|
39.2--46.6
|
42.1
|
37.9--46.5
|
42.7
|
39.7--45.7
|
|
8.2
|
6.3--10.4
|
8.1
|
6.3--10.4
|
8.2
|
6.9--9.7
|
|
Philadelphia, PA
|
51.7
|
47.5--56.0
|
47.8
|
41.7--53.9
|
49.9
|
45.7--54.1
|
|
7.2
|
5.6--9.2
|
7.4
|
5.3--10.4
|
7.4
|
5.8--9.4
|
|
San Bernardino, CA
|
38.4
|
33.6--43.6
|
48.2
|
43.5--52.9
|
43.4
|
39.8--47.2
|
|
3.6
|
2.4--5.3
|
7.7
|
6.0--9.8
|
5.6
|
4.5--7.1
|
|
San Diego, CA
|
40.5
|
36.1--45.0
|
46.6
|
42.3--51.0
|
43.7
|
40.3--47.0
|
|
4.2
|
3.0--6.0
|
7.1
|
5.3--9.5
|
5.7
|
4.4--7.3
|
|
San Francisco, CA
|
30.5
|
27.1--34.2
|
40.5
|
36.7--44.3
|
35.6
|
32.7--38.6
|
|
5.3
|
3.8--7.3
|
7.0
|
5.6--8.7
|
6.3
|
5.2--7.6
|
|
Seattle, WA
|
34.1
|
29.9--38.6
|
41.0
|
36.6--45.5
|
37.7
|
34.4--41.1
|
|
5.0
|
3.5--6.9
|
6.7
|
5.2--8.8
|
6.1
|
4.9--7.5
|
|
Median
|
39.4
|
45.5
|
42.9
|
|
5.0
|
7.1
|
5.9
|
|
Range
|
30.5--51.7
|
34.4--56.5
|
35.0--51.0
|
|
1.6--8.4
|
4.2--10.0
|
3.3--9.3
|
|
|
Current cigarette use*
|
|
Current frequent cigarette use†
|
|
|
Female
|
Male
|
Total
|
|
Female
|
Male
|
Total
|
|
Category
|
%
|
CI§
|
%
|
CI
|
%
|
CI
|
|
%
|
CI
|
%
|
CI
|
%
|
CI
|
|
Race/Ethnicity
|
|
|
|
|
|
|
|
|
|
|
|
|
|
|
White¶
|
22.8
|
20.3--25.5
|
22.3
|
18.9--26.0
|
22.5
|
20.0--25.2
|
|
9.0
|
7.5--10.8
|
10.0
|
8.5--11.8
|
9.5
|
8.2--11.1
|
|
Black¶
|
8.4
|
6.5--10.9
|
10.7
|
8.4--13.5
|
9.5
|
8.2--11.1
|
|
1.4
|
0.7--2.5
|
2.9
|
1.8--4.6
|
2.1
|
1.4--3.2
|
|
Hispanic
|
16.7
|
14.4--19.2
|
19.4
|
16.7--22.5
|
18.0
|
16.0--20.2
|
|
3.2
|
2.4--4.3
|
5.2
|
3.8--7.0
|
4.2
|
3.3--5.3
|
|
Grade
|
|
|
|
|
|
|
|
|
|
|
|
|
|
|
9
|
15.2
|
13.1--17.5
|
12.1
|
10.0--14.6
|
13.5
|
12.0--15.3
|
|
4.4
|
3.0--6.4
|
4.9
|
3.8--6.2
|
4.7
|
3.7--5.9
|
|
10
|
18.7
|
16.2--21.5
|
17.8
|
14.0--22.4
|
18.3
|
15.9--21.0
|
|
5.6
|
4.3--7.4
|
5.8
|
4.3--7.8
|
5.7
|
4.7--7.0
|
|
11
|
20.6
|
17.5--24.2
|
23.9
|
20.6--27.4
|
22.3
|
19.6--25.2
|
|
7.1
|
5.6--8.9
|
9.5
|
7.9--11.4
|
8.3
|
7.0--9.8
|
|
12
|
22.4
|
19.7--25.4
|
28.1
|
24.3--32.2
|
25.2
|
22.5--28.1
|
|
8.9
|
7.1--11.2
|
13.5
|
11.1--16.3
|
11.2
|
9.5--13.2
|
|
Total
|
19.1
|
17.2--21.0
|
19.8
|
17.8--21.9
|
19.5
|
17.9--21.2
|
|
6.4
|
5.4--7.6
|
8.0
|
7.1--9.0
|
7.3
|
6.4--8.3
|
|
|
Current cigarette use*
|
|
Current frequent cigarette use†
|
|
|
Female
|
Male
|
Total
|
|
Female
|
Male
|
Total
|
|
Site
|
%
|
CI§
|
%
|
CI
|
%
|
CI
|
|
%
|
CI
|
%
|
CI
|
%
|
CI
|
|
State surveys
|
|
|
|
|
|
|
|
|
|
|
|
|
|
|
Alabama
|
17.8
|
14.7--21.5
|
24.0
|
20.2--28.2
|
20.8
|
18.0--24.0
|
|
6.5
|
4.2--9.8
|
10.8
|
7.8--14.8
|
8.6
|
6.7--10.9
|
|
Alaska
|
17.1
|
13.8--21.0
|
14.2
|
11.3--17.7
|
15.7
|
13.1--18.8
|
|
5.7
|
3.5--9.0
|
4.4
|
3.0--6.5
|
5.1
|
3.7--6.9
|
|
Arizona
|
17.3
|
14.3--20.7
|
21.8
|
18.3--25.8
|
19.7
|
16.9--22.9
|
|
4.6
|
3.1--6.9
|
7.8
|
5.7--10.5
|
6.2
|
4.5--8.4
|
|
Arkansas
|
20.8
|
16.6--25.8
|
19.6
|
15.5--24.4
|
20.3
|
16.7--24.5
|
|
11.2
|
7.5--16.5
|
8.0
|
5.7--11.2
|
9.7
|
7.0--13.2
|
|
Colorado
|
17.4
|
12.4--23.8
|
17.8
|
13.3--23.6
|
17.7
|
13.2--23.2
|
|
7.3
|
4.4--11.7
|
8.4
|
5.4--12.8
|
7.8
|
5.1--11.8
|
|
Connecticut
|
16.5
|
13.7--19.7
|
19.0
|
16.3--22.1
|
17.8
|
15.3--20.5
|
|
5.2
|
3.6--7.5
|
7.1
|
5.0--9.9
|
6.2
|
4.5--8.4
|
|
Delaware
|
19.1
|
15.9--22.7
|
18.7
|
15.9--21.9
|
19.0
|
16.6--21.7
|
|
7.6
|
5.8--10.0
|
7.6
|
6.0--9.6
|
7.8
|
6.4--9.4
|
|
Florida
|
15.4
|
13.7--17.2
|
16.8
|
15.0--18.7
|
16.1
|
14.8--17.5
|
|
5.2
|
4.5--6.0
|
7.1
|
6.2--8.1
|
6.2
|
5.5--6.9
|
|
Georgia
|
14.6
|
11.3--18.7
|
19.5
|
16.7--22.7
|
16.9
|
14.3--19.9
|
|
6.0
|
3.9--9.0
|
6.7
|
5.2--8.6
|
6.3
|
4.8--8.3
|
|
Hawaii
|
15.9
|
12.1--20.6
|
14.4
|
11.4--18.0
|
15.2
|
12.7--18.0
|
|
4.6
|
2.3--9.2
|
5.0
|
2.9--8.6
|
4.8
|
3.5--6.7
|
|
Idaho
|
14.8
|
11.8--18.4
|
14.1
|
11.7--16.9
|
14.5
|
12.4--16.8
|
|
3.8
|
2.6--5.3
|
4.9
|
3.6--6.6
|
4.4
|
3.5--5.5
|
|
Illinois
|
14.5
|
11.6--17.9
|
21.4
|
16.9--26.8
|
18.1
|
15.0--21.8
|
|
5.2
|
3.8--7.1
|
9.7
|
7.0--13.2
|
7.6
|
5.7--10.2
|
|
Indiana
|
22.6
|
18.6--27.1
|
24.3
|
20.5--28.6
|
23.5
|
20.4--27.0
|
|
10.8
|
7.5--15.4
|
12.6
|
9.4--16.7
|
11.8
|
9.1--15.2
|
|
Kansas
|
16.2
|
12.9--20.2
|
17.6
|
14.3--21.5
|
16.9
|
14.2--20.0
|
|
6.0
|
4.1--8.7
|
7.1
|
5.3--9.4
|
6.5
|
5.1--8.4
|
|
Kentucky
|
23.1
|
18.0--29.2
|
29.1
|
25.2--33.3
|
26.1
|
22.2--30.4
|
|
12.0
|
8.8--16.1
|
12.1
|
9.0--16.0
|
12.0
|
9.3--15.3
|
|
Louisiana
|
16.9
|
13.3--21.3
|
18.3
|
14.2--23.3
|
17.6
|
14.7--20.9
|
|
5.1
|
3.5--7.3
|
7.6
|
4.7--11.8
|
6.2
|
4.8--8.1
|
|
Maine
|
16.5
|
15.1--17.9
|
19.4
|
18.0--20.8
|
18.1
|
17.0--19.1
|
|
7.1
|
6.2--8.1
|
9.9
|
8.9--11.0
|
8.6
|
7.8--9.4
|
|
Maryland
|
11.6
|
9.3--14.5
|
12.0
|
9.0--15.9
|
11.9
|
9.7--14.4
|
|
4.3
|
2.7--6.9
|
4.4
|
2.5--7.7
|
4.4
|
2.9--6.7
|
|
Massachusetts
|
13.9
|
11.5--16.8
|
18.0
|
15.5--20.8
|
16.0
|
13.9--18.3
|
|
5.5
|
4.1--7.3
|
8.3
|
6.7--10.2
|
6.9
|
5.6--8.5
|
|
Michigan
|
19.1
|
16.3--22.2
|
18.4
|
15.9--21.2
|
18.8
|
16.5--21.4
|
|
8.5
|
6.4--11.2
|
7.1
|
5.8--8.7
|
7.8
|
6.2--9.8
|
|
Mississippi
|
17.1
|
12.9--22.2
|
22.3
|
18.7--26.3
|
19.6
|
16.8--22.8
|
|
7.2
|
5.0--10.3
|
9.9
|
7.5--12.9
|
8.5
|
6.7--10.7
|
|
Missouri
|
19.1
|
15.6--23.1
|
18.8
|
14.4--24.1
|
18.9
|
15.7--22.7
|
|
6.6
|
4.3--10.0
|
7.0
|
4.9--10.1
|
6.8
|
5.0--9.3
|
|
Montana
|
19.8
|
15.9--24.5
|
17.7
|
13.9--22.4
|
18.7
|
15.2--22.8
|
|
7.5
|
5.6--9.9
|
8.4
|
6.0--11.7
|
7.9
|
6.0--10.4
|
|
Nevada
|
15.3
|
13.1--17.8
|
18.6
|
15.2--22.4
|
17.0
|
14.8--19.6
|
|
4.8
|
3.4--6.6
|
7.9
|
5.6--11.2
|
6.4
|
4.9--8.5
|
|
New Hampshire
|
20.0
|
16.0--24.6
|
21.6
|
18.2--25.4
|
20.8
|
17.8--24.1
|
|
9.6
|
6.9--13.3
|
9.2
|
6.9--12.2
|
9.5
|
7.3--12.1
|
|
New Jersey
|
13.7
|
11.1--16.8
|
20.0
|
16.5--24.0
|
17.0
|
14.4--20.0
|
|
3.5
|
2.1--5.6
|
7.2
|
5.3--9.7
|
5.5
|
4.1--7.3
|
|
New Mexico
|
23.2
|
20.6--26.0
|
24.6
|
20.9--28.7
|
24.0
|
21.2--27.0
|
|
5.8
|
4.2--8.0
|
8.5
|
6.7--10.8
|
7.2
|
5.7--9.0
|
|
New York
|
12.7
|
10.6--15.3
|
16.2
|
14.0--18.8
|
14.8
|
12.8--16.9
|
|
4.3
|
3.0--6.2
|
6.7
|
5.1--8.8
|
5.8
|
4.4--7.6
|
|
North Carolina
|
14.9
|
11.5--19.1
|
20.6
|
17.7--23.9
|
17.7
|
14.8--21.0
|
|
5.3
|
3.8--7.3
|
7.3
|
5.8--9.0
|
6.3
|
5.1--7.8
|
|
North Dakota
|
21.5
|
17.8--25.8
|
23.2
|
19.2--27.8
|
22.4
|
19.5--25.7
|
|
8.4
|
5.9--11.8
|
10.3
|
7.7--13.5
|
9.3
|
7.5--11.6
|
|
Oklahoma
|
22.6
|
17.3--29.0
|
22.5
|
17.8--28.0
|
22.6
|
18.2--27.7
|
|
7.9
|
4.9--12.3
|
10.0
|
6.9--14.2
|
9.1
|
6.6--12.4
|
|
Pennsylvania
|
18.7
|
14.3--24.1
|
18.3
|
15.2--21.8
|
18.4
|
15.1--22.3
|
|
7.5
|
5.1--10.9
|
7.8
|
5.9--10.1
|
7.6
|
5.7--10.2
|
|
Rhode Island
|
13.2
|
10.0--17.3
|
13.3
|
11.1--15.9
|
13.3
|
10.8--16.3
|
|
5.2
|
3.7--7.3
|
5.6
|
4.0--7.9
|
5.4
|
4.1--7.1
|
|
South Carolina
|
18.7
|
15.2--22.7
|
22.2
|
17.9--27.2
|
20.5
|
17.7--23.6
|
|
7.3
|
5.0--10.6
|
8.2
|
5.6--12.1
|
7.8
|
5.8--10.5
|
|
South Dakota
|
22.6
|
17.7--28.3
|
23.9
|
19.5--29.0
|
23.2
|
19.5--27.4
|
|
8.9
|
6.4--12.3
|
9.3
|
6.9--12.5
|
9.1
|
7.2--11.6
|
|
Tennessee
|
18.5
|
14.5--23.4
|
23.1
|
18.7--28.2
|
20.9
|
17.2--25.1
|
|
8.6
|
6.4--11.3
|
11.0
|
8.4--14.5
|
9.9
|
7.8--12.4
|
|
Texas
|
18.2
|
15.4--21.4
|
24.0
|
20.9--27.5
|
21.2
|
18.9--23.7
|
|
4.5
|
3.3--6.0
|
7.8
|
5.8--10.3
|
6.2
|
4.9--7.8
|
|
Utah
|
6.5
|
4.6--9.1
|
10.2
|
7.3--14.1
|
8.5
|
6.4--11.1
|
|
1.5
|
0.9--2.5
|
3.6
|
2.4--5.4
|
2.6
|
1.8--3.8
|
|
Vermont
|
17.4
|
15.4--19.6
|
17.4
|
15.4--19.5
|
17.6
|
16.0--19.4
|
|
7.4
|
6.2--8.7
|
8.3
|
7.3--9.3
|
7.9
|
7.1--8.9
|
|
West Virginia
|
22.2
|
18.4--26.6
|
21.2
|
17.4--25.7
|
21.8
|
18.8--25.1
|
|
11.7
|
8.3--16.3
|
11.0
|
8.8--13.8
|
11.4
|
9.0--14.5
|
|
Wisconsin
|
16.0
|
13.2--19.3
|
17.7
|
14.9--21.0
|
16.9
|
14.4--19.7
|
|
6.4
|
4.8--8.6
|
7.7
|
5.5--10.6
|
7.1
|
5.5--9.2
|
|
Wyoming
|
20.7
|
18.3--23.4
|
23.4
|
20.8--26.2
|
22.1
|
20.2--24.2
|
|
9.0
|
7.3--11.0
|
10.5
|
8.7--12.6
|
9.8
|
8.4--11.4
|
|
Median
|
17.3
|
19.2
|
18.2
|
|
6.4
|
7.8
|
7.4
|
|
Range
|
6.5--23.2
|
10.2--29.1
|
8.5--26.1
|
|
1.5--12.0
|
3.6--12.6
|
2.6--12.0
|
|
Local surveys
|
|
|
|
|
|
|
|
|
|
|
|
|
|
|
Boston, MA
|
8.4
|
6.2--11.3
|
12.4
|
7.4--19.9
|
10.3
|
7.1--14.7
|
|
2.3
|
1.3--4.0
|
3.9
|
1.9--7.8
|
3.1
|
1.9--5.0
|
|
Broward County, FL
|
12.4
|
10.1--15.1
|
13.9
|
11.5--16.8
|
13.1
|
11.2--15.2
|
|
3.5
|
2.5--5.1
|
6.6
|
4.9--8.8
|
5.0
|
4.0--6.3
|
|
Charlotte-Mecklenburg, NC
|
11.0
|
8.9--13.4
|
14.9
|
11.8--18.6
|
13.0
|
11.0--15.2
|
|
3.2
|
2.1--4.8
|
5.2
|
3.7--7.3
|
4.2
|
3.3--5.4
|
|
Chicago, IL
|
10.2
|
7.2--14.4
|
14.5
|
10.7--19.4
|
12.5
|
9.4--16.3
|
|
1.7
|
0.8--3.6
|
3.7
|
1.9--6.8
|
2.7
|
1.5--5.0
|
|
Clark County, NV
|
13.8
|
11.2--16.8
|
17.0
|
13.0--22.0
|
15.4
|
12.7--18.7
|
|
4.1
|
2.7--6.1
|
8.7
|
5.5--13.5
|
6.4
|
4.4--9.3
|
|
Dallas, TX
|
8.7
|
6.4--11.7
|
14.2
|
11.2--17.9
|
11.4
|
9.1--14.1
|
|
1.9
|
0.9--4.2
|
2.5
|
1.2--4.9
|
2.2
|
1.2--3.8
|
|
Detroit, MI
|
5.1
|
3.5--7.4
|
9.2
|
6.3--13.2
|
7.1
|
5.2--9.5
|
|
0.6
|
0.2--1.7
|
2.4
|
1.2--4.7
|
1.5
|
0.8--2.7
|
|
Duval County, FL
|
13.1
|
10.8--15.7
|
17.7
|
14.9--20.9
|
15.4
|
13.4--17.7
|
|
4.5
|
3.3--6.1
|
7.3
|
5.6--9.6
|
5.9
|
4.7--7.2
|
|
Los Angeles, CA
|
10.0
|
7.5--13.1
|
11.9
|
8.1--17.0
|
10.9
|
8.3--14.3
|
|
1.1
|
0.6--2.1
|
2.2
|
1.2--3.8
|
1.6
|
1.0--2.7
|
|
Memphis, TN
|
3.3
|
2.0--5.5
|
8.7
|
6.4--11.6
|
5.9
|
4.5--7.7
|
|
0.8
|
0.2--3.0
|
3.7
|
2.6--5.4
|
2.2
|
1.4--3.4
|
|
Miami-Dade County, FL
|
12.5
|
10.1--15.4
|
15.2
|
12.9--18.0
|
13.9
|
12.1--16.1
|
|
2.4
|
1.5--4.0
|
4.5
|
3.3--6.0
|
3.5
|
2.7--4.6
|
|
Milwaukee, WI
|
8.3
|
6.7--10.3
|
12.7
|
10.1--15.9
|
10.5
|
8.8--12.4
|
|
3.8
|
2.6--5.6
|
4.7
|
2.9--7.6
|
4.3
|
2.9--6.2
|
|
New York City, NY
|
7.9
|
6.6--9.6
|
9.0
|
7.7--10.4
|
8.4
|
7.3--9.8
|
|
2.2
|
1.6--2.9
|
2.7
|
2.1--3.6
|
2.4
|
2.0--2.9
|
|
Orange County, FL
|
13.8
|
10.8--17.4
|
16.2
|
12.9--20.2
|
15.0
|
12.7--17.5
|
|
4.0
|
2.3--6.8
|
5.8
|
4.0--8.5
|
4.9
|
3.6--6.6
|
|
Palm Beach County, FL
|
13.4
|
11.3--15.9
|
16.8
|
14.2--19.9
|
15.4
|
13.6--17.3
|
|
4.5
|
3.1--6.4
|
6.2
|
4.8--8.1
|
5.6
|
4.5--6.8
|
|
Philadelphia, PA
|
11.9
|
9.6--14.8
|
9.3
|
6.3--13.5
|
10.8
|
8.7--13.3
|
|
2.8
|
1.9--4.3
|
4.0
|
2.4--6.6
|
3.6
|
2.5--5.0
|
|
San Bernardino, CA
|
9.7
|
7.5--12.3
|
20.9
|
17.3--25.0
|
15.2
|
13.1--17.7
|
|
1.8
|
1.1--3.0
|
5.5
|
3.9--7.6
|
3.6
|
2.7--4.8
|
|
San Diego, CA
|
9.3
|
7.0--12.2
|
14.0
|
10.9--17.9
|
11.7
|
9.5--14.4
|
|
2.0
|
1.1--3.7
|
3.6
|
2.4--5.3
|
2.8
|
1.9--4.0
|
|
San Francisco, CA
|
8.6
|
7.2--10.3
|
12.1
|
10.2--14.3
|
10.4
|
9.1--11.9
|
|
2.6
|
1.6--4.1
|
3.7
|
2.6--5.3
|
3.1
|
2.4--4.2
|
|
Seattle, WA
|
9.6
|
7.4--12.4
|
12.1
|
9.8--14.8
|
11.1
|
9.5--13.1
|
|
2.4
|
1.4--4.0
|
4.0
|
2.8--5.7
|
3.4
|
2.6--4.4
|
|
Median
|
9.8
|
13.9
|
11.5
|
|
2.4
|
4.0
|
3.4
|
|
Range
|
3.3--13.8
|
8.7--20.9
|
5.9--15.4
|
|
0.6--4.5
|
2.2--8.7
|
1.5--6.4
|
|
|
Smoked more than 10 cigarettes/day
|
|
Tried to quit smoking cigarettes
|
|
|
Female
|
Male
|
Total
|
|
Female
|
Male
|
Total
|
|
Category
|
%
|
CI§
|
%
|
CI
|
%
|
CI
|
|
%
|
CI
|
%
|
CI
|
%
|
CI
|
|
Race/Ethnicity
|
|
|
|
|
|
|
|
|
|
|
|
|
|
|
White¶
|
4.3
|
2.9--6.2
|
11.0
|
8.6--13.9
|
7.8
|
6.3--9.6
|
|
53.2
|
47.3--58.9
|
47.0
|
41.9--52.2
|
49.9
|
45.4--54.4
|
|
Black¶
|
1.3
|
0.2--8.9
|
9.3
|
3.9--20.5
|
5.7
|
2.6--12.2
|
|
---**
|
---
|
36.5
|
28.4--45.4
|
45.2
|
38.0--52.6
|
|
Hispanic
|
4.4
|
2.3--8.2
|
7.9
|
5.4--11.3
|
6.4
|
4.7--8.6
|
|
54.8
|
47.3--62.1
|
52.2
|
46.6--57.7
|
53.3
|
48.1--58.4
|
|
Grade
|
|
|
|
|
|
|
|
|
|
|
|
|
|
|
9
|
3.7
|
1.7--8.1
|
12.4
|
8.2--18.3
|
8.0
|
5.5--11.4
|
|
53.5
|
46.3--60.6
|
43.6
|
35.8--51.7
|
48.7
|
42.8--54.7
|
|
10
|
2.7
|
1.4--5.3
|
9.7
|
7.0--13.4
|
6.2
|
4.5--8.6
|
|
57.3
|
48.4--65.8
|
51.0
|
44.1--57.8
|
54.0
|
48.7--59.3
|
|
11
|
3.9
|
2.0--7.3
|
11.7
|
8.5--16.0
|
8.1
|
6.4--10.4
|
|
51.6
|
45.0--58.2
|
42.1
|
35.8--48.8
|
46.5
|
41.5--51.6
|
|
12
|
5.4
|
3.4--8.7
|
10.8
|
7.3--15.6
|
8.5
|
6.2--11.4
|
|
54.5
|
48.1--60.7
|
53.6
|
46.1--60.9
|
54.0
|
47.7--60.1
|
|
Total
|
4.1
|
2.9--5.7
|
11.1
|
9.3--13.1
|
7.8
|
6.6--9.0
|
|
54.2
|
49.4--59.0
|
48.0
|
44.3--51.7
|
50.8
|
47.4--54.1
|
|
|
Smoked more than 10 cigarettes/day
|
|
Tried to quit smoking cigarettes
|
|
|
Female
|
Male
|
Total
|
|
Female
|
Male
|
Total
|
|
Site
|
%
|
CI§
|
%
|
CI
|
%
|
CI
|
|
%
|
CI
|
%
|
CI
|
%
|
CI
|
|
State surveys
|
|
|
|
|
|
|
|
|
|
|
|
|
|
|
Alabama
|
9.9
|
4.9--19.2
|
10.6
|
6.1--17.6
|
10.2
|
7.0--14.8
|
|
54.6
|
42.0--66.6
|
57.2
|
47.4--66.5
|
56.3
|
48.5--63.8
|
|
Alaska
|
2.0
|
0.5--8.1
|
---¶
|
---
|
5.3
|
2.7--10.3
|
|
---
|
---
|
---
|
---
|
58.2
|
49.3--66.6
|
|
Arizona
|
2.9
|
1.3--6.6
|
7.0
|
4.2--11.6
|
5.2
|
3.1--8.4
|
|
55.8
|
47.1--64.2
|
48.5
|
41.8--55.2
|
51.1
|
45.2--56.9
|
|
Arkansas
|
8.2
|
4.7--14.0
|
14.2
|
9.3--21.1
|
10.9
|
7.5--15.6
|
|
63.0
|
51.8--73.0
|
46.6
|
36.0--57.5
|
55.3
|
48.1--62.3
|
|
Colorado
|
6.2
|
2.3--15.4
|
15.0
|
9.3--23.3
|
10.7
|
6.8--16.2
|
|
60.6
|
49.1--71.0
|
46.4
|
35.9--57.3
|
53.2
|
45.6--60.8
|
|
Connecticut
|
---
|
---
|
---
|
---
|
---
|
---
|
|
---
|
---
|
---
|
---
|
---
|
---
|
|
Delaware
|
10.6
|
6.3--17.5
|
15.5
|
11.2--21.1
|
13.7
|
10.3--18.1
|
|
51.4
|
42.3--60.3
|
43.8
|
36.1--51.7
|
47.4
|
40.3--54.5
|
|
Florida
|
---
|
---
|
---
|
---
|
---
|
---
|
|
50.3
|
43.9--56.6
|
37.7
|
32.8--43.0
|
43.7
|
39.5--48.0
|
|
Georgia
|
4.0
|
1.5--10.2
|
8.9
|
4.9--15.6
|
6.7
|
3.9--11.5
|
|
55.4
|
44.1--66.1
|
57.0
|
47.0--66.5
|
56.3
|
50.1--62.3
|
|
Hawaii
|
---
|
---
|
---
|
---
|
---
|
---
|
|
66.2
|
53.2--77.1
|
---
|
---
|
67.4
|
60.0--74.1
|
|
Idaho
|
1.8
|
0.4--7.7
|
9.7
|
4.5--19.7
|
6.0
|
3.0--11.4
|
|
63.3
|
54.8--71.1
|
56.3
|
48.6--63.8
|
59.7
|
54.5--64.7
|
|
Illinois
|
8.0
|
4.0--15.4
|
14.1
|
8.0--23.8
|
12.2
|
7.5--19.1
|
|
49.8
|
40.8--58.7
|
42.3
|
33.7--51.5
|
44.8
|
37.9--52.0
|
|
Indiana
|
7.7
|
4.4--13.1
|
12.5
|
7.6--19.9
|
10.1
|
7.1--14.2
|
|
65.9
|
60.0--71.3
|
54.1
|
48.0--60.1
|
59.5
|
54.9--63.9
|
|
Kansas
|
7.4
|
3.2--16.0
|
11.8
|
6.4--20.6
|
9.7
|
6.3--14.8
|
|
52.3
|
42.9--61.6
|
50.0
|
39.8--60.3
|
51.1
|
44.3--57.8
|
|
Kentucky
|
8.5
|
4.3--15.9
|
17.9
|
12.9--24.3
|
13.8
|
10.1--18.6
|
|
65.1
|
56.2--73.0
|
50.7
|
44.1--57.4
|
57.1
|
50.7--63.2
|
|
Louisiana
|
---
|
---
|
---
|
---
|
6.8
|
3.8--11.8
|
|
---
|
---
|
---
|
---
|
58.7
|
38.9--76.1
|
|
Maine
|
11.8
|
9.4--14.8
|
22.4
|
19.3--25.8
|
17.6
|
15.5--19.9
|
|
---
|
---
|
---
|
---
|
---
|
---
|
|
Maryland
|
---
|
---
|
---
|
---
|
9.0
|
3.9--19.2
|
|
---
|
---
|
---
|
---
|
51.6
|
41.9--61.2
|
|
Massachusetts
|
---
|
---
|
---
|
---
|
---
|
---
|
|
58.1
|
49.5--66.1
|
57.2
|
50.0--64.2
|
57.7
|
53.0--62.2
|
|
Michigan
|
6.6
|
3.8--11.2
|
12.7
|
8.9--17.7
|
9.7
|
7.2--13.0
|
|
55.7
|
48.3--62.7
|
51.5
|
44.6--58.4
|
53.6
|
48.1--59.0
|
|
Mississippi
|
2.2
|
0.7--7.3
|
9.0
|
5.9--13.6
|
6.1
|
4.2--8.6
|
|
58.6
|
49.4--67.2
|
56.3
|
48.7--63.6
|
57.4
|
50.6--63.9
|
|
Missouri
|
5.9
|
3.2--10.6
|
16.2
|
8.8--27.8
|
11.0
|
6.9--17.3
|
|
54.5
|
40.5--67.9
|
51.4
|
44.2--58.6
|
53.1
|
45.4--60.7
|
|
Montana
|
2.4
|
0.8--7.0
|
5.7
|
3.4--9.6
|
4.0
|
2.3--6.9
|
|
52.9
|
43.6--62.0
|
56.2
|
46.4--65.5
|
54.6
|
47.7--61.2
|
|
Nevada
|
4.9
|
2.4--9.8
|
10.4
|
6.1--17.1
|
7.9
|
5.2--11.9
|
|
---
|
---
|
---
|
---
|
---
|
---
|
|
New Hampshire
|
---
|
---
|
---
|
---
|
---
|
---
|
|
---
|
---
|
---
|
---
|
---
|
---
|
|
New Jersey
|
2.7
|
0.7--9.9
|
7.7
|
3.4--16.6
|
5.7
|
2.7--11.5
|
|
---
|
---
|
---
|
---
|
---
|
---
|
|
New Mexico
|
2.8
|
1.3--6.0
|
6.8
|
4.4--10.4
|
4.8
|
3.1--7.4
|
|
47.4
|
41.2--53.7
|
49.0
|
41.6--56.5
|
48.1
|
43.7--52.6
|
|
New York
|
6.9
|
3.1--14.7
|
16.4
|
9.5--26.9
|
13.3
|
8.1--21.1
|
|
43.3
|
35.6--51.3
|
35.8
|
28.2--44.2
|
38.8
|
33.1--44.9
|
|
North Carolina
|
---
|
---
|
---
|
---
|
---
|
---
|
|
61.3
|
52.6--69.4
|
52.5
|
45.1--59.8
|
56.2
|
49.9--62.4
|
|
North Dakota
|
---
|
---
|
---
|
---
|
---
|
---
|
|
55.6
|
44.2--66.4
|
50.8
|
43.0--58.6
|
53.2
|
46.6--59.6
|
|
Oklahoma
|
5.0
|
2.1--11.8
|
13.8
|
8.1--22.6
|
9.5
|
5.7--15.4
|
|
47.9
|
37.2--58.8
|
55.8
|
45.6--65.4
|
51.7
|
43.6--59.7
|
|
Pennsylvania
|
4.8
|
2.4--9.3
|
12.7
|
9.3--17.1
|
8.8
|
6.3--12.1
|
|
47.5
|
41.2--53.8
|
45.1
|
34.7--56.0
|
46.3
|
40.0--52.7
|
|
Rhode Island
|
2.9
|
1.1--7.5
|
11.9
|
6.9--19.6
|
7.3
|
4.1--12.7
|
|
50.8
|
39.7--61.8
|
42.2
|
35.2--49.6
|
46.3
|
40.6--52.1
|
|
South Carolina
|
8.1
|
3.8--16.7
|
10.3
|
5.1--19.6
|
9.2
|
5.4--15.3
|
|
54.2
|
43.1--64.8
|
60.2
|
51.4--68.3
|
57.3
|
50.0--64.3
|
|
South Dakota
|
5.7
|
2.4--13.2
|
12.6
|
6.6--22.7
|
9.3
|
5.4--15.6
|
|
61.8
|
51.5--71.1
|
55.1
|
44.3--65.4
|
58.4
|
51.0--65.4
|
|
Tennessee
|
8.8
|
5.4--14.0
|
13.6
|
8.7--20.7
|
11.4
|
8.8--14.7
|
|
53.5
|
44.5--62.2
|
45.6
|
39.9--51.5
|
48.8
|
44.0--53.6
|
|
Texas
|
1.9
|
0.9--4.0
|
6.0
|
4.2--8.7
|
4.3
|
3.0--6.1
|
|
45.9
|
37.8--54.2
|
48.3
|
43.1--53.6
|
47.3
|
42.7--52.0
|
|
Utah
|
---
|
---
|
---
|
---
|
9.8
|
5.7--16.4
|
|
---
|
---
|
---
|
---
|
43.1
|
33.3--53.6
|
|
Vermont
|
9.1
|
6.8--11.9
|
17.3
|
15.1--19.7
|
13.4
|
11.6--15.3
|
|
---
|
---
|
---
|
---
|
---
|
---
|
|
West Virginia
|
10.0
|
6.3--15.6
|
15.5
|
9.7--24.0
|
12.9
|
9.2--17.9
|
|
53.7
|
46.6--60.8
|
48.6
|
41.6--55.7
|
51.2
|
45.9--56.5
|
|
Wisconsin
|
3.1
|
1.3--7.3
|
8.9
|
5.2--14.8
|
6.2
|
3.7--10.2
|
|
58.5
|
49.8--66.7
|
46.7
|
39.9--53.5
|
51.9
|
46.2--57.6
|
|
Wyoming
|
9.1
|
6.1--13.5
|
17.0
|
13.2--21.7
|
13.4
|
10.8--16.6
|
|
60.3
|
53.9--66.5
|
51.0
|
45.4--56.6
|
55.3
|
51.0--59.6
|
|
Median
|
6.0
|
12.6
|
9.5
|
|
55.0
|
50.7
|
53.2
|
|
Range
|
1.8--11.8
|
5.7--22.4
|
4.0--17.6
|
|
43.3--66.2
|
35.8--60.2
|
38.8--67.4
|
|
Local surveys
|
|
|
|
|
|
|
|
|
|
|
|
|
|
|
Boston, MA
|
---
|
---
|
---
|
---
|
---
|
---
|
|
---
|
---
|
---
|
---
|
55.7
|
45.9--65.0
|
|
Broward County, FL
|
---
|
---
|
---
|
---
|
15.2
|
8.8--25.0
|
|
38.0
|
28.0--49.1
|
36.2
|
26.7--46.9
|
36.9
|
31.0--43.2
|
|
Charlotte-Mecklenburg, NC
|
4.7
|
1.9--11.2
|
11.1
|
6.0--19.7
|
8.2
|
4.8--13.8
|
|
56.2
|
44.0--67.7
|
53.4
|
43.6--63.0
|
54.8
|
47.9--61.5
|
|
Chicago, IL
|
---
|
---
|
---
|
---
|
5.1
|
2.1--11.7
|
|
---
|
---
|
---
|
---
|
49.7
|
41.5--58.0
|
|
Clark County, NV
|
4.5
|
1.7--11.4
|
---
|
---
|
8.9
|
5.2--14.8
|
|
---
|
---
|
---
|
---
|
---
|
---
|
|
Dallas, TX
|
---
|
---
|
---
|
---
|
1.6
|
0.4--6.6
|
|
---
|
---
|
---
|
---
|
65.0
|
55.5--73.5
|
|
Detroit, MI
|
---
|
---
|
---
|
---
|
---
|
---
|
|
---
|
---
|
---
|
---
|
---
|
---
|
|
Duval County, FL
|
---
|
---
|
---
|
---
|
---
|
---
|
|
45.9
|
36.8--55.3
|
40.5
|
33.8--47.5
|
43.2
|
37.7--48.8
|
|
Los Angeles, CA
|
---
|
---
|
---
|
---
|
6.1
|
3.7--9.9
|
|
---
|
---
|
---
|
---
|
43.7
|
38.2--49.2
|
|
Memphis, TN
|
---
|
---
|
---
|
---
|
---
|
---
|
|
---
|
---
|
---
|
---
|
---
|
---
|
|
Miami-Dade County, FL
|
---
|
---
|
---
|
---
|
---
|
---
|
|
45.5
|
36.2--55.1
|
40.8
|
32.8--49.4
|
43.5
|
37.3--49.8
|
|
Milwaukee, WI
|
---
|
---
|
6.8
|
2.8--15.4
|
7.9
|
3.2--18.0
|
|
---
|
---
|
50.1
|
38.9--61.4
|
53.1
|
45.3--60.8
|
|
New York City, NY
|
5.3
|
2.8--9.7
|
11.2
|
6.4--18.9
|
8.2
|
5.7--11.5
|
|
56.5
|
48.4--64.2
|
54.6
|
47.8--61.3
|
55.6
|
50.0--61.1
|
|
Orange County, FL
|
---
|
---
|
---
|
---
|
8.9
|
5.2--14.7
|
|
---
|
---
|
---
|
---
|
51.5
|
42.8--60.2
|
|
Palm Beach County, FL
|
8.9
|
4.5--16.7
|
19.2
|
13.4--26.7
|
14.8
|
10.7--20.1
|
|
48.6
|
38.5--58.8
|
42.0
|
34.3--50.0
|
44.4
|
37.9--51.2
|
|
Philadelphia, PA
|
---
|
---
|
---
|
---
|
6.5
|
2.3--17.0
|
|
---
|
---
|
---
|
---
|
61.6
|
52.3--70.1
|
|
San Bernardino, CA
|
---
|
---
|
10.3
|
5.0--19.8
|
8.4
|
4.6--14.7
|
|
---
|
---
|
42.1
|
33.6--51.1
|
45.3
|
37.7--53.0
|
|
San Diego, CA
|
---
|
---
|
5.6
|
2.6--11.8
|
4.7
|
2.4--9.1
|
|
---
|
---
|
51.6
|
41.3--61.7
|
51.0
|
43.5--58.4
|
|
San Francisco, CA
|
---
|
---
|
7.0
|
3.5--13.8
|
7.6
|
4.1--13.8
|
|
---
|
---
|
49.3
|
39.8--58.8
|
53.9
|
46.0--61.7
|
|
Seattle, WA
|
---
|
---
|
6.3
|
2.8--13.7
|
5.0
|
2.6--9.5
|
|
---
|
---
|
55.4
|
45.3--65.0
|
53.9
|
45.9--61.7
|
|
Median
|
5.0
|
8.6
|
7.9
|
|
47.2
|
49.3
|
51.5
|
|
Range
|
4.5--8.9
|
5.6--19.2
|
1.6--15.2
|
|
38.0--56.5
|
36.2--55.4
|
36.9--65.0
|
|
|
Bought cigarettes in a store or gas station
|
|
Current smokeless tobacco use
|
|
|
Female
|
Male
|
Total
|
|
Female
|
Male
|
Total
|
|
Category
|
%
|
CI§
|
%
|
CI
|
%
|
CI
|
|
%
|
CI
|
%
|
CI
|
%
|
CI
|
|
Race/Ethnicity
|
|
|
|
|
|
|
|
|
|
|
|
|
|
|
White¶
|
8.8
|
5.9--13.0
|
19.0
|
15.5--23.2
|
14.1
|
11.3--17.5
|
|
2.3
|
1.7--3.2
|
20.1
|
15.8--25.4
|
11.9
|
9.5--14.6
|
|
Black¶
|
---**
|
---
|
24.8
|
14.7--38.8
|
19.7
|
12.5--29.8
|
|
1.3
|
0.8--2.3
|
5.2
|
3.7--7.4
|
3.3
|
2.3--4.6
|
|
Hispanic
|
11.5
|
6.6--19.2
|
15.0
|
10.1--21.7
|
13.3
|
9.3--18.6
|
|
2.6
|
1.9--3.5
|
7.5
|
5.7--9.8
|
5.1
|
4.1--6.3
|
|
Grade
|
|
|
|
|
|
|
|
|
|
|
|
|
|
|
9
|
3.5
|
1.7--7.0
|
11.0
|
6.9--17.0
|
7.1
|
4.6--10.7
|
|
3.2
|
2.3--4.4
|
10.7
|
8.2--13.7
|
7.2
|
5.7--9.0
|
|
10
|
9.8
|
6.2--15.3
|
16.8
|
12.8--21.7
|
13.4
|
10.0--17.6
|
|
1.8
|
1.1--2.8
|
13.9
|
10.5--18.2
|
8.1
|
6.3--10.5
|
|
11
|
12.0
|
7.4--18.8
|
18.8
|
14.5--23.9
|
15.8
|
11.9--20.7
|
|
2.0
|
1.3--3.1
|
18.9
|
15.4--23.0
|
10.7
|
8.7--13.1
|
|
12
|
14.9
|
10.0--21.5
|
32.7
|
24.7--41.8
|
23.8
|
18.8--29.8
|
|
1.7
|
1.2--2.5
|
18.1
|
13.6--23.7
|
10.0
|
7.6--13.1
|
|
Total
|
9.6
|
6.9--13.2
|
18.3
|
15.6--21.5
|
14.1
|
11.7--17.0
|
|
2.2
|
1.8--2.7
|
15.0
|
12.1--18.5
|
8.9
|
7.3--10.8
|
|
|
Bought cigarettes in a store or gas station
|
|
Current smokeless tobacco use
|
|
|
Female
|
Male
|
Total
|
|
Female
|
Male
|
Total
|
|
Site
|
%
|
CI§
|
%
|
CI
|
%
|
CI
|
|
%
|
CI
|
%
|
CI
|
%
|
CI
|
|
State surveys
|
|
|
|
|
|
|
|
|
|
|
|
|
|
|
Alabama
|
14.9
|
8.6--24.5
|
26.7
|
17.1--39.2
|
21.4
|
14.9--29.7
|
|
3.9
|
2.8--5.5
|
20.5
|
16.6--25.1
|
12.4
|
10.2--15.0
|
|
Alaska
|
---¶
|
---
|
---
|
---
|
5.1
|
2.4--10.4
|
|
7.4
|
4.9--10.9
|
19.3
|
15.3--24.0
|
13.6
|
10.7--17.1
|
|
Arizona
|
13.1
|
6.9--23.5
|
22.6
|
14.7--33.0
|
18.8
|
12.2--27.8
|
|
2.8
|
1.7--4.6
|
10.7
|
8.4--13.5
|
6.9
|
5.3--8.9
|
|
Arkansas
|
14.4
|
8.1--24.3
|
23.1
|
13.8--36.1
|
18.6
|
12.5--26.7
|
|
4.9
|
3.0--7.8
|
19.9
|
15.9--24.5
|
12.4
|
9.9--15.6
|
|
Colorado
|
10.3
|
4.1--23.3
|
---
|
---
|
12.6
|
6.4--23.3
|
|
4.2
|
2.8--6.2
|
16.8
|
12.5--22.3
|
10.7
|
8.2--13.9
|
|
Connecticut
|
---
|
---
|
---
|
---
|
---
|
---
|
|
---
|
---
|
---
|
---
|
---
|
---
|
|
Delaware
|
12.3
|
7.9--18.5
|
25.8
|
18.8--34.4
|
19.7
|
15.0--25.4
|
|
2.8
|
2.0--3.9
|
10.4
|
8.4--12.8
|
6.8
|
5.6--8.1
|
|
Florida
|
9.4
|
6.2--13.8
|
26.3
|
20.8--32.7
|
17.9
|
14.6--21.8
|
|
2.3
|
1.8--2.9
|
11.6
|
9.9--13.5
|
7.1
|
6.1--8.2
|
|
Georgia
|
8.3
|
5.0--13.5
|
25.2
|
17.2--35.2
|
17.2
|
12.5--23.1
|
|
2.6
|
1.7--4.2
|
14.4
|
11.6--17.8
|
8.5
|
6.7--10.6
|
|
Hawaii
|
---
|
---
|
---
|
---
|
---
|
---
|
|
1.9
|
1.1--3.3
|
7.6
|
5.1--11.0
|
4.9
|
3.5--6.9
|
|
Idaho
|
1.2
|
0.3--5.3
|
7.1
|
3.4--14.0
|
4.5
|
2.4--8.0
|
|
3.0
|
2.0--4.4
|
15.4
|
12.2--19.2
|
9.4
|
7.4--11.8
|
|
Illinois
|
11.8
|
6.4--20.9
|
22.8
|
15.1--32.9
|
18.5
|
12.7--26.2
|
|
3.1
|
2.0--4.9
|
12.9
|
10.5--15.8
|
8.3
|
6.8--10.1
|
|
Indiana
|
8.9
|
4.0--18.6
|
23.6
|
17.1--31.7
|
16.2
|
11.5--22.2
|
|
3.2
|
1.9--5.3
|
17.9
|
15.2--21.0
|
10.7
|
9.0--12.5
|
|
Kansas
|
8.7
|
3.8--18.5
|
14.0
|
8.5--22.0
|
11.4
|
7.0--18.0
|
|
2.4
|
1.5--3.8
|
13.6
|
11.3--16.2
|
8.1
|
6.7--9.7
|
|
Kentucky
|
10.7
|
6.7--16.7
|
13.9
|
8.0--23.1
|
12.5
|
8.0--19.0
|
|
3.3
|
1.9--5.8
|
24.7
|
21.2--28.6
|
14.2
|
11.9--16.8
|
|
Louisiana
|
---
|
---
|
---
|
---
|
22.7
|
9.4--45.6
|
|
2.9
|
2.0--4.3
|
16.8
|
12.1--22.9
|
9.6
|
6.6--13.9
|
|
Maine
|
---
|
---
|
---
|
---
|
---
|
---
|
|
3.3
|
2.7--3.9
|
13.4
|
12.3--14.5
|
8.6
|
7.9--9.3
|
|
Maryland
|
---
|
---
|
---
|
---
|
26.1
|
18.4--35.7
|
|
2.0
|
0.9--4.3
|
8.4
|
6.8--10.4
|
5.4
|
4.1--7.1
|
|
Massachusetts
|
---
|
---
|
---
|
---
|
---
|
---
|
|
1.8
|
1.1--2.9
|
13.9
|
11.2--17.1
|
7.9
|
6.3--9.9
|
|
Michigan
|
9.7
|
4.8--18.3
|
21.2
|
13.8--31.1
|
15.2
|
10.2--22.1
|
|
5.6
|
4.4--7.1
|
15.3
|
12.7--18.3
|
10.6
|
9.2--12.2
|
|
Mississippi
|
16.4
|
11.3--23.1
|
21.0
|
14.8--28.9
|
18.8
|
14.3--24.3
|
|
1.2
|
0.6--2.6
|
16.0
|
12.7--19.8
|
8.6
|
6.9--10.8
|
|
Missouri
|
3.6
|
1.3--9.6
|
16.9
|
10.8--25.4
|
9.7
|
6.3--14.8
|
|
2.0
|
1.0--4.0
|
16.3
|
12.4--21.1
|
9.3
|
7.0--12.2
|
|
Montana
|
4.2
|
1.6--10.6
|
11.0
|
5.0--22.3
|
7.5
|
4.1--13.2
|
|
4.3
|
2.9--6.3
|
24.1
|
18.9--30.2
|
14.6
|
11.6--18.1
|
|
Nevada
|
7.3
|
3.4--15.1
|
18.5
|
10.4--30.7
|
13.4
|
8.4--20.7
|
|
2.0
|
1.3--3.2
|
8.8
|
6.8--11.3
|
5.5
|
4.4--6.9
|
|
New Hampshire
|
---
|
---
|
---
|
---
|
---
|
---
|
|
2.6
|
1.3--5.2
|
13.8
|
11.3--16.8
|
8.4
|
6.6--10.7
|
|
New Jersey
|
---
|
---
|
---
|
---
|
---
|
---
|
|
---
|
---
|
---
|
---
|
---
|
---
|
|
New Mexico
|
7.3
|
3.5--14.4
|
13.2
|
8.1--20.7
|
10.3
|
6.1--16.8
|
|
4.9
|
3.7--6.6
|
18.3
|
15.1--22.1
|
11.8
|
9.9--14.0
|
|
New York
|
---
|
---
|
---
|
---
|
---
|
---
|
|
2.2
|
1.3--3.6
|
12.2
|
9.9--14.9
|
7.5
|
6.0--9.3
|
|
North Carolina
|
---
|
---
|
---
|
---
|
---
|
---
|
|
---
|
---
|
---
|
---
|
---
|
---
|
|
North Dakota
|
2.9
|
1.1--7.5
|
13.5
|
8.2--21.4
|
8.4
|
5.1--13.4
|
|
6.8
|
4.1--11.2
|
23.2
|
20.0--26.7
|
15.3
|
13.1--17.8
|
|
Oklahoma
|
13.5
|
7.5--23.3
|
26.4
|
15.7--41.0
|
19.5
|
12.6--29.0
|
|
1.9
|
1.0--3.4
|
18.8
|
14.2--24.5
|
10.5
|
7.9--13.7
|
|
Pennsylvania
|
12.1
|
6.8--20.8
|
14.9
|
9.9--21.8
|
13.5
|
8.9--19.9
|
|
2.0
|
1.2--3.3
|
12.9
|
9.1--18.1
|
7.6
|
5.5--10.3
|
|
Rhode Island
|
20.8
|
15.2--27.7
|
29.3
|
17.2--45.2
|
25.0
|
19.1--32.1
|
|
2.5
|
1.8--3.5
|
9.5
|
7.5--12.0
|
6.1
|
4.9--7.7
|
|
South Carolina
|
---
|
---
|
---
|
---
|
17.8
|
11.4--26.7
|
|
2.2
|
0.9--5.1
|
18.8
|
13.7--25.2
|
10.4
|
7.9--13.6
|
|
South Dakota
|
5.6
|
2.0--14.3
|
7.9
|
4.4--13.8
|
6.7
|
3.7--11.8
|
|
5.5
|
3.4--8.9
|
23.4
|
19.1--28.5
|
14.6
|
12.1--17.6
|
|
Tennessee
|
8.7
|
4.7--15.4
|
18.7
|
13.0--26.2
|
14.5
|
9.9--20.6
|
|
2.9
|
1.9--4.3
|
21.3
|
16.4--27.3
|
12.2
|
9.3--15.9
|
|
Texas
|
6.4
|
3.5--11.2
|
18.6
|
13.9--24.5
|
13.3
|
10.4--16.8
|
|
2.1
|
1.4--3.2
|
12.4
|
9.7--15.6
|
7.4
|
6.1--8.8
|
|
Utah
|
---
|
---
|
---
|
---
|
7.2
|
3.5--14.4
|
|
1.9
|
1.0--3.6
|
8.7
|
5.5--13.4
|
5.5
|
3.7--8.0
|
|
Vermont
|
---
|
---
|
---
|
---
|
---
|
---
|
|
2.8
|
2.2--3.5
|
14.7
|
12.1--17.8
|
9.1
|
7.5--10.9
|
|
West Virginia
|
4.4
|
2.0--9.2
|
20.5
|
14.0--29.0
|
12.2
|
8.6--16.9
|
|
4.1
|
2.7--6.1
|
24.2
|
20.2--28.8
|
14.4
|
12.1--17.0
|
|
Wisconsin
|
---
|
---
|
---
|
---
|
---
|
---
|
|
3.5
|
2.5--4.9
|
13.1
|
10.9--15.6
|
8.5
|
7.2--10.0
|
|
Wyoming
|
10.0
|
6.4--15.2
|
18.5
|
13.5--24.8
|
14.5
|
11.1--18.7
|
|
6.9
|
5.5--8.6
|
24.7
|
21.8--27.9
|
16.2
|
14.3--18.3
|
|
Median
|
9.4
|
19.6
|
14.5
|
|
2.8
|
15.3
|
9.1
|
|
Range
|
1.2--20.8
|
7.1--29.3
|
4.5--26.1
|
|
1.2--7.4
|
7.6--24.7
|
4.9--16.2
|
|
Local surveys
|
|
|
|
|
|
|
|
|
|
|
|
|
|
|
Boston, MA
|
---
|
---
|
---
|
---
|
---
|
---
|
|
1.2
|
0.5--2.8
|
4.6
|
3.0--6.9
|
2.8
|
1.9--4.2
|
|
Broward County, FL
|
---
|
---
|
---
|
---
|
27.7
|
19.6--37.6
|
|
3.2
|
1.9--5.1
|
7.2
|
5.3--9.6
|
5.2
|
3.8--7.0
|
|
Charlotte-Mecklenburg, NC
|
---
|
---
|
---
|
---
|
15.9
|
11.0--22.5
|
|
1.2
|
0.7--2.1
|
8.5
|
6.4--11.3
|
4.8
|
3.6--6.4
|
|
Chicago, IL
|
---
|
---
|
---
|
---
|
27.9
|
16.4--43.3
|
|
3.7
|
1.9--7.2
|
5.5
|
3.6--8.2
|
5.3
|
3.6--7.7
|
|
Clark County, NV
|
---
|
---
|
---
|
---
|
15.9
|
9.5--25.6
|
|
1.3
|
0.7--2.5
|
6.9
|
4.5--10.4
|
4.2
|
2.9--6.1
|
|
Dallas, TX
|
---
|
---
|
---
|
---
|
---
|
---
|
|
1.0
|
0.4--2.8
|
4.9
|
3.1--7.7
|
3.1
|
2.1--4.5
|
|
Detroit, MI
|
---
|
---
|
---
|
---
|
---
|
---
|
|
4.7
|
3.2--6.8
|
10.1
|
7.2--13.9
|
7.4
|
5.6--9.8
|
|
Duval County, FL
|
14.2
|
8.6--22.7
|
25.0
|
17.2--35.0
|
20.1
|
15.1--26.3
|
|
4.7
|
3.4--6.7
|
12.8
|
10.4--15.8
|
9.2
|
7.4--11.3
|
|
Los Angeles, CA
|
---
|
---
|
---
|
---
|
11.4
|
6.9--18.3
|
|
1.6
|
0.8--2.9
|
4.8
|
3.1--7.3
|
3.2
|
2.3--4.6
|
|
Memphis, TN
|
---
|
---
|
---
|
---
|
---
|
---
|
|
2.0
|
1.0--4.0
|
3.8
|
2.4--5.9
|
2.8
|
1.9--4.3
|
|
Miami-Dade County, FL
|
29.3
|
19.4--41.7
|
31.0
|
24.0--39.1
|
30.2
|
24.2--37.0
|
|
1.7
|
1.0--2.9
|
5.2
|
3.7--7.3
|
3.5
|
2.5--4.8
|
|
Milwaukee, WI
|
---
|
---
|
---
|
---
|
---
|
---
|
|
---
|
---
|
---
|
---
|
---
|
---
|
|
New York City, NY
|
---
|
---
|
---
|
---
|
---
|
---
|
|
2.0
|
1.5--2.5
|
5.0
|
4.1--6.0
|
3.4
|
2.9--3.9
|
|
Orange County, FL
|
---
|
---
|
---
|
---
|
16.0
|
9.9--24.8
|
|
1.9
|
1.0--3.4
|
6.3
|
4.6--8.6
|
4.2
|
3.2--5.5
|
|
Palm Beach County, FL
|
14.1
|
8.0--23.6
|
20.6
|
13.4--30.4
|
17.7
|
12.8--23.9
|
|
2.0
|
1.2--3.1
|
8.3
|
6.6--10.4
|
5.2
|
4.2--6.4
|
|
Philadelphia, PA
|
---
|
---
|
---
|
---
|
34.5
|
24.4--46.4
|
|
2.5
|
1.2--4.9
|
3.8
|
1.9--7.5
|
3.2
|
1.8--5.7
|
|
San Bernardino, CA
|
---
|
---
|
---
|
---
|
11.7
|
7.4--18.0
|
|
2.7
|
1.8--4.1
|
4.9
|
3.4--7.0
|
3.8
|
2.8--5.1
|
|
San Diego, CA
|
---
|
---
|
11.3
|
6.2--19.6
|
10.9
|
7.1--16.6
|
|
1.8
|
0.9--3.7
|
3.0
|
1.9--4.8
|
2.4
|
1.6--3.8
|
|
San Francisco, CA
|
---
|
---
|
22.8
|
15.1--32.9
|
20.6
|
14.9--27.8
|
|
1.8
|
1.0--3.5
|
3.9
|
2.9--5.2
|
3.0
|
2.2--4.0
|
|
Seattle, WA
|
---
|
---
|
---
|
---
|
12.0
|
7.6--18.3
|
|
2.0
|
1.3--3.2
|
5.9
|
4.3--8.0
|
4.2
|
3.3--5.4
|
|
Median
|
14.2
|
22.8
|
16.8
|
|
2.0
|
5.2
|
3.8
|
|
Range
|
14.1--29.3
|
11.3--31.0
|
10.9--34.5
|
|
1.0--4.7
|
3.0--12.8
|
2.4--9.2
|
|
|
Current cigar use
|
|
Current tobacco use
|
|
|
Female
|
Male
|
Total
|
|
Female
|
Male
|
Total
|
|
Category
|
%
|
CI§
|
%
|
CI
|
%
|
CI
|
|
%
|
CI
|
%
|
CI
|
%
|
CI
|
|
Race/Ethnicity
|
|
|
|
|
|
|
|
|
|
|
|
|
|
|
White¶
|
8.0
|
6.8--9.3
|
21.0
|
18.7--23.4
|
14.9
|
13.3--16.7
|
|
24.9
|
22.4--27.7
|
35.1
|
31.0--39.4
|
30.3
|
27.4--33.4
|
|
Black¶
|
11.5
|
8.8--14.8
|
13.9
|
11.6--16.5
|
12.8
|
10.9--15.0
|
|
14.5
|
11.7--17.9
|
17.8
|
15.2--20.8
|
16.2
|
14.3--18.3
|
|
Hispanic
|
9.5
|
7.6--11.9
|
15.8
|
13.1--19.1
|
12.7
|
10.9--14.7
|
|
18.1
|
16.0--20.5
|
23.6
|
20.2--27.3
|
20.8
|
18.5--23.2
|
|
Grade
|
|
|
|
|
|
|
|
|
|
|
|
|
|
|
9
|
7.6
|
6.1--9.6
|
11.3
|
9.5--13.4
|
9.6
|
8.3--11.2
|
|
17.6
|
15.1--20.5
|
20.2
|
16.9--23.9
|
19.0
|
16.7--21.6
|
|
10
|
9.5
|
7.8--11.4
|
16.6
|
14.0--19.5
|
13.2
|
11.4--15.3
|
|
21.9
|
19.3--24.7
|
26.8
|
22.6--31.5
|
24.5
|
21.6--27.6
|
|
11
|
8.6
|
6.8--10.9
|
22.4
|
19.4--25.7
|
15.8
|
13.6--18.2
|
|
22.9
|
19.6--26.5
|
35.4
|
31.1--39.8
|
29.3
|
25.9--32.9
|
|
12
|
9.7
|
7.6--12.3
|
26.8
|
21.8--32.4
|
18.5
|
15.5--21.8
|
|
25.7
|
23.0--28.6
|
40.4
|
34.6--46.4
|
33.1
|
29.4--36.9
|
|
Total
|
8.8
|
7.7--10.1
|
18.6
|
17.0--20.5
|
14.0
|
12.8--15.4
|
|
21.8
|
19.9--23.9
|
29.8
|
27.0--32.8
|
26.0
|
23.8--28.3
|
|
|
Current cigar use
|
|
Current tobacco use
|
|
|
Female
|
Male
|
Total
|
|
Female
|
Male
|
Total
|
|
Site
|
%
|
CI§
|
%
|
CI
|
%
|
CI
|
|
%
|
CI
|
%
|
CI
|
%
|
CI
|
|
State surveys
|
|
|
|
|
|
|
|
|
|
|
|
|
|
|
Alabama
|
11.3
|
9.1--14.0
|
21.4
|
18.2--25.1
|
16.6
|
14.5--18.9
|
|
21.6
|
18.0--25.7
|
34.6
|
29.4--40.1
|
27.9
|
24.5--31.5
|
|
Alaska
|
6.2
|
4.7--8.2
|
13.7
|
10.8--17.4
|
10.3
|
8.6--12.3
|
|
21.5
|
18.0--25.3
|
28.6
|
23.7--33.9
|
25.2
|
21.8--28.8
|
|
Arizona
|
14.1
|
11.4--17.5
|
21.4
|
18.2--24.9
|
18.0
|
15.7--20.7
|
|
22.1
|
18.5--26.1
|
29.6
|
26.2--33.2
|
25.9
|
23.0--29.1
|
|
Arkansas
|
11.8
|
8.8--15.7
|
21.4
|
17.7--25.5
|
16.7
|
13.7--20.2
|
|
23.8
|
19.7--28.4
|
29.2
|
24.5--34.3
|
26.5
|
22.7--30.7
|
|
Colorado
|
11.4
|
8.9--14.6
|
21.0
|
16.6--26.1
|
16.3
|
13.4--19.8
|
|
21.6
|
16.6--27.5
|
31.3
|
25.4--38.0
|
26.5
|
21.5--32.2
|
|
Connecticut
|
---¶
|
---
|
---
|
---
|
---
|
---
|
|
---
|
---
|
---
|
---
|
---
|
---
|
|
Delaware
|
8.6
|
6.6--11.1
|
14.5
|
12.2--17.2
|
11.8
|
10.1--13.7
|
|
21.1
|
17.9--24.9
|
25.1
|
21.9--28.6
|
23.2
|
20.5--26.2
|
|
Florida
|
10.7
|
9.2--12.3
|
17.8
|
16.0--19.8
|
14.4
|
13.1--15.8
|
|
18.0
|
16.2--19.9
|
25.1
|
22.9--27.3
|
21.7
|
20.1--23.4
|
|
Georgia
|
9.7
|
8.1--11.7
|
17.6
|
15.4--20.1
|
13.7
|
12.6--14.9
|
|
19.0
|
15.5--23.2
|
28.3
|
24.7--32.1
|
23.4
|
20.9--26.1
|
|
Hawaii
|
---
|
---
|
---
|
---
|
---
|
---
|
|
---
|
---
|
---
|
---
|
---
|
---
|
|
Idaho
|
7.9
|
5.9--10.4
|
15.9
|
13.0--19.2
|
12.0
|
10.0--14.3
|
|
17.4
|
13.9--21.6
|
25.5
|
22.0--29.2
|
21.5
|
18.8--24.5
|
|
Illinois
|
7.9
|
5.7--10.9
|
19.7
|
16.1--23.8
|
14.1
|
12.3--16.1
|
|
17.8
|
14.8--21.2
|
30.5
|
25.6--35.8
|
24.3
|
21.4--27.4
|
|
Indiana
|
12.1
|
9.4--15.4
|
21.6
|
18.0--25.7
|
16.9
|
14.5--19.6
|
|
24.8
|
20.8--29.3
|
33.7
|
28.8--38.9
|
29.3
|
25.7--33.2
|
|
Kansas
|
8.6
|
7.0--10.5
|
16.7
|
13.6--20.3
|
12.7
|
10.6--15.2
|
|
17.8
|
14.6--21.5
|
27.1
|
23.3--31.2
|
22.5
|
19.6--25.6
|
|
Kentucky
|
9.5
|
7.5--12.0
|
24.6
|
21.2--28.4
|
17.2
|
15.0--19.6
|
|
24.9
|
19.7--31.1
|
42.0
|
37.8--46.3
|
33.5
|
29.5--37.7
|
|
Louisiana
|
8.4
|
6.9--10.3
|
19.5
|
14.2--26.2
|
14.0
|
10.5--18.3
|
|
19.1
|
15.9--22.7
|
26.0
|
19.5--33.8
|
22.3
|
18.0--27.2
|
|
Maine
|
10.0
|
9.0--11.1
|
19.1
|
17.9--20.5
|
14.9
|
14.0--15.8
|
|
18.6
|
17.1--20.1
|
26.6
|
25.1--28.3
|
22.8
|
21.6--24.0
|
|
Maryland
|
8.8
|
6.5--11.7
|
16.4
|
12.8--20.8
|
12.7
|
10.7--14.9
|
|
16.0
|
13.8--18.4
|
19.9
|
16.5--23.9
|
18.0
|
15.9--20.3
|
|
Massachusetts
|
7.7
|
6.3--9.4
|
22.0
|
18.8--25.5
|
14.9
|
12.9--17.2
|
|
16.9
|
14.1--20.2
|
30.7
|
27.1--34.6
|
23.9
|
21.1--26.9
|
|
Michigan
|
9.0
|
7.4--10.9
|
19.9
|
17.2--22.9
|
14.7
|
13.0--16.5
|
|
22.9
|
20.2--25.8
|
27.6
|
23.9--31.5
|
25.2
|
22.7--27.9
|
|
Mississippi
|
10.4
|
7.9--13.7
|
20.4
|
17.3--23.8
|
15.4
|
13.4--17.6
|
|
20.8
|
16.7--25.6
|
34.6
|
30.2--39.3
|
27.6
|
24.3--31.2
|
|
Missouri
|
10.5
|
7.7--14.1
|
16.3
|
14.0--18.9
|
13.5
|
11.5--15.8
|
|
22.2
|
18.4--26.5
|
28.8
|
23.5--34.7
|
25.5
|
21.7--29.8
|
|
Montana
|
11.6
|
9.2--14.4
|
23.7
|
20.5--27.1
|
17.8
|
16.0--19.8
|
|
25.2
|
21.2--29.6
|
37.2
|
31.7--43.0
|
31.3
|
27.1--35.8
|
|
Nevada
|
---
|
---
|
---
|
---
|
---
|
---
|
|
---
|
---
|
---
|
---
|
---
|
---
|
|
New Hampshire
|
9.7
|
6.8--13.6
|
22.1
|
18.9--25.7
|
16.1
|
13.9--18.7
|
|
23.8
|
19.4--28.8
|
33.8
|
29.3--38.5
|
28.9
|
25.5--32.6
|
|
New Jersey
|
---
|
---
|
---
|
---
|
---
|
---
|
|
---
|
---
|
---
|
---
|
---
|
---
|
|
New Mexico
|
13.7
|
12.3--15.3
|
22.3
|
19.0--26.0
|
18.1
|
16.2--20.1
|
|
26.7
|
24.4--29.1
|
34.9
|
30.9--39.2
|
30.8
|
28.1--33.7
|
|
New York
|
6.5
|
5.0--8.3
|
18.4
|
15.7--21.3
|
12.7
|
11.0--14.6
|
|
14.4
|
12.1--17.1
|
25.7
|
22.5--29.2
|
20.2
|
18.0--22.6
|
|
North Carolina
|
---
|
---
|
---
|
---
|
---
|
---
|
|
---
|
---
|
---
|
---
|
---
|
---
|
|
North Dakota
|
6.7
|
4.7--9.5
|
17.5
|
14.4--21.0
|
12.4
|
10.4--14.6
|
|
24.5
|
19.7--29.9
|
36.3
|
31.9--40.9
|
30.6
|
26.9--34.6
|
|
Oklahoma
|
11.2
|
7.7--16.0
|
16.9
|
13.0--21.7
|
14.1
|
10.8--18.1
|
|
24.5
|
18.8--31.3
|
34.3
|
28.1--41.1
|
29.5
|
24.1--35.5
|
|
Pennsylvania
|
6.4
|
4.6--8.8
|
17.7
|
14.1--21.9
|
12.2
|
10.2--14.5
|
|
20.6
|
15.8--26.4
|
27.6
|
23.6--32.0
|
24.1
|
20.2--28.5
|
|
Rhode Island
|
4.4
|
3.0--6.4
|
15.3
|
12.3--19.0
|
10.1
|
8.3--12.1
|
|
15.1
|
12.0--18.9
|
22.4
|
19.2--26.1
|
18.9
|
15.8--22.3
|
|
South Carolina
|
9.5
|
6.8--13.1
|
19.5
|
15.6--24.0
|
14.7
|
12.1--17.6
|
|
21.5
|
17.8--25.7
|
33.4
|
27.2--40.3
|
27.3
|
23.6--31.3
|
|
South Dakota
|
---
|
---
|
---
|
---
|
---
|
---
|
|
---
|
---
|
---
|
---
|
---
|
---
|
|
Tennessee
|
12.4
|
9.8--15.6
|
21.4
|
18.0--25.4
|
17.0
|
14.5--19.9
|
|
23.1
|
19.0--27.8
|
37.0
|
31.1--43.2
|
30.1
|
25.7--35.0
|
|
Texas
|
11.5
|
9.5--14.0
|
21.3
|
18.0--24.9
|
16.5
|
14.5--18.6
|
|
20.8
|
17.7--24.2
|
34.1
|
29.8--38.6
|
27.5
|
24.8--30.4
|
|
Utah
|
3.8
|
2.4--5.8
|
9.3
|
6.2--13.6
|
6.8
|
5.0--9.4
|
|
6.9
|
5.0--9.6
|
14.2
|
10.2--19.4
|
10.7
|
8.1--13.9
|
|
Vermont
|
7.4
|
5.8--9.4
|
19.3
|
16.3--22.7
|
13.7
|
11.6--16.0
|
|
20.0
|
17.9--22.4
|
29.9
|
26.8--33.3
|
25.3
|
22.9--27.8
|
|
West Virginia
|
8.7
|
6.5--11.5
|
19.2
|
16.6--22.1
|
14.3
|
12.4--16.4
|
|
25.6
|
21.6--30.1
|
33.4
|
29.1--38.0
|
29.5
|
26.1--33.2
|
|
Wisconsin
|
8.0
|
6.3--10.0
|
21.4
|
17.5--25.9
|
14.9
|
12.3--18.0
|
|
19.2
|
16.2--22.7
|
29.6
|
25.5--34.0
|
24.5
|
21.2--28.2
|
|
Wyoming
|
---
|
---
|
---
|
---
|
---
|
---
|
|
---
|
---
|
---
|
---
|
---
|
---
|
|
Median
|
9.5
|
19.5
|
14.4
|
|
21.1
|
29.6
|
25.3
|
|
Range
|
3.8--14.1
|
9.3--24.6
|
6.8--18.1
|
|
6.9--26.7
|
14.2--42.0
|
10.7--33.5
|
|
Local surveys
|
|
|
|
|
|
|
|
|
|
|
|
|
|
|
Boston, MA
|
5.2
|
3.7--7.2
|
11.0
|
8.4--14.3
|
8.1
|
6.4--10.2
|
|
11.1
|
8.5--14.5
|
15.4
|
9.7--23.4
|
13.1
|
9.5--17.8
|
|
Broward County, FL
|
6.7
|
5.0--9.0
|
15.6
|
12.5--19.2
|
11.1
|
9.2--13.5
|
|
14.3
|
11.7--17.5
|
19.7
|
16.8--23.1
|
16.9
|
14.6--19.5
|
|
Charlotte-Mecklenburg, NC
|
---
|
---
|
---
|
---
|
---
|
---
|
|
---
|
---
|
---
|
---
|
---
|
---
|
|
Chicago, IL
|
11.0
|
8.7--13.8
|
13.9
|
9.9--19.3
|
13.1
|
10.2--16.7
|
|
16.7
|
14.6--19.0
|
18.8
|
15.3--22.9
|
17.8
|
15.3--20.6
|
|
Clark County, NV
|
---
|
---
|
---
|
---
|
---
|
---
|
|
---
|
---
|
---
|
---
|
---
|
---
|
|
Dallas, TX
|
11.5
|
8.9--14.8
|
18.2
|
14.8--22.1
|
14.8
|
12.4--17.5
|
|
12.2
|
9.5--15.6
|
21.9
|
18.0--26.3
|
16.9
|
14.2--20.0
|
|
Detroit, MI
|
12.6
|
9.9--15.9
|
18.2
|
13.9--23.6
|
15.4
|
12.4--19.1
|
|
12.5
|
10.0--15.6
|
18.6
|
14.2--24.1
|
15.5
|
12.9--18.6
|
|
Duval County, FL
|
11.3
|
9.4--13.5
|
21.9
|
19.0--25.2
|
17.0
|
15.0--19.2
|
|
17.9
|
15.2--21.1
|
25.7
|
22.1--29.6
|
21.8
|
19.2--24.6
|
|
Los Angeles, CA
|
6.4
|
4.5--9.0
|
11.4
|
8.4--15.1
|
9.0
|
6.7--11.9
|
|
10.9
|
8.3--14.1
|
13.9
|
10.2--18.6
|
12.4
|
9.6--15.8
|
|
Memphis, TN
|
9.4
|
7.2--12.2
|
14.2
|
11.5--17.4
|
11.8
|
10.4--13.3
|
|
10.0
|
7.8--12.7
|
17.9
|
14.1--22.4
|
13.8
|
11.9--15.8
|
|
Miami-Dade County, FL
|
7.0
|
5.5--8.9
|
11.3
|
9.3--13.6
|
9.2
|
8.0--10.7
|
|
13.5
|
11.1--16.4
|
17.7
|
15.1--20.7
|
15.7
|
13.8--17.8
|
|
Milwaukee, WI
|
---
|
---
|
---
|
---
|
---
|
---
|
|
---
|
---
|
---
|
---
|
---
|
---
|
|
New York City, NY
|
4.3
|
3.6--5.1
|
7.6
|
6.5--8.8
|
5.9
|
5.1--6.7
|
|
9.1
|
7.7--10.8
|
11.5
|
10.1--13.0
|
10.2
|
9.0--11.6
|
|
Orange County, FL
|
9.2
|
7.1--11.9
|
17.2
|
14.0--21.1
|
13.3
|
11.3--15.6
|
|
16.3
|
12.8--20.5
|
22.0
|
18.2--26.2
|
19.1
|
16.6--21.9
|
|
Palm Beach County, FL
|
8.3
|
6.7--10.3
|
15.0
|
12.6--17.7
|
11.7
|
10.1--13.4
|
|
15.5
|
13.2--18.1
|
22.2
|
19.1--25.6
|
19.0
|
16.9--21.4
|
|
Philadelphia, PA
|
4.6
|
2.9--7.3
|
8.1
|
5.5--11.7
|
6.6
|
4.8--9.0
|
|
13.3
|
10.9--16.2
|
11.6
|
8.3--15.8
|
12.6
|
10.3--15.3
|
|
San Bernardino, CA
|
6.4
|
4.4--9.2
|
14.7
|
11.8--18.2
|
10.6
|
8.6--12.9
|
|
12.1
|
9.0--16.0
|
22.4
|
18.5--26.8
|
17.2
|
14.7--20.0
|
|
San Diego, CA
|
6.4
|
4.7--8.7
|
11.8
|
9.5--14.6
|
9.1
|
7.4--11.2
|
|
11.0
|
8.6--14.1
|
16.9
|
13.7--20.6
|
14.0
|
11.7--16.7
|
|
San Francisco, CA
|
4.2
|
3.0--6.0
|
7.9
|
6.3--9.9
|
6.1
|
5.2--7.2
|
|
9.8
|
8.1--11.8
|
14.1
|
11.8--16.7
|
12.0
|
10.4--13.8
|
|
Seattle, WA
|
6.2
|
4.7--8.1
|
13.9
|
11.5--16.7
|
10.3
|
8.9--12.1
|
|
11.0
|
8.6--14.0
|
17.0
|
14.2--20.4
|
14.3
|
12.2--16.6
|
|
Median
|
6.7
|
13.9
|
10.6
|
|
12.2
|
17.9
|
15.5
|
|
Range
|
4.2--12.6
|
7.6--21.9
|
5.9--17.0
|
|
9.1--17.9
|
11.5--25.7
|
10.2--21.8
|
|
|
Ever drank alcohol*
|
|
Current alcohol use†
|
|
|
Female
|
Male
|
Total
|
|
Female
|
Male
|
Total
|
|
Category
|
%
|
CI§
|
%
|
CI
|
%
|
CI
|
|
%
|
CI
|
%
|
CI
|
%
|
CI
|
|
Race/Ethnicity
|
|
|
|
|
|
|
|
|
|
|
|
|
|
|
White¶
|
75.6
|
73.1--77.9
|
72.2
|
68.2--76.0
|
73.8
|
70.8--76.6
|
|
45.9
|
43.6--48.3
|
43.6
|
40.3--47.1
|
44.7
|
42.4--47.1
|
|
Black¶
|
70.2
|
66.1--74.0
|
64.9
|
60.8--68.8
|
67.6
|
63.9--71.1
|
|
35.6
|
32.4--38.9
|
31.2
|
27.2--35.5
|
33.4
|
30.5--36.4
|
|
Hispanic
|
78.5
|
75.8--81.0
|
74.8
|
72.1--77.4
|
76.6
|
74.4--78.7
|
|
43.5
|
39.7--47.4
|
42.4
|
38.8--46.0
|
42.9
|
40.1--45.8
|
|
Grade
|
|
|
|
|
|
|
|
|
|
|
|
|
|
|
9
|
66.4
|
62.9--69.6
|
60.8
|
56.9--64.5
|
63.4
|
60.4--66.2
|
|
35.3
|
32.0--38.7
|
28.4
|
24.7--32.4
|
31.5
|
29.0--34.2
|
|
10
|
72.5
|
68.9--75.8
|
69.9
|
66.2--73.3
|
71.1
|
68.6--73.5
|
|
41.2
|
38.3--44.2
|
40.1
|
36.2--44.1
|
40.6
|
37.8--43.5
|
|
11
|
79.0
|
75.8--82.0
|
76.5
|
71.9--80.6
|
77.8
|
74.4--80.8
|
|
45.6
|
41.4--49.9
|
45.7
|
40.8--50.7
|
45.7
|
41.6--49.8
|
|
12
|
80.3
|
77.8--82.6
|
79.0
|
74.9--82.6
|
79.7
|
77.1--82.0
|
|
50.7
|
47.8--53.5
|
52.6
|
48.3--56.8
|
51.7
|
48.9--54.5
|
|
Total
|
74.2
|
72.4--76.0
|
70.8
|
68.4--73.2
|
72.5
|
70.6--74.3
|
|
42.9
|
41.2--44.6
|
40.8
|
38.6--43.0
|
41.8
|
40.2--43.4
|
|
|
Ever drank alcohol*
|
|
Current alcohol use†
|
|
|
Female
|
Male
|
Total
|
|
Female
|
Male
|
Total
|
|
Site
|
%
|
CI§
|
%
|
CI
|
%
|
CI
|
|
%
|
CI
|
%
|
CI
|
%
|
CI
|
|
State surveys
|
|
|
|
|
|
|
|
|
|
|
|
|
|
|
Alabama
|
69.2
|
64.4--73.6
|
64.3
|
60.5--67.9
|
66.8
|
63.5--69.9
|
|
39.7
|
34.0--45.7
|
39.0
|
34.2--44.0
|
39.5
|
34.9--44.2
|
|
Alaska
|
67.8
|
63.4--71.9
|
65.4
|
61.2--69.5
|
66.6
|
63.4--69.7
|
|
32.9
|
28.6--37.5
|
33.5
|
28.8--38.5
|
33.2
|
30.0--36.6
|
|
Arizona
|
---¶
|
---
|
---
|
---
|
---
|
---
|
|
43.4
|
40.3--46.5
|
45.3
|
40.2--50.5
|
44.5
|
41.1--47.9
|
|
Arkansas
|
71.4
|
65.9--76.4
|
69.5
|
64.2--74.3
|
70.4
|
66.5--74.1
|
|
40.6
|
36.6--44.7
|
38.9
|
33.8--44.2
|
39.7
|
35.9--43.7
|
|
Colorado
|
77.3
|
71.9--81.9
|
67.8
|
61.7--73.3
|
72.4
|
67.3--76.9
|
|
44.2
|
37.5--51.1
|
37.4
|
32.2--43.0
|
40.8
|
35.8--46.0
|
|
Connecticut
|
---
|
---
|
---
|
---
|
---
|
---
|
|
43.8
|
39.8--47.9
|
43.2
|
37.8--48.8
|
43.5
|
39.0--48.1
|
|
Delaware
|
73.7
|
70.5--76.6
|
68.5
|
65.2--71.6
|
71.0
|
68.8--73.1
|
|
46.2
|
42.3--50.2
|
41.3
|
36.9--45.9
|
43.7
|
40.4--47.0
|
|
Florida
|
---
|
---
|
---
|
---
|
---
|
---
|
|
41.3
|
38.7--44.1
|
39.9
|
37.5--42.4
|
40.5
|
38.5--42.6
|
|
Georgia
|
70.6
|
66.4--74.4
|
65.2
|
59.6--70.5
|
67.9
|
64.0--71.5
|
|
35.0
|
31.0--39.1
|
33.7
|
29.5--38.1
|
34.3
|
30.9--37.8
|
|
Hawaii
|
71.5
|
65.3--76.9
|
65.9
|
60.4--71.0
|
68.6
|
63.4--73.4
|
|
41.9
|
33.4--50.9
|
33.8
|
27.9--40.1
|
37.8
|
31.9--44.2
|
|
Idaho
|
63.3
|
58.8--67.7
|
61.6
|
57.2--65.9
|
62.5
|
58.5--66.3
|
|
34.3
|
29.9--39.0
|
33.9
|
29.6--38.6
|
34.2
|
30.3--38.3
|
|
Illinois
|
72.2
|
68.5--75.7
|
68.5
|
64.3--72.4
|
70.3
|
67.0--73.5
|
|
39.0
|
34.5--43.6
|
40.6
|
36.2--45.1
|
39.8
|
36.0--43.7
|
|
Indiana
|
72.2
|
66.6--77.1
|
66.3
|
61.7--70.5
|
69.2
|
65.2--73.0
|
|
39.7
|
34.3--45.3
|
37.2
|
32.4--42.3
|
38.5
|
34.2--43.0
|
|
Kansas
|
70.2
|
64.0--75.7
|
68.5
|
64.8--71.9
|
69.2
|
65.3--72.9
|
|
37.4
|
32.0--43.1
|
40.1
|
36.0--44.4
|
38.7
|
34.9--42.8
|
|
Kentucky
|
69.0
|
64.0--73.7
|
69.5
|
65.3--73.4
|
69.3
|
66.2--72.3
|
|
35.2
|
30.6--40.1
|
40.4
|
36.6--44.4
|
37.8
|
35.1--40.5
|
|
Louisiana
|
76.0
|
71.1--80.4
|
71.0
|
65.0--76.3
|
73.5
|
68.9--77.5
|
|
50.3
|
46.1--54.4
|
44.8
|
35.2--54.8
|
47.5
|
41.5--53.5
|
|
Maine
|
66.9
|
65.1--68.6
|
63.4
|
61.7--65.0
|
65.2
|
63.9--66.5
|
|
32.8
|
31.1--34.5
|
31.4
|
29.7--33.1
|
32.2
|
30.9--33.5
|
|
Maryland
|
69.3
|
65.0--73.3
|
65.0
|
60.1--69.6
|
67.2
|
63.5--70.8
|
|
39.4
|
36.5--42.4
|
34.4
|
29.9--39.3
|
37.0
|
34.0--40.1
|
|
Massachusetts
|
71.0
|
66.8--74.7
|
71.6
|
68.5--74.5
|
71.3
|
68.2--74.2
|
|
44.5
|
41.3--47.6
|
42.7
|
39.3--46.2
|
43.6
|
41.0--46.2
|
|
Michigan
|
70.5
|
66.6--74.2
|
67.0
|
63.1--70.6
|
68.8
|
65.8--71.7
|
|
37.9
|
34.1--41.7
|
36.0
|
32.5--39.5
|
37.0
|
34.4--39.7
|
|
Mississippi
|
70.8
|
66.6--74.7
|
69.3
|
64.6--73.6
|
70.0
|
66.6--73.2
|
|
37.6
|
34.0--41.3
|
40.7
|
36.5--45.1
|
39.2
|
36.2--42.2
|
|
Missouri
|
72.8
|
66.8--78.0
|
68.4
|
64.1--72.4
|
70.5
|
65.7--75.0
|
|
39.1
|
32.7--45.9
|
39.5
|
33.3--46.1
|
39.3
|
33.6--45.4
|
|
Montana
|
75.8
|
71.3--79.8
|
75.5
|
72.4--78.4
|
75.7
|
72.9--78.3
|
|
42.8
|
37.9--48.0
|
42.9
|
38.3--47.7
|
42.8
|
39.2--46.5
|
|
Nevada
|
74.5
|
70.9--77.8
|
71.8
|
67.7--75.6
|
73.2
|
70.2--76.0
|
|
38.7
|
35.1--42.6
|
38.6
|
34.3--43.1
|
38.6
|
35.4--42.0
|
|
New Hampshire
|
69.8
|
64.1--74.9
|
67.2
|
62.4--71.6
|
68.5
|
64.8--72.0
|
|
39.4
|
33.4--45.7
|
39.2
|
34.5--44.1
|
39.3
|
35.0--43.8
|
|
New Jersey
|
72.8
|
68.1--77.1
|
76.3
|
71.4--80.5
|
74.6
|
71.0--77.9
|
|
44.0
|
38.0--50.1
|
46.4
|
40.9--52.1
|
45.2
|
40.6--49.9
|
|
New Mexico
|
---
|
---
|
---
|
---
|
---
|
---
|
|
42.3
|
38.6--46.0
|
38.7
|
35.7--41.7
|
40.5
|
37.5--43.6
|
|
New York
|
---
|
---
|
---
|
---
|
---
|
---
|
|
40.3
|
37.2--43.5
|
42.0
|
38.1--46.1
|
41.4
|
38.7--44.2
|
|
North Carolina
|
---
|
---
|
---
|
---
|
---
|
---
|
|
32.4
|
26.8--38.4
|
37.8
|
33.5--42.4
|
35.0
|
30.4--40.0
|
|
North Dakota
|
73.4
|
69.3--77.1
|
71.2
|
67.0--75.1
|
72.3
|
69.1--75.2
|
|
42.7
|
38.3--47.2
|
44.0
|
39.5--48.6
|
43.3
|
39.8--46.9
|
|
Oklahoma
|
74.8
|
69.6--79.3
|
68.3
|
62.0--74.1
|
71.4
|
67.0--75.5
|
|
39.6
|
34.3--45.1
|
38.2
|
32.7--44.1
|
39.0
|
35.0--43.1
|
|
Pennsylvania
|
73.6
|
68.7--77.9
|
67.6
|
62.4--72.5
|
70.5
|
66.1--74.5
|
|
42.4
|
37.7--47.3
|
34.6
|
29.1--40.5
|
38.4
|
34.2--42.8
|
|
Rhode Island
|
66.4
|
62.2--70.4
|
61.3
|
56.8--65.7
|
63.9
|
59.9--67.7
|
|
35.6
|
31.6--39.7
|
32.2
|
27.8--36.9
|
34.0
|
29.9--38.3
|
|
South Carolina
|
71.0
|
63.8--77.3
|
67.1
|
60.9--72.7
|
69.1
|
63.4--74.2
|
|
35.8
|
28.8--43.3
|
34.5
|
28.7--40.9
|
35.2
|
29.6--41.2
|
|
South Dakota
|
72.3
|
67.6--76.5
|
73.1
|
69.3--76.6
|
72.7
|
69.5--75.6
|
|
40.1
|
35.3--45.1
|
40.1
|
36.8--43.5
|
40.1
|
37.0--43.2
|
|
Tennessee
|
70.6
|
65.7--75.0
|
65.4
|
59.9--70.5
|
67.9
|
64.0--71.6
|
|
35.2
|
30.8--39.8
|
31.7
|
27.4--36.4
|
33.5
|
30.1--37.1
|
|
Texas
|
78.2
|
74.3--81.6
|
74.4
|
71.4--77.1
|
76.2
|
73.5--78.8
|
|
45.5
|
42.3--48.7
|
44.2
|
41.2--47.3
|
44.8
|
42.3--47.5
|
|
Utah
|
35.9
|
28.9--43.6
|
41.2
|
32.6--50.5
|
38.6
|
31.7--46.1
|
|
14.6
|
10.4--20.1
|
21.6
|
14.7--30.4
|
18.2
|
13.3--24.4
|
|
Vermont
|
---
|
---
|
---
|
---
|
---
|
---
|
|
39.0
|
35.6--42.5
|
38.9
|
34.9--43.1
|
39.0
|
35.6--42.6
|
|
West Virginia
|
75.8
|
71.7--79.4
|
71.0
|
66.0--75.5
|
73.4
|
69.7--76.7
|
|
40.2
|
36.1--44.4
|
40.5
|
36.9--44.2
|
40.4
|
38.1--42.8
|
|
Wisconsin
|
74.8
|
70.7--78.6
|
73.8
|
69.0--78.1
|
74.4
|
70.6--77.8
|
|
40.8
|
36.2--45.7
|
41.8
|
37.4--46.3
|
41.3
|
37.6--45.1
|
|
Wyoming
|
72.1
|
69.0--75.1
|
71.8
|
68.5--74.8
|
71.8
|
69.4--74.2
|
|
40.4
|
37.2--43.7
|
42.9
|
39.4--46.3
|
41.7
|
39.0--44.4
|
|
Median
|
71.5
|
68.4
|
70.3
|
|
39.7
|
39.1
|
39.3
|
|
Range
|
35.9--78.2
|
41.2--76.3
|
38.6--76.2
|
|
14.6--50.3
|
21.6--46.4
|
18.2--47.5
|
|
Local surveys
|
|
|
|
|
|
|
|
|
|
|
|
|
|
|
Boston, MA
|
68.1
|
62.9--72.8
|
67.2
|
61.5--72.5
|
67.6
|
63.5--71.5
|
|
38.5
|
33.8--43.5
|
36.9
|
31.7--42.4
|
37.6
|
33.6--41.7
|
|
Broward County, FL
|
72.8
|
66.3--78.4
|
64.9
|
60.0--69.6
|
68.9
|
64.4--73.1
|
|
42.7
|
38.3--47.3
|
39.9
|
35.9--44.0
|
41.3
|
38.4--44.2
|
|
Charlotte-Mecklenburg, NC
|
---
|
---
|
---
|
---
|
---
|
---
|
|
33.4
|
28.9--38.2
|
33.2
|
29.0--37.7
|
33.4
|
30.0--36.9
|
|
Chicago, IL
|
69.9
|
64.6--74.7
|
63.9
|
58.1--69.4
|
67.0
|
63.0--70.7
|
|
38.5
|
32.1--45.4
|
36.2
|
30.8--42.1
|
37.5
|
32.7--42.5
|
|
Clark County, NV
|
73.9
|
69.5--77.9
|
70.1
|
65.8--74.1
|
72.0
|
68.8--75.0
|
|
36.5
|
32.4--40.9
|
37.0
|
31.8--42.6
|
36.7
|
32.9--40.7
|
|
Dallas, TX
|
72.7
|
68.6--76.6
|
73.6
|
68.7--77.9
|
73.1
|
69.6--76.3
|
|
41.2
|
35.7--46.8
|
38.4
|
32.9--44.1
|
39.7
|
35.8--43.8
|
|
Detroit, MI
|
72.4
|
67.7--76.6
|
62.1
|
55.0--68.7
|
67.4
|
62.7--71.7
|
|
34.3
|
29.6--39.3
|
29.1
|
22.2--37.1
|
31.7
|
27.0--36.8
|
|
Duval County, FL
|
68.5
|
65.7--71.3
|
62.9
|
59.5--66.2
|
66.0
|
63.5--68.4
|
|
40.9
|
37.1--44.8
|
36.2
|
32.5--40.1
|
38.8
|
35.9--41.9
|
|
Los Angeles, CA
|
71.0
|
68.2--73.7
|
65.5
|
59.5--71.0
|
68.2
|
64.3--71.9
|
|
37.1
|
33.6--40.7
|
33.4
|
29.4--37.6
|
35.2
|
32.3--38.3
|
|
Memphis, TN
|
59.7
|
54.5--64.7
|
53.9
|
48.5--59.3
|
56.9
|
52.8--60.9
|
|
26.0
|
22.2--30.2
|
22.4
|
17.9--27.7
|
24.2
|
21.0--27.8
|
|
Miami-Dade County, FL
|
---
|
---
|
---
|
---
|
---
|
---
|
|
42.0
|
38.4--45.7
|
43.8
|
39.5--48.2
|
42.9
|
40.3--45.6
|
|
Milwaukee, WI
|
73.2
|
70.0--76.1
|
66.0
|
61.7--70.0
|
69.7
|
66.9--72.4
|
|
31.7
|
28.7--34.9
|
28.8
|
24.9--33.1
|
30.3
|
27.8--32.9
|
|
New York City, NY
|
---
|
---
|
---
|
---
|
---
|
---
|
|
33.4
|
31.2--35.6
|
30.5
|
28.0--33.2
|
32.0
|
30.0--34.2
|
|
Orange County, FL
|
71.8
|
67.4--75.8
|
68.5
|
63.5--73.1
|
70.1
|
66.9--73.0
|
|
40.1
|
36.1--44.2
|
37.0
|
32.8--41.4
|
38.5
|
35.5--41.5
|
|
Palm Beach County, FL
|
74.0
|
70.7--77.0
|
71.2
|
66.5--75.4
|
72.7
|
69.6--75.6
|
|
45.8
|
42.4--49.4
|
42.5
|
37.6--47.5
|
44.2
|
41.1--47.3
|
|
Philadelphia, PA
|
70.2
|
66.0--74.0
|
63.8
|
57.8--69.5
|
67.2
|
63.9--70.3
|
|
33.5
|
30.1--37.1
|
30.7
|
24.8--37.3
|
32.1
|
28.8--35.6
|
|
San Bernardino, CA
|
72.1
|
67.3--76.5
|
67.8
|
62.9--72.3
|
69.9
|
65.9--73.6
|
|
40.1
|
34.7--45.8
|
43.2
|
37.7--48.8
|
41.7
|
37.5--45.9
|
|
San Diego, CA
|
70.4
|
66.8--73.7
|
68.5
|
64.1--72.6
|
69.4
|
66.6--72.1
|
|
36.4
|
32.8--40.2
|
35.9
|
31.7--40.4
|
36.2
|
33.1--39.3
|
|
San Francisco, CA
|
53.4
|
49.8--57.0
|
55.6
|
51.8--59.4
|
54.5
|
51.7--57.3
|
|
24.0
|
20.9--27.4
|
22.9
|
20.0--26.1
|
23.6
|
21.5--25.8
|
|
Seattle, WA
|
60.7
|
56.1--65.2
|
57.1
|
52.9--61.3
|
58.8
|
55.3--62.2
|
|
32.9
|
28.9--37.1
|
31.1
|
27.4--35.0
|
31.9
|
28.8--35.2
|
|
Median
|
71.0
|
65.5
|
68.2
|
|
36.8
|
36.0
|
36.4
|
|
Range
|
53.4--74.0
|
53.9--73.6
|
54.5--73.1
|
|
24.0--45.8
|
22.4--43.8
|
23.6--44.2
|
|
|
Binge drinking
|
|
Someone gave alcohol to them
|
|
|
Female
|
Male
|
Total
|
|
Female
|
Male
|
Total
|
|
Category
|
%
|
CI§
|
%
|
CI
|
%
|
CI
|
|
%
|
CI
|
%
|
CI
|
%
|
CI
|
|
Race/Ethnicity
|
|
|
|
|
|
|
|
|
|
|
|
|
|
|
White¶
|
27.5
|
25.6--29.6
|
28.0
|
25.0--31.2
|
27.8
|
25.7--29.9
|
|
47.9
|
44.6--51.4
|
34.2
|
31.1--37.4
|
40.8
|
38.3--43.4
|
|
Black¶
|
12.1
|
9.6--15.0
|
15.3
|
12.9--18.1
|
13.7
|
11.8--16.0
|
|
52.2
|
46.2--58.1
|
37.9
|
31.9--44.4
|
45.4
|
41.0--49.8
|
|
Hispanic
|
23.3
|
21.0--25.7
|
25.1
|
21.6--28.9
|
24.1
|
21.7--26.8
|
|
53.4
|
49.2--57.6
|
35.3
|
31.2--39.7
|
44.4
|
41.0--47.8
|
|
Grade
|
|
|
|
|
|
|
|
|
|
|
|
|
|
|
9
|
17.2
|
14.6--20.3
|
13.6
|
11.3--16.1
|
15.3
|
13.8--16.9
|
|
53.2
|
48.6--57.7
|
39.6
|
35.0--44.3
|
46.5
|
43.1--50.0
|
|
10
|
21.1
|
18.7--23.7
|
23.3
|
19.7--27.3
|
22.3
|
19.7--25.1
|
|
48.2
|
43.8--52.6
|
35.5
|
31.7--39.5
|
41.6
|
38.2--45.1
|
|
11
|
26.4
|
23.0--30.1
|
30.0
|
27.0--33.3
|
28.3
|
25.4--31.5
|
|
47.9
|
43.2--52.6
|
34.9
|
31.4--38.6
|
41.3
|
38.1--44.5
|
|
12
|
30.4
|
27.9--33.0
|
36.6
|
32.6--40.8
|
33.5
|
31.1--36.1
|
|
50.3
|
45.5--55.0
|
31.5
|
28.0--35.3
|
40.6
|
37.6--43.7
|
|
Total
|
23.4
|
21.8--25.0
|
25.0
|
22.9--27.1
|
24.2
|
22.6--25.9
|
|
49.8
|
47.4--52.2
|
35.0
|
32.7--37.3
|
42.2
|
40.3--44.1
|
|
|
Binge drinking
|
|
Someone gave alcohol to them
|
|
|
Female
|
Male
|
Total
|
|
Female
|
Male
|
Total
|
|
Site
|
%
|
CI§
|
%
|
CI
|
%
|
CI
|
|
%
|
CI
|
%
|
CI
|
%
|
CI
|
|
State surveys
|
|
|
|
|
|
|
|
|
|
|
|
|
|
|
Alabama
|
20.7
|
17.4--24.4
|
25.3
|
20.7--30.5
|
23.1
|
19.8--26.8
|
|
51.0
|
44.2--57.7
|
28.2
|
22.9--34.0
|
39.9
|
35.6--44.5
|
|
Alaska
|
19.9
|
16.7--23.6
|
23.3
|
19.0--28.1
|
21.7
|
18.8--24.8
|
|
35.0
|
28.0--42.8
|
34.4
|
25.3--44.8
|
34.7
|
28.5--41.4
|
|
Arizona
|
25.1
|
22.2--28.2
|
29.3
|
25.7--33.2
|
27.4
|
24.8--30.1
|
|
42.6
|
37.2--48.3
|
29.8
|
23.8--36.6
|
36.0
|
32.1--40.1
|
|
Arkansas
|
24.6
|
20.8--28.8
|
24.5
|
19.7--30.0
|
24.6
|
20.8--28.9
|
|
---¶
|
---
|
---
|
---
|
---
|
---
|
|
Colorado
|
27.2
|
21.8--33.2
|
23.2
|
18.4--28.8
|
25.1
|
20.8--30.0
|
|
46.4
|
40.0--52.8
|
35.3
|
27.8--43.7
|
41.3
|
35.8--47.1
|
|
Connecticut
|
22.5
|
18.8--26.7
|
26.0
|
21.4--31.2
|
24.2
|
20.5--28.3
|
|
---
|
---
|
---
|
---
|
---
|
---
|
|
Delaware
|
22.6
|
19.3--26.2
|
24.7
|
21.0--28.9
|
23.7
|
20.9--26.7
|
|
45.4
|
39.5--51.3
|
33.2
|
28.8--37.8
|
39.3
|
35.5--43.2
|
|
Florida
|
20.2
|
18.2--22.4
|
22.1
|
20.2--24.2
|
21.1
|
19.6--22.8
|
|
51.3
|
48.5--54.0
|
37.0
|
33.7--40.5
|
44.1
|
41.7--46.5
|
|
Georgia
|
16.9
|
13.3--21.3
|
20.7
|
17.0--25.0
|
18.8
|
15.6--22.4
|
|
41.4
|
33.2--50.1
|
29.6
|
25.4--34.3
|
35.6
|
31.1--40.5
|
|
Hawaii
|
22.7
|
16.3--30.7
|
22.2
|
17.6--27.5
|
22.4
|
18.1--27.5
|
|
50.9
|
44.2--57.6
|
42.7
|
32.1--54.0
|
47.2
|
42.1--52.3
|
|
Idaho
|
20.4
|
17.0--24.4
|
24.0
|
20.7--27.6
|
22.3
|
19.3--25.6
|
|
47.0
|
41.8--52.2
|
36.3
|
29.6--43.6
|
41.4
|
36.5--46.5
|
|
Illinois
|
22.5
|
18.8--26.7
|
26.8
|
22.4--31.7
|
24.7
|
20.9--29.0
|
|
41.6
|
35.7--47.9
|
24.4
|
20.6--28.6
|
32.8
|
28.6--37.2
|
|
Indiana
|
23.4
|
19.5--27.8
|
26.1
|
22.0--30.7
|
24.9
|
21.4--28.7
|
|
49.5
|
41.8--57.3
|
37.1
|
29.5--45.4
|
43.3
|
39.0--47.6
|
|
Kansas
|
23.0
|
19.5--26.8
|
27.9
|
23.5--32.8
|
25.5
|
22.3--29.0
|
|
45.6
|
37.7--53.6
|
39.8
|
34.2--45.7
|
42.5
|
38.1--47.0
|
|
Kentucky
|
20.6
|
17.3--24.3
|
26.6
|
23.6--29.9
|
23.6
|
21.2--26.2
|
|
48.5
|
42.0--55.1
|
30.3
|
24.8--36.5
|
38.7
|
33.7--44.0
|
|
Louisiana
|
22.3
|
17.5--28.0
|
27.3
|
19.1--37.3
|
24.6
|
18.5--31.9
|
|
41.6
|
33.8--49.8
|
29.0
|
21.6--37.7
|
36.0
|
29.0--43.7
|
|
Maine
|
---
|
---
|
---
|
---
|
---
|
---
|
|
41.9
|
39.1--44.8
|
31.9
|
29.1--34.9
|
36.8
|
34.8--38.9
|
|
Maryland
|
18.8
|
17.0--20.7
|
19.9
|
15.5--25.1
|
19.4
|
16.7--22.4
|
|
46.5
|
38.2--54.9
|
33.2
|
26.5--40.6
|
40.1
|
34.4--46.1
|
|
Massachusetts
|
23.5
|
20.9--26.2
|
25.3
|
22.5--28.4
|
24.5
|
22.1--27.0
|
|
---
|
---
|
---
|
---
|
---
|
---
|
|
Michigan
|
22.4
|
19.6--25.5
|
23.8
|
20.6--27.4
|
23.2
|
20.9--25.6
|
|
37.8
|
33.0--42.8
|
26.2
|
21.6--31.4
|
32.2
|
28.7--36.0
|
|
Mississippi
|
16.5
|
13.8--19.5
|
23.0
|
19.6--26.7
|
19.7
|
17.1--22.7
|
|
54.5
|
47.0--61.9
|
31.4
|
25.2--38.3
|
42.5
|
37.8--47.3
|
|
Missouri
|
23.7
|
18.0--30.5
|
26.8
|
21.9--32.3
|
25.3
|
20.7--30.5
|
|
45.9
|
36.3--55.8
|
36.5
|
27.5--46.7
|
41.0
|
33.7--48.6
|
|
Montana
|
30.0
|
24.7--35.8
|
30.2
|
26.1--34.6
|
30.1
|
26.6--33.8
|
|
43.8
|
37.3--50.4
|
32.7
|
25.9--40.4
|
37.9
|
33.6--42.3
|
|
Nevada
|
21.2
|
18.6--24.2
|
22.8
|
19.3--26.8
|
22.0
|
19.5--24.7
|
|
43.5
|
39.0--48.1
|
28.7
|
23.2--34.9
|
36.0
|
32.6--39.5
|
|
New Hampshire
|
24.6
|
20.4--29.3
|
23.4
|
19.4--27.9
|
24.0
|
20.8--27.5
|
|
33.7
|
27.9--40.1
|
28.4
|
22.6--35.2
|
31.1
|
26.9--35.5
|
|
New Jersey
|
23.9
|
18.8--29.8
|
29.5
|
24.9--34.6
|
26.7
|
23.0--30.7
|
|
40.2
|
35.0--45.7
|
24.0
|
20.2--28.3
|
32.0
|
29.0--35.2
|
|
New Mexico
|
25.4
|
23.5--27.4
|
24.5
|
21.6--27.8
|
25.0
|
22.9--27.3
|
|
44.1
|
41.3--47.0
|
30.2
|
27.1--33.4
|
37.4
|
34.8--40.0
|
|
New York
|
20.7
|
18.1--23.5
|
26.6
|
23.0--30.5
|
23.8
|
21.4--26.3
|
|
42.9
|
38.6--47.2
|
29.6
|
25.7--33.7
|
35.6
|
32.4--39.0
|
|
North Carolina
|
15.7
|
11.7--20.9
|
21.8
|
17.5--26.8
|
18.7
|
14.9--23.2
|
|
41.0
|
36.8--45.4
|
33.1
|
28.2--38.5
|
37.0
|
34.0--40.1
|
|
North Dakota
|
29.1
|
24.9--33.7
|
32.1
|
28.0--36.5
|
30.7
|
27.4--34.2
|
|
39.1
|
32.7--45.9
|
32.6
|
27.8--37.8
|
35.7
|
31.5--40.2
|
|
Oklahoma
|
21.9
|
17.9--26.6
|
25.9
|
20.7--31.8
|
24.0
|
20.2--28.3
|
|
51.8
|
43.9--59.6
|
40.5
|
34.0--47.4
|
46.0
|
41.0--51.1
|
|
Pennsylvania
|
20.2
|
16.3--24.8
|
23.6
|
19.0--28.9
|
21.9
|
18.4--25.8
|
|
49.0
|
43.8--54.4
|
35.9
|
30.7--41.6
|
43.1
|
39.5--46.7
|
|
Rhode Island
|
18.4
|
15.6--21.7
|
18.9
|
15.8--22.5
|
18.7
|
16.3--21.3
|
|
---
|
---
|
---
|
---
|
---
|
---
|
|
South Carolina
|
16.0
|
12.4--20.3
|
20.8
|
16.4--26.1
|
18.4
|
15.2--22.1
|
|
48.5
|
41.0--56.1
|
25.3
|
18.3--33.9
|
37.1
|
30.7--44.0
|
|
South Dakota
|
26.0
|
22.8--29.6
|
26.7
|
23.6--30.0
|
26.3
|
24.0--28.7
|
|
45.2
|
37.5--53.0
|
32.9
|
27.2--39.2
|
39.0
|
33.6--44.6
|
|
Tennessee
|
17.5
|
14.0--21.6
|
20.5
|
16.6--25.1
|
19.1
|
15.7--23.0
|
|
54.5
|
48.2--60.7
|
33.1
|
25.8--41.3
|
44.1
|
38.4--49.9
|
|
Texas
|
24.2
|
21.0--27.8
|
26.9
|
23.5--30.5
|
25.6
|
22.7--28.7
|
|
53.7
|
48.1--59.2
|
36.3
|
32.8--40.0
|
45.1
|
41.4--48.9
|
|
Utah
|
8.0
|
5.4--11.6
|
14.5
|
10.0--20.6
|
11.5
|
8.2--15.7
|
|
56.0
|
45.4--66.0
|
33.0
|
23.5--44.1
|
41.8
|
35.1--48.8
|
|
Vermont
|
21.1
|
18.7--23.7
|
24.7
|
21.8--27.8
|
23.1
|
20.5--25.9
|
|
---
|
---
|
---
|
---
|
---
|
---
|
|
West Virginia
|
25.4
|
21.7--29.5
|
28.7
|
25.5--32.2
|
27.2
|
24.7--29.8
|
|
46.5
|
40.8--52.2
|
30.9
|
24.7--37.9
|
38.6
|
34.4--42.9
|
|
Wisconsin
|
23.3
|
20.1--26.9
|
26.9
|
22.9--31.4
|
25.2
|
22.1--28.5
|
|
45.8
|
41.0--50.7
|
31.4
|
26.6--36.7
|
38.3
|
35.0--41.6
|
|
Wyoming
|
25.4
|
22.8--28.2
|
30.0
|
26.9--33.3
|
27.8
|
25.5--30.2
|
|
44.1
|
39.6--48.6
|
29.5
|
25.5--33.8
|
36.3
|
33.2--39.4
|
|
Median
|
22.5
|
24.7
|
24.0
|
|
45.6
|
32.6
|
38.6
|
|
Range
|
8.0--30.0
|
14.5--32.1
|
11.5--30.7
|
|
33.7--56.0
|
24.0--42.7
|
31.1--47.2
|
|
Local surveys
|
|
|
|
|
|
|
|
|
|
|
|
|
|
|
Boston, MA
|
16.7
|
13.2--20.9
|
18.6
|
14.0--24.3
|
17.6
|
14.1--21.7
|
|
35.1
|
27.8--43.2
|
32.6
|
24.8--41.5
|
34.0
|
29.0--39.3
|
|
Broward County, FL
|
19.6
|
16.1--23.5
|
21.8
|
18.8--25.2
|
20.5
|
18.1--23.2
|
|
44.5
|
39.0--50.1
|
26.9
|
22.2--32.3
|
36.1
|
32.2--40.1
|
|
Charlotte-Mecklenburg, NC
|
13.5
|
11.1--16.2
|
14.8
|
11.8--18.5
|
14.3
|
12.3--16.4
|
|
46.5
|
40.6--52.4
|
32.3
|
26.1--39.3
|
39.7
|
35.1--44.6
|
|
Chicago, IL
|
16.2
|
12.9--20.2
|
20.4
|
15.8--26.0
|
18.5
|
15.5--22.0
|
|
41.0
|
33.9--48.5
|
27.7
|
21.1--35.3
|
34.3
|
29.4--39.5
|
|
Clark County, NV
|
20.2
|
17.0--23.8
|
21.5
|
17.2--26.6
|
20.8
|
17.7--24.4
|
|
44.1
|
38.4--49.9
|
29.1
|
22.7--36.4
|
36.3
|
32.1--40.7
|
|
Dallas, TX
|
19.3
|
15.4--24.1
|
24.2
|
20.5--28.3
|
21.7
|
18.6--25.1
|
|
52.8
|
46.5--59.0
|
32.3
|
25.4--40.2
|
43.1
|
38.9--47.5
|
|
Detroit, MI
|
9.1
|
6.9--11.9
|
11.5
|
7.6--17.0
|
10.3
|
7.9--13.3
|
|
49.5
|
40.4--58.6
|
22.6
|
14.9--32.7
|
37.2
|
30.2--44.8
|
|
Duval County, FL
|
19.0
|
16.4--21.8
|
20.0
|
17.1--23.2
|
19.7
|
17.4--22.2
|
|
46.6
|
41.0--52.2
|
33.9
|
28.3--40.1
|
40.6
|
36.6--44.8
|
|
Los Angeles, CA
|
18.5
|
15.8--21.6
|
18.6
|
14.8--23.1
|
18.6
|
15.4--22.3
|
|
47.9
|
43.0--52.8
|
31.6
|
23.5--40.9
|
40.1
|
34.3--46.1
|
|
Memphis, TN
|
7.3
|
5.2--10.3
|
7.6
|
5.4--10.6
|
7.4
|
5.8--9.4
|
|
51.3
|
41.0--61.5
|
46.2
|
36.4--56.3
|
49.2
|
41.8--56.7
|
|
Miami-Dade County, FL
|
17.8
|
15.4--20.5
|
22.1
|
18.7--25.9
|
20.0
|
17.6--22.7
|
|
46.0
|
40.8--51.2
|
33.2
|
28.2--38.5
|
39.2
|
35.5--43.1
|
|
Milwaukee, WI
|
12.7
|
10.4--15.3
|
14.6
|
12.0--17.7
|
13.6
|
11.8--15.7
|
|
50.1
|
42.6--57.6
|
27.3
|
20.6--35.1
|
39.4
|
33.8--45.3
|
|
New York City, NY
|
13.4
|
11.9--15.0
|
14.6
|
12.9--16.6
|
14.0
|
12.6--15.5
|
|
34.3
|
30.8--38.0
|
31.8
|
28.7--35.2
|
33.2
|
30.5--36.1
|
|
Orange County, FL
|
17.9
|
15.1--21.2
|
20.9
|
17.5--24.9
|
19.4
|
17.2--21.8
|
|
47.9
|
39.4--56.6
|
37.5
|
29.5--46.1
|
43.0
|
36.7--49.6
|
|
Palm Beach County, FL
|
21.6
|
18.8--24.6
|
24.2
|
20.5--28.4
|
22.9
|
20.4--25.7
|
|
47.6
|
42.4--53.0
|
31.2
|
25.7--37.4
|
39.6
|
35.5--43.8
|
|
Philadelphia, PA
|
15.4
|
12.5--18.8
|
15.0
|
10.8--20.6
|
15.2
|
12.6--18.4
|
|
37.1
|
30.4--44.4
|
37.1
|
27.8--47.5
|
37.1
|
31.0--43.7
|
|
San Bernardino, CA
|
20.4
|
16.5--24.9
|
27.4
|
22.6--32.8
|
23.9
|
20.4--27.9
|
|
43.3
|
36.5--50.2
|
33.0
|
27.3--39.2
|
38.0
|
33.2--43.0
|
|
San Diego, CA
|
20.4
|
17.8--23.4
|
20.9
|
17.6--24.6
|
20.6
|
18.6--22.8
|
|
47.0
|
40.7--53.5
|
29.3
|
22.2--37.7
|
38.3
|
33.6--43.1
|
|
San Francisco, CA
|
12.0
|
9.9--14.5
|
12.6
|
10.4--15.1
|
12.4
|
11.0--14.0
|
|
41.4
|
34.9--48.2
|
29.4
|
22.7--37.0
|
35.2
|
30.2--40.5
|
|
Seattle, WA
|
17.9
|
14.9--21.4
|
18.1
|
15.3--21.3
|
18.2
|
16.0--20.6
|
|
39.8
|
33.7--46.2
|
27.3
|
21.3--34.3
|
33.4
|
28.7--38.4
|
|
Median
|
17.8
|
19.3
|
18.5
|
|
46.3
|
31.7
|
38.1
|
|
Range
|
7.3--21.6
|
7.6--27.4
|
7.4--23.9
|
|
34.3--52.8
|
22.6--46.2
|
33.2--49.2
|
|
|
Ever used marijuana*
|
|
Current marijuana use†
|
|
|
Female
|
Male
|
Total
|
|
Female
|
Male
|
Total
|
|
Category
|
%
|
CI§
|
%
|
CI
|
%
|
CI
|
|
%
|
CI
|
%
|
CI
|
%
|
CI
|
|
Race/Ethnicity
|
|
|
|
|
|
|
|
|
|
|
|
|
|
|
White¶
|
33.7
|
31.1--36.4
|
37.4
|
34.1--40.9
|
35.7
|
33.3--38.2
|
|
17.9
|
15.9--20.2
|
23.0
|
20.8--25.4
|
20.7
|
18.9--22.6
|
|
Black¶
|
38.0
|
33.0--43.3
|
44.3
|
40.6--48.1
|
41.2
|
37.7--44.9
|
|
18.7
|
15.2--22.9
|
25.6
|
22.3--29.2
|
22.2
|
19.4--25.3
|
|
Hispanic
|
35.6
|
31.5--39.9
|
44.2
|
41.5--47.0
|
39.9
|
37.1--42.8
|
|
18.2
|
15.1--21.8
|
25.0
|
22.9--27.2
|
21.6
|
19.6--23.8
|
|
Grade
|
|
|
|
|
|
|
|
|
|
|
|
|
|
|
9
|
25.7
|
22.4--29.3
|
26.9
|
23.3--30.8
|
26.4
|
23.8--29.1
|
|
15.5
|
13.0--18.4
|
15.5
|
13.2--18.1
|
15.5
|
13.7--17.6
|
|
10
|
33.0
|
30.0--36.1
|
37.7
|
33.2--42.5
|
35.5
|
32.8--38.3
|
|
17.9
|
15.5--20.5
|
23.9
|
20.4--27.7
|
21.1
|
18.9--23.4
|
|
11
|
39.5
|
35.7--43.4
|
44.3
|
39.8--49.0
|
42.0
|
38.3--45.8
|
|
19.5
|
16.5--22.9
|
26.7
|
23.1--30.6
|
23.2
|
20.3--26.4
|
|
12
|
40.2
|
36.9--43.7
|
50.9
|
46.8--54.9
|
45.6
|
42.6--48.6
|
|
19.1
|
16.7--21.8
|
29.9
|
26.2--33.9
|
24.6
|
21.7--27.7
|
|
Total
|
34.3
|
32.1--36.5
|
39.0
|
36.4--41.6
|
36.8
|
34.8--38.8
|
|
17.9
|
16.2--19.7
|
23.4
|
21.8--25.1
|
20.8
|
19.4--22.3
|
|
|
Ever used marijuana*
|
|
Current marijuana use†
|
|
|
Female
|
Male
|
Total
|
|
Female
|
Male
|
Total
|
|
Site
|
%
|
CI§
|
%
|
CI
|
%
|
CI
|
|
%
|
CI
|
%
|
CI
|
%
|
CI
|
|
State surveys
|
|
|
|
|
|
|
|
|
|
|
|
|
|
|
Alabama
|
24.8
|
20.7--29.4
|
37.5
|
33.3--41.9
|
31.3
|
27.7--35.1
|
|
12.2
|
9.4--15.7
|
20.3
|
17.4--23.6
|
16.2
|
13.7--19.1
|
|
Alaska
|
39.5
|
35.1--44.0
|
49.1
|
44.1--54.1
|
44.5
|
40.6--48.5
|
|
19.0
|
16.2--22.1
|
26.0
|
21.4--31.2
|
22.7
|
19.5--26.1
|
|
Arizona
|
40.0
|
34.9--45.3
|
45.4
|
40.7--50.1
|
42.8
|
38.6--47.2
|
|
20.4
|
16.4--25.0
|
26.7
|
22.6--31.2
|
23.7
|
20.1--27.8
|
|
Arkansas
|
35.4
|
28.8--42.6
|
39.3
|
33.8--45.1
|
37.4
|
32.8--42.3
|
|
16.5
|
13.5--20.2
|
18.9
|
14.7--23.9
|
17.8
|
15.3--20.5
|
|
Colorado
|
40.8
|
34.1--47.8
|
44.5
|
37.4--51.9
|
42.6
|
36.4--49.0
|
|
24.2
|
19.6--29.5
|
25.5
|
20.3--31.3
|
24.8
|
20.4--29.7
|
|
Connecticut
|
33.7
|
29.9--37.8
|
41.3
|
37.3--45.4
|
37.6
|
34.3--41.1
|
|
18.2
|
15.6--21.2
|
25.3
|
21.3--29.8
|
21.8
|
18.9--25.1
|
|
Delaware
|
42.0
|
37.8--46.3
|
43.5
|
39.7--47.4
|
42.8
|
39.6--46.0
|
|
24.7
|
21.8--27.9
|
26.7
|
23.6--30.1
|
25.8
|
23.3--28.5
|
|
Florida
|
33.4
|
31.4--35.5
|
39.4
|
37.0--41.9
|
36.4
|
34.7--38.1
|
|
18.6
|
17.0--20.3
|
24.1
|
22.1--26.2
|
21.4
|
19.9--22.8
|
|
Georgia
|
33.3
|
29.0--37.8
|
40.1
|
36.2--44.1
|
36.6
|
33.5--39.8
|
|
15.7
|
12.6--19.5
|
21.0
|
18.2--24.1
|
18.3
|
16.3--20.5
|
|
Hawaii
|
42.6
|
32.6--53.2
|
37.9
|
32.0--44.2
|
40.2
|
33.2--47.7
|
|
22.1
|
16.6--28.8
|
22.1
|
17.9--26.9
|
22.1
|
18.2--26.5
|
|
Idaho
|
26.1
|
22.5--30.1
|
33.4
|
28.6--38.5
|
29.9
|
26.3--33.7
|
|
12.1
|
9.7--15.0
|
15.2
|
12.6--18.1
|
13.7
|
11.7--16.0
|
|
Illinois
|
35.1
|
30.5--39.9
|
42.5
|
37.9--47.3
|
38.9
|
35.3--42.5
|
|
19.1
|
15.7--23.1
|
22.7
|
19.4--26.5
|
21.0
|
18.0--24.3
|
|
Indiana
|
37.1
|
32.4--42.2
|
36.8
|
32.6--41.2
|
37.1
|
33.6--40.7
|
|
19.4
|
15.3--24.3
|
22.1
|
18.3--26.3
|
20.9
|
17.3--24.9
|
|
Kansas
|
27.1
|
22.4--32.3
|
33.1
|
28.5--38.1
|
30.1
|
26.6--33.9
|
|
12.0
|
9.6--14.9
|
17.3
|
14.1--20.9
|
14.7
|
12.4--17.3
|
|
Kentucky
|
28.5
|
23.7--33.8
|
34.4
|
29.6--39.5
|
31.4
|
27.2--35.9
|
|
12.5
|
9.5--16.3
|
19.6
|
17.0--22.6
|
16.1
|
13.9--18.6
|
|
Louisiana
|
28.3
|
23.0--34.2
|
38.0
|
32.6--43.8
|
32.8
|
30.0--35.8
|
|
14.7
|
10.1--21.0
|
18.2
|
15.2--21.5
|
16.3
|
13.7--19.3
|
|
Maine
|
34.4
|
32.6--36.2
|
37.7
|
35.9--39.6
|
36.2
|
34.8--37.5
|
|
18.8
|
17.4--20.2
|
22.1
|
20.6--23.7
|
20.5
|
19.4--21.6
|
|
Maryland
|
32.1
|
28.6--35.7
|
39.8
|
34.0--45.8
|
35.9
|
31.9--40.0
|
|
19.2
|
15.6--23.3
|
24.6
|
19.7--30.3
|
21.9
|
18.7--25.4
|
|
Massachusetts
|
38.4
|
34.6--42.3
|
46.4
|
42.6--50.3
|
42.5
|
39.0--46.1
|
|
22.8
|
20.1--25.7
|
31.4
|
28.1--34.8
|
27.1
|
24.6--29.7
|
|
Michigan
|
34.7
|
31.6--37.8
|
38.4
|
34.7--42.3
|
36.5
|
33.9--39.3
|
|
19.3
|
16.8--22.1
|
22.1
|
19.4--25.1
|
20.7
|
18.9--22.6
|
|
Mississippi
|
30.1
|
26.2--34.2
|
40.1
|
35.3--45.2
|
35.1
|
31.8--38.5
|
|
14.2
|
11.3--17.8
|
21.2
|
17.8--25.0
|
17.7
|
15.3--20.3
|
|
Missouri
|
33.0
|
28.0--38.3
|
36.8
|
31.9--42.0
|
34.9
|
30.5--39.6
|
|
18.4
|
15.0--22.4
|
22.7
|
17.7--28.7
|
20.6
|
16.6--25.4
|
|
Montana
|
41.3
|
35.9--47.0
|
43.1
|
38.6--47.8
|
42.2
|
38.0--46.5
|
|
22.5
|
18.2--27.5
|
23.7
|
20.2--27.5
|
23.1
|
20.1--26.4
|
|
Nevada
|
35.9
|
32.2--39.9
|
42.8
|
38.4--47.4
|
39.5
|
35.9--43.2
|
|
16.7
|
14.2--19.5
|
22.9
|
19.4--26.9
|
20.0
|
17.4--22.8
|
|
New Hampshire
|
37.7
|
32.1--43.7
|
43.1
|
38.5--47.9
|
40.5
|
36.6--44.6
|
|
22.9
|
18.8--27.6
|
28.1
|
22.8--34.0
|
25.6
|
22.1--29.5
|
|
New Jersey
|
31.8
|
26.9--37.1
|
38.7
|
32.5--45.2
|
35.3
|
30.3--40.7
|
|
15.6
|
12.3--19.7
|
24.5
|
21.0--28.4
|
20.3
|
17.2--23.7
|
|
New Mexico
|
---¶
|
---
|
---
|
---
|
---
|
---
|
|
28.2
|
26.0--30.6
|
27.8
|
23.3--32.8
|
28.0
|
24.8--31.4
|
|
New York
|
31.1
|
27.9--34.5
|
38.0
|
33.8--42.3
|
34.7
|
31.6--38.0
|
|
16.8
|
14.0--19.9
|
24.7
|
21.3--28.5
|
20.9
|
18.4--23.6
|
|
North Carolina
|
31.2
|
26.9--36.0
|
43.3
|
39.4--47.3
|
37.0
|
33.2--41.0
|
|
14.5
|
11.4--18.3
|
25.5
|
21.5--29.8
|
19.8
|
16.7--23.3
|
|
North Dakota
|
27.9
|
22.8--33.6
|
33.3
|
28.6--38.4
|
30.7
|
26.7--35.0
|
|
15.8
|
12.1--20.5
|
18.0
|
14.7--21.8
|
16.9
|
14.1--20.3
|
|
Oklahoma
|
31.7
|
25.3--38.9
|
31.8
|
26.4--37.7
|
31.9
|
26.6--37.7
|
|
16.5
|
12.2--22.0
|
18.0
|
13.9--23.0
|
17.2
|
13.4--21.9
|
|
Pennsylvania
|
35.2
|
30.4--40.2
|
35.0
|
30.2--40.2
|
35.0
|
31.2--39.1
|
|
18.8
|
15.0--23.3
|
19.9
|
16.9--23.2
|
19.3
|
16.6--22.5
|
|
Rhode Island
|
36.6
|
32.6--40.7
|
42.9
|
39.6--46.2
|
39.9
|
36.5--43.3
|
|
22.7
|
20.2--25.4
|
29.6
|
26.1--33.4
|
26.3
|
23.6--29.2
|
|
South Carolina
|
35.4
|
29.6--41.6
|
42.8
|
37.3--48.4
|
39.0
|
34.8--43.4
|
|
17.7
|
14.1--21.9
|
23.2
|
19.3--27.6
|
20.4
|
17.3--23.9
|
|
South Dakota
|
28.2
|
24.5--32.2
|
31.8
|
27.3--36.6
|
30.0
|
26.9--33.3
|
|
14.6
|
11.1--19.0
|
15.8
|
12.9--19.2
|
15.2
|
12.6--18.1
|
|
Tennessee
|
35.0
|
30.7--39.6
|
39.7
|
35.0--44.6
|
37.5
|
33.9--41.2
|
|
17.3
|
14.9--20.0
|
22.5
|
18.6--26.9
|
20.1
|
17.5--22.9
|
|
Texas
|
33.9
|
31.1--36.8
|
40.8
|
37.3--44.4
|
37.4
|
35.3--39.7
|
|
16.2
|
14.2--18.3
|
22.8
|
20.5--25.2
|
19.5
|
18.1--21.1
|
|
Utah
|
16.3
|
12.2--21.4
|
24.6
|
18.6--31.9
|
20.6
|
15.7--26.6
|
|
8.0
|
5.6--11.4
|
11.9
|
8.4--16.7
|
10.0
|
7.3--13.6
|
|
Vermont
|
---
|
---
|
---
|
---
|
---
|
---
|
|
21.8
|
19.8--24.0
|
26.8
|
23.0--30.9
|
24.6
|
22.1--27.2
|
|
West Virginia
|
37.9
|
31.9--44.3
|
39.6
|
34.5--44.9
|
38.9
|
34.5--43.4
|
|
17.6
|
14.0--22.0
|
22.7
|
18.9--27.1
|
20.3
|
16.9--24.2
|
|
Wisconsin
|
31.8
|
27.5--36.4
|
36.5
|
31.6--41.8
|
34.2
|
29.9--38.8
|
|
15.6
|
12.7--18.9
|
22.2
|
18.2--26.8
|
18.9
|
15.8--22.5
|
|
Wyoming
|
32.3
|
29.5--35.2
|
37.4
|
34.1--40.8
|
35.0
|
32.6--37.5
|
|
14.6
|
12.7--16.8
|
19.1
|
16.5--21.9
|
16.9
|
15.2--18.8
|
|
Median
|
33.8
|
39.3
|
36.5
|
|
17.6
|
22.7
|
20.3
|
|
Range
|
16.3--42.6
|
24.6--49.1
|
20.6--44.5
|
|
8.0--28.2
|
11.9--31.4
|
10.0--28.0
|
|
Local surveys
|
|
|
|
|
|
|
|
|
|
|
|
|
|
|
Boston, MA
|
34.0
|
29.4--38.9
|
41.6
|
37.1--46.3
|
37.7
|
33.8--41.8
|
|
18.6
|
15.5--22.2
|
25.0
|
20.8--29.7
|
21.7
|
18.7--25.0
|
|
Broward County, FL
|
32.4
|
28.1--37.1
|
41.1
|
37.0--45.2
|
36.6
|
33.3--40.1
|
|
19.9
|
16.7--23.5
|
27.6
|
24.1--31.5
|
23.7
|
21.2--26.5
|
|
Charlotte-Mecklenburg, NC
|
34.6
|
30.6--38.8
|
41.8
|
37.2--46.5
|
38.1
|
35.3--41.1
|
|
17.5
|
14.6--20.8
|
24.6
|
21.3--28.1
|
21.0
|
19.0--23.3
|
|
Chicago, IL
|
40.3
|
33.3--47.6
|
41.5
|
34.7--48.6
|
41.0
|
35.7--46.6
|
|
20.2
|
15.3--26.1
|
24.1
|
19.5--29.3
|
22.2
|
19.2--25.5
|
|
Clark County, NV
|
36.2
|
31.6--41.0
|
42.1
|
36.8--47.6
|
39.2
|
34.8--43.7
|
|
17.4
|
14.3--20.9
|
23.5
|
18.8--29.0
|
20.5
|
17.0--24.6
|
|
Dallas, TX
|
29.4
|
24.7--34.6
|
39.6
|
33.9--45.6
|
34.4
|
30.3--38.7
|
|
12.5
|
9.7--15.9
|
19.9
|
16.3--24.0
|
16.1
|
13.6--18.9
|
|
Detroit, MI
|
34.6
|
30.8--38.6
|
38.2
|
31.9--44.9
|
36.4
|
32.0--41.0
|
|
14.8
|
11.8--18.4
|
18.5
|
14.0--24.1
|
16.6
|
13.2--20.7
|
|
Duval County, FL
|
37.0
|
33.2--40.9
|
40.2
|
36.8--43.7
|
38.6
|
35.9--41.5
|
|
20.5
|
17.4--23.9
|
24.1
|
21.2--27.3
|
22.2
|
20.0--24.7
|
|
Los Angeles, CA
|
33.7
|
27.6--40.4
|
41.3
|
33.5--49.7
|
37.6
|
31.8--43.8
|
|
16.0
|
13.2--19.3
|
22.5
|
16.8--29.5
|
19.3
|
15.5--23.8
|
|
Memphis, TN
|
38.2
|
34.0--42.6
|
40.8
|
35.9--46.0
|
39.5
|
36.2--42.8
|
|
19.4
|
16.1--23.1
|
25.0
|
20.3--30.4
|
22.1
|
19.4--25.1
|
|
Miami-Dade County, FL
|
27.5
|
24.2--30.9
|
35.9
|
31.8--40.3
|
31.7
|
28.9--34.7
|
|
15.9
|
13.3--18.9
|
22.5
|
19.4--26.0
|
19.3
|
17.0--21.8
|
|
Milwaukee, WI
|
50.5
|
46.8--54.1
|
53.5
|
50.0--56.9
|
51.9
|
49.3--54.6
|
|
25.9
|
23.1--29.0
|
31.2
|
27.5--35.1
|
28.5
|
26.1--31.1
|
|
New York City, NY
|
24.4
|
21.8--27.2
|
30.2
|
27.3--33.3
|
27.1
|
24.7--29.7
|
|
12.9
|
11.2--14.9
|
17.4
|
15.4--19.6
|
15.0
|
13.4--16.8
|
|
Orange County, FL
|
31.4
|
28.1--34.9
|
40.9
|
36.5--45.4
|
36.2
|
33.2--39.3
|
|
18.9
|
16.3--21.8
|
23.3
|
19.8--27.2
|
21.2
|
18.9--23.5
|
|
Palm Beach County, FL
|
37.7
|
34.2--41.4
|
41.8
|
37.3--46.4
|
39.9
|
36.7--43.2
|
|
19.3
|
16.5--22.4
|
26.7
|
22.7--31.2
|
23.1
|
20.6--25.7
|
|
Philadelphia, PA
|
35.9
|
31.1--41.0
|
40.2
|
33.3--47.5
|
38.1
|
33.2--43.2
|
|
18.8
|
14.7--23.7
|
19.2
|
14.5--24.9
|
19.0
|
15.1--23.6
|
|
San Bernardino, CA
|
34.8
|
29.4--40.7
|
46.9
|
41.9--52.1
|
40.9
|
36.7--45.1
|
|
17.0
|
13.4--21.4
|
27.5
|
23.9--31.5
|
22.3
|
19.6--25.2
|
|
San Diego, CA
|
32.4
|
28.3--36.8
|
42.0
|
38.0--46.1
|
37.3
|
34.0--40.6
|
|
15.4
|
13.0--18.1
|
22.2
|
19.2--25.4
|
18.9
|
16.7--21.2
|
|
San Francisco, CA
|
24.8
|
21.5--28.5
|
28.0
|
24.5--31.7
|
26.5
|
23.7--29.4
|
|
15.4
|
12.7--18.5
|
16.5
|
14.2--19.2
|
16.0
|
14.0--18.4
|
|
Seattle, WA
|
33.7
|
29.2--38.5
|
39.5
|
35.5--43.6
|
36.6
|
33.1--40.3
|
|
18.3
|
15.1--22.0
|
24.1
|
20.9--27.7
|
21.4
|
18.8--24.2
|
|
Median
|
34.3
|
41.0
|
37.6
|
|
17.9
|
23.8
|
21.1
|
|
Range
|
24.4--50.5
|
28.0--53.5
|
26.5--51.9
|
|
12.5--25.9
|
16.5--31.2
|
15.0--28.5
|
|
|
Ever used cocaine*
|
|
Current cocaine use†
|
|
|
Female
|
Male
|
Total
|
|
Female
|
Male
|
Total
|
|
Category
|
%
|
CI§
|
%
|
CI
|
%
|
CI
|
|
%
|
CI
|
%
|
CI
|
%
|
CI
|
|
Race/Ethnicity
|
|
|
|
|
|
|
|
|
|
|
|
|
|
|
White¶
|
5.4
|
4.5--6.5
|
7.1
|
5.6--8.9
|
6.3
|
5.3--7.4
|
|
1.7
|
1.2--2.5
|
3.0
|
2.4--3.8
|
2.4
|
2.1--2.9
|
|
Black¶
|
1.5
|
0.9--2.6
|
4.3
|
2.9--6.3
|
2.9
|
2.0--4.1
|
|
0.9
|
0.4--1.8
|
3.0
|
1.8--5.0
|
1.9
|
1.2--3.1
|
|
Hispanic
|
8.7
|
7.1--10.6
|
10.1
|
8.0--12.6
|
9.4
|
8.0--11.0
|
|
3.7
|
2.6--5.0
|
4.9
|
3.5--6.8
|
4.3
|
3.3--5.5
|
|
Grade
|
|
|
|
|
|
|
|
|
|
|
|
|
|
|
9
|
4.7
|
3.7--5.9
|
4.4
|
3.3--5.7
|
4.5
|
3.7--5.5
|
|
2.2
|
1.6--3.0
|
2.4
|
1.6--3.5
|
2.3
|
1.8--3.0
|
|
10
|
4.7
|
3.4--6.3
|
6.4
|
4.9--8.3
|
5.6
|
4.5--6.9
|
|
1.8
|
1.1--2.7
|
3.2
|
2.3--4.4
|
2.5
|
2.0--3.3
|
|
11
|
6.1
|
4.9--7.5
|
9.4
|
7.6--11.4
|
7.7
|
6.6--9.0
|
|
1.7
|
1.0--3.0
|
4.8
|
3.7--6.1
|
3.3
|
2.6--4.1
|
|
12
|
6.0
|
4.7--7.5
|
9.7
|
8.2--11.4
|
7.9
|
6.9--9.0
|
|
2.0
|
1.3--3.2
|
3.9
|
2.9--5.2
|
3.0
|
2.4--3.8
|
|
Total
|
5.3
|
4.6--6.2
|
7.3
|
6.2--8.4
|
6.4
|
5.7--7.1
|
|
2.0
|
1.6--2.5
|
3.5
|
2.9--4.2
|
2.8
|
2.4--3.2
|
|
|
Ever used cocaine*
|
|
Current cocaine use†
|
|
|
Female
|
Male
|
Total
|
|
Female
|
Male
|
Total
|
|
Site
|
%
|
CI§
|
%
|
CI
|
%
|
CI
|
|
%
|
CI
|
%
|
CI
|
%
|
CI
|
|
State surveys
|
|
|
|
|
|
|
|
|
|
|
|
|
|
|
Alabama
|
2.6
|
1.6--4.3
|
9.3
|
7.0--12.2
|
6.1
|
4.4--8.3
|
|
0.8
|
0.3--2.3
|
4.2
|
2.8--6.2
|
2.6
|
1.7--4.2
|
|
Alaska
|
7.1
|
5.2--9.6
|
7.4
|
5.1--10.5
|
7.4
|
5.9--9.2
|
|
1.6
|
0.8--3.3
|
2.5
|
1.4--4.2
|
2.1
|
1.4--3.2
|
|
Arizona
|
9.8
|
7.9--12.1
|
12.8
|
10.2--16.0
|
11.5
|
9.6--13.7
|
|
3.6
|
2.6--4.9
|
5.7
|
4.1--7.8
|
4.8
|
3.9--6.0
|
|
Arkansas
|
6.8
|
4.6--10.1
|
8.2
|
5.7--11.7
|
7.5
|
5.6--10.0
|
|
2.9
|
1.6--5.4
|
4.6
|
3.0--7.1
|
3.8
|
2.6--5.5
|
|
Colorado
|
7.2
|
4.6--11.2
|
9.4
|
7.1--12.4
|
8.3
|
6.4--10.7
|
|
3.3
|
2.1--5.3
|
4.0
|
2.7--5.8
|
3.6
|
2.7--4.9
|
|
Connecticut
|
3.9
|
2.5--5.9
|
6.6
|
5.2--8.3
|
5.4
|
4.2--6.9
|
|
1.6
|
1.0--2.8
|
3.1
|
2.0--4.9
|
2.5
|
1.8--3.5
|
|
Delaware
|
4.8
|
3.6--6.3
|
6.5
|
5.0--8.4
|
5.8
|
4.6--7.2
|
|
2.1
|
1.4--3.3
|
3.2
|
2.2--4.7
|
2.8
|
2.2--3.7
|
|
Florida
|
5.3
|
4.4--6.3
|
8.2
|
7.2--9.5
|
6.9
|
6.2--7.7
|
|
2.1
|
1.6--2.8
|
4.3
|
3.5--5.3
|
3.3
|
2.8--3.9
|
|
Georgia
|
4.2
|
2.8--6.4
|
7.6
|
5.5--10.3
|
5.9
|
4.4--7.8
|
|
1.4
|
0.7--2.9
|
3.5
|
2.1--5.8
|
2.5
|
1.5--4.0
|
|
Hawaii
|
5.1
|
2.6--9.6
|
6.6
|
4.8--8.8
|
6.0
|
4.3--8.3
|
|
---¶
|
---
|
---
|
---
|
---
|
---
|
|
Idaho
|
5.4
|
4.1--7.1
|
5.5
|
4.1--7.4
|
5.5
|
4.5--6.8
|
|
1.8
|
1.1--2.9
|
2.9
|
1.9--4.4
|
2.4
|
1.6--3.4
|
|
Illinois
|
5.2
|
3.7--7.3
|
8.0
|
5.7--10.9
|
6.8
|
5.0--9.0
|
|
1.9
|
1.1--3.3
|
4.1
|
3.1--5.4
|
3.1
|
2.3--4.3
|
|
Indiana
|
5.4
|
3.6--8.1
|
7.8
|
5.9--10.3
|
6.6
|
5.1--8.5
|
|
2.6
|
1.8--4.0
|
2.7
|
1.7--4.3
|
2.7
|
2.1--3.5
|
|
Kansas
|
5.2
|
3.7--7.2
|
7.6
|
6.0--9.5
|
6.4
|
5.2--8.0
|
|
1.7
|
1.1--2.7
|
2.8
|
1.9--4.3
|
2.3
|
1.6--3.3
|
|
Kentucky
|
5.0
|
3.0--8.0
|
7.1
|
4.6--10.7
|
6.0
|
4.2--8.5
|
|
---
|
---
|
---
|
---
|
---
|
---
|
|
Louisiana
|
6.8
|
4.3--10.6
|
8.9
|
5.3--14.5
|
7.9
|
6.2--10.0
|
|
2.2
|
1.1--4.2
|
5.6
|
2.4--12.4
|
4.0
|
2.2--7.3
|
|
Maine
|
---
|
---
|
---
|
---
|
---
|
---
|
|
---
|
---
|
---
|
---
|
---
|
---
|
|
Maryland
|
4.5
|
3.4--5.9
|
7.7
|
6.0--9.9
|
6.3
|
5.1--7.8
|
|
1.4
|
0.8--2.4
|
4.6
|
3.3--6.5
|
3.2
|
2.3--4.4
|
|
Massachusetts
|
4.8
|
3.6--6.3
|
7.2
|
5.6--9.3
|
6.1
|
4.9--7.6
|
|
---
|
---
|
---
|
---
|
---
|
---
|
|
Michigan
|
4.9
|
3.7--6.4
|
7.9
|
6.4--9.8
|
6.5
|
5.3--7.9
|
|
1.7
|
1.2--2.6
|
3.9
|
3.1--4.9
|
2.9
|
2.4--3.5
|
|
Mississippi
|
3.7
|
2.3--5.9
|
3.7
|
2.3--5.9
|
3.8
|
2.7--5.2
|
|
1.7
|
1.0--2.9
|
1.6
|
0.8--3.2
|
1.7
|
1.3--2.3
|
|
Missouri
|
4.8
|
3.6--6.4
|
5.2
|
3.6--7.5
|
5.0
|
3.8--6.6
|
|
1.8
|
1.0--3.2
|
1.9
|
0.9--3.7
|
1.8
|
1.2--2.7
|
|
Montana
|
4.7
|
3.3--6.6
|
9.5
|
6.9--12.8
|
7.2
|
5.7--9.1
|
|
1.0
|
0.5--2.2
|
4.5
|
2.4--8.2
|
2.8
|
1.6--4.7
|
|
Nevada
|
6.3
|
4.9--8.1
|
9.0
|
7.0--11.6
|
7.7
|
6.3--9.3
|
|
---
|
---
|
---
|
---
|
---
|
---
|
|
New Hampshire
|
5.9
|
3.9--8.8
|
7.0
|
5.2--9.4
|
6.5
|
5.1--8.3
|
|
3.3
|
1.8--6.1
|
4.4
|
2.9--6.8
|
4.0
|
2.8--5.6
|
|
New Jersey
|
3.7
|
2.3--6.1
|
6.9
|
4.9--9.7
|
5.5
|
4.1--7.2
|
|
---
|
---
|
---
|
---
|
---
|
---
|
|
New Mexico
|
12.5
|
11.0--14.2
|
13.1
|
10.3--16.5
|
12.8
|
10.9--15.0
|
|
5.1
|
4.0--6.4
|
6.2
|
4.3--8.7
|
5.6
|
4.4--7.2
|
|
New York
|
5.4
|
3.8--7.5
|
8.4
|
5.7--12.1
|
7.2
|
5.4--9.5
|
|
---
|
---
|
---
|
---
|
---
|
---
|
|
North Carolina
|
3.7
|
2.5--5.4
|
7.4
|
6.1--8.9
|
5.5
|
4.4--7.0
|
|
---
|
---
|
---
|
---
|
---
|
---
|
|
North Dakota
|
4.6
|
3.0--7.0
|
5.5
|
3.8--7.8
|
5.1
|
3.7--6.9
|
|
---
|
---
|
---
|
---
|
---
|
---
|
|
Oklahoma
|
7.6
|
5.2--11.0
|
7.3
|
5.2--10.1
|
7.4
|
5.6--9.7
|
|
1.1
|
0.5--2.5
|
3.4
|
2.2--5.0
|
2.3
|
1.6--3.3
|
|
Pennsylvania
|
4.3
|
2.8--6.4
|
6.7
|
4.8--9.4
|
5.5
|
4.2--7.3
|
|
1.3
|
0.7--2.5
|
2.7
|
1.7--4.1
|
2.0
|
1.4--2.9
|
|
Rhode Island
|
4.0
|
2.8--5.6
|
6.8
|
5.4--8.5
|
5.4
|
4.3--6.7
|
|
2.2
|
1.4--3.4
|
3.1
|
2.1--4.6
|
2.7
|
2.0--3.6
|
|
South Carolina
|
3.9
|
2.4--6.3
|
6.1
|
4.0--9.1
|
5.0
|
3.5--7.0
|
|
1.0
|
0.4--2.4
|
3.6
|
2.4--5.4
|
2.3
|
1.5--3.5
|
|
South Dakota
|
---
|
---
|
---
|
---
|
---
|
---
|
|
1.9
|
1.1--3.3
|
3.8
|
2.5--5.6
|
2.9
|
2.0--4.1
|
|
Tennessee
|
5.3
|
4.1--6.7
|
6.2
|
4.4--8.7
|
5.7
|
4.5--7.3
|
|
2.3
|
1.6--3.4
|
2.7
|
1.7--4.2
|
2.5
|
1.8--3.6
|
|
Texas
|
7.9
|
6.6--9.4
|
9.1
|
7.2--11.4
|
8.5
|
7.3--9.9
|
|
2.3
|
1.5--3.6
|
3.7
|
2.6--5.3
|
3.1
|
2.3--4.0
|
|
Utah
|
3.8
|
2.4--5.9
|
6.7
|
4.7--9.6
|
5.6
|
4.3--7.1
|
|
1.6
|
0.8--3.1
|
3.5
|
2.2--5.5
|
2.8
|
2.1--3.7
|
|
Vermont
|
---
|
---
|
---
|
---
|
---
|
---
|
|
2.6
|
2.1--3.1
|
5.1
|
4.1--6.4
|
4.0
|
3.4--4.6
|
|
West Virginia
|
7.0
|
4.6--10.3
|
9.2
|
7.1--11.7
|
8.3
|
7.0--9.9
|
|
2.2
|
1.2--3.9
|
3.6
|
2.5--5.1
|
3.1
|
2.4--4.1
|
|
Wisconsin
|
4.7
|
3.6--6.2
|
5.7
|
4.4--7.4
|
5.2
|
4.2--6.5
|
|
1.2
|
0.7--2.2
|
2.2
|
1.5--3.2
|
1.7
|
1.2--2.5
|
|
Wyoming
|
6.9
|
5.5--8.5
|
9.7
|
8.1--11.7
|
8.4
|
7.2--9.8
|
|
2.3
|
1.7--3.2
|
4.4
|
3.5--5.5
|
3.4
|
2.8--4.1
|
|
Median
|
5.1
|
7.4
|
6.3
|
|
1.9
|
3.6
|
2.8
|
|
Range
|
2.6--12.5
|
3.7--13.1
|
3.8--12.8
|
|
0.8--5.1
|
1.6--6.2
|
1.7--5.6
|
|
Local surveys
|
|
|
|
|
|
|
|
|
|
|
|
|
|
|
Boston, MA
|
1.8
|
1.0--3.3
|
3.7
|
2.1--6.3
|
2.8
|
1.8--4.3
|
|
0.6
|
0.2--1.8
|
1.2
|
0.5--2.7
|
0.9
|
0.5--1.7
|
|
Broward County, FL
|
6.0
|
4.4--8.0
|
8.4
|
6.4--11.0
|
7.2
|
5.7--9.1
|
|
3.2
|
2.0--5.2
|
5.2
|
3.7--7.5
|
4.3
|
3.1--5.8
|
|
Charlotte-Mecklenburg, NC
|
3.6
|
2.4--5.5
|
4.3
|
2.8--6.5
|
3.9
|
2.8--5.4
|
|
---
|
---
|
---
|
---
|
---
|
---
|
|
Chicago, IL
|
4.9
|
2.9--8.1
|
7.5
|
4.2--13.1
|
6.7
|
4.3--10.1
|
|
1.8
|
0.7--4.4
|
4.1
|
2.2--7.7
|
3.4
|
2.1--5.6
|
|
Clark County, NV
|
6.0
|
4.5--8.0
|
9.4
|
6.6--13.1
|
7.7
|
5.9--10.1
|
|
---
|
---
|
---
|
---
|
---
|
---
|
|
Dallas, TX
|
9.1
|
6.6--12.6
|
10.8
|
7.5--15.5
|
10.0
|
7.7--12.8
|
|
3.3
|
2.1--5.1
|
5.4
|
3.2--8.8
|
4.3
|
2.9--6.3
|
|
Detroit, MI
|
3.0
|
1.9--4.7
|
6.8
|
4.9--9.3
|
4.9
|
3.6--6.7
|
|
1.8
|
1.0--3.3
|
3.8
|
2.6--5.6
|
2.8
|
2.0--4.1
|
|
Duval County, FL
|
5.7
|
4.4--7.5
|
8.6
|
6.7--11.1
|
7.4
|
6.0--9.1
|
|
2.5
|
1.6--3.8
|
5.6
|
3.9--8.0
|
4.3
|
3.1--5.9
|
|
Los Angeles, CA
|
8.5
|
6.0--12.0
|
10.8
|
8.3--14.0
|
9.7
|
7.5--12.3
|
|
3.0
|
1.9--4.5
|
4.3
|
2.6--7.1
|
3.6
|
2.5--5.3
|
|
Memphis, TN
|
1.8
|
0.9--3.6
|
2.5
|
1.4--4.3
|
2.1
|
1.4--3.2
|
|
1.5
|
0.6--3.5
|
1.6
|
0.8--3.5
|
1.5
|
0.9--2.6
|
|
Miami-Dade County, FL
|
6.3
|
4.8--8.2
|
10.2
|
8.1--12.8
|
8.3
|
6.9--10.0
|
|
2.9
|
2.0--4.2
|
5.7
|
4.2--7.8
|
4.4
|
3.4--5.7
|
|
Milwaukee, WI
|
3.9
|
2.8--5.4
|
6.6
|
4.7--9.2
|
5.3
|
4.1--6.7
|
|
1.5
|
0.9--2.6
|
3.9
|
2.6--6.0
|
2.8
|
2.0--3.9
|
|
New York City, NY
|
3.0
|
2.4--3.7
|
5.7
|
4.8--6.7
|
4.2
|
3.7--4.9
|
|
---
|
---
|
---
|
---
|
---
|
---
|
|
Orange County, FL
|
5.0
|
3.3--7.3
|
6.8
|
4.6--9.9
|
5.9
|
4.5--7.6
|
|
2.1
|
1.1--3.8
|
3.3
|
2.0--5.4
|
2.7
|
1.9--3.7
|
|
Palm Beach County, FL
|
5.3
|
4.0--6.9
|
6.7
|
5.4--8.4
|
6.2
|
5.2--7.3
|
|
2.0
|
1.4--2.8
|
4.0
|
2.9--5.5
|
3.1
|
2.5--3.9
|
|
Philadelphia, PA
|
2.0
|
1.2--3.3
|
6.3
|
3.1--12.5
|
4.1
|
2.4--7.0
|
|
1.4
|
0.8--2.5
|
2.6
|
0.9--7.2
|
2.1
|
1.1--4.0
|
|
San Bernardino, CA
|
6.0
|
4.2--8.5
|
11.2
|
9.0--13.9
|
8.6
|
7.1--10.4
|
|
1.9
|
1.0--3.5
|
5.9
|
4.3--8.1
|
3.9
|
2.9--5.3
|
|
San Diego, CA
|
6.1
|
4.6--8.1
|
9.0
|
6.9--11.7
|
7.6
|
6.3--9.1
|
|
2.2
|
1.4--3.4
|
4.2
|
3.0--5.9
|
3.2
|
2.4--4.2
|
|
San Francisco, CA
|
4.1
|
2.9--5.8
|
6.3
|
5.0--8.0
|
5.3
|
4.2--6.7
|
|
2.1
|
1.2--3.6
|
3.2
|
2.4--4.4
|
3.0
|
2.2--4.1
|
|
Seattle, WA
|
3.9
|
2.8--5.6
|
5.7
|
4.1--7.9
|
5.0
|
4.0--6.2
|
|
1.3
|
0.8--2.2
|
3.1
|
2.1--4.6
|
2.5
|
1.8--3.4
|
|
Median
|
4.9
|
6.8
|
6.0
|
|
2.0
|
4.0
|
3.1
|
|
Range
|
1.8--9.1
|
2.5--11.2
|
2.1--10.0
|
|
0.6--3.3
|
1.2--5.9
|
0.9--4.4
|
|
|
Ever used inhalants
|
|
Ever used ecstasy
|
|
|
Female
|
Male
|
Total
|
|
Female
|
Male
|
Total
|
|
Category
|
%
|
CI§
|
%
|
CI
|
%
|
CI
|
|
%
|
CI
|
%
|
CI
|
%
|
CI
|
|
Race/Ethnicity
|
|
|
|
|
|
|
|
|
|
|
|
|
|
|
White¶
|
12.8
|
11.2--14.5
|
10.4
|
8.6--12.7
|
11.5
|
10.1--13.1
|
|
5.3
|
4.3--6.7
|
7.4
|
5.9--9.2
|
6.4
|
5.4--7.6
|
|
Black¶
|
9.4
|
6.6--13.1
|
7.1
|
5.6--9.1
|
8.2
|
6.7--10.1
|
|
3.8
|
2.5--5.7
|
6.5
|
4.8--8.9
|
5.1
|
3.9--6.7
|
|
Hispanic
|
15.3
|
13.2--17.6
|
12.8
|
10.4--15.8
|
14.0
|
12.1--16.2
|
|
7.5
|
6.3--8.9
|
8.9
|
7.1--11.0
|
8.2
|
7.1--9.5
|
|
Grade
|
|
|
|
|
|
|
|
|
|
|
|
|
|
|
9
|
16.7
|
14.5--19.2
|
9.7
|
7.7--12.3
|
13.0
|
11.2--15.0
|
|
4.6
|
3.7--5.8
|
5.2
|
4.0--6.8
|
4.9
|
4.1--5.9
|
|
10
|
13.1
|
11.3--15.1
|
12.0
|
10.0--14.3
|
12.5
|
11.1--14.2
|
|
4.6
|
3.4--6.2
|
5.7
|
4.2--7.8
|
5.2
|
4.1--6.6
|
|
11
|
11.5
|
9.5--13.9
|
11.6
|
9.5--14.0
|
11.5
|
10.2--13.1
|
|
6.9
|
5.5--8.5
|
10.3
|
8.3--12.8
|
8.7
|
7.3--10.3
|
|
12
|
9.3
|
8.0--10.8
|
8.9
|
7.4--10.8
|
9.1
|
8.0--10.3
|
|
6.0
|
4.6--7.8
|
9.9
|
8.1--12.2
|
8.0
|
6.7--9.5
|
|
Total
|
12.9
|
11.8--14.0
|
10.6
|
9.2--12.1
|
11.7
|
10.6--12.8
|
|
5.5
|
4.7--6.4
|
7.6
|
6.4--9.1
|
6.7
|
5.8--7.6
|
|
|
Ever used inhalants
|
|
Ever used ecstasy
|
|
|
Female
|
Male
|
Total
|
|
Female
|
Male
|
Total
|
|
Site
|
%
|
CI§
|
%
|
CI
|
%
|
CI
|
|
%
|
CI
|
%
|
CI
|
%
|
CI
|
|
State surveys
|
|
|
|
|
|
|
|
|
|
|
|
|
|
|
Alabama
|
9.3
|
6.9--12.4
|
14.1
|
11.4--17.2
|
11.9
|
9.7--14.5
|
|
4.5
|
3.1--6.5
|
9.3
|
6.7--12.7
|
7.1
|
5.1--9.7
|
|
Alaska
|
10.6
|
8.4--13.4
|
8.7
|
6.9--10.9
|
9.8
|
8.3--11.6
|
|
6.3
|
4.4--9.0
|
7.3
|
4.9--10.6
|
7.1
|
5.5--9.1
|
|
Arizona
|
15.1
|
12.2--18.6
|
12.1
|
10.3--14.2
|
13.9
|
11.8--16.2
|
|
---¶
|
---
|
---
|
---
|
---
|
---
|
|
Arkansas
|
16.2
|
13.3--19.5
|
17.3
|
14.6--20.5
|
16.8
|
14.4--19.4
|
|
9.7
|
6.8--13.4
|
12.3
|
9.4--16.1
|
11.0
|
8.9--13.5
|
|
Colorado
|
9.9
|
7.1--13.6
|
8.6
|
5.8--12.7
|
9.2
|
6.9--12.3
|
|
9.1
|
7.0--11.7
|
11.4
|
8.4--15.1
|
10.2
|
8.3--12.6
|
|
Connecticut
|
10.2
|
8.4--12.2
|
10.7
|
8.8--13.1
|
10.6
|
9.3--12.1
|
|
3.6
|
2.4--5.5
|
6.2
|
4.6--8.3
|
5.0
|
3.9--6.4
|
|
Delaware
|
11.6
|
9.6--13.9
|
10.4
|
8.6--12.6
|
11.1
|
9.7--12.8
|
|
5.7
|
4.3--7.5
|
7.1
|
5.5--9.2
|
6.6
|
5.4--8.0
|
|
Florida
|
---
|
---
|
---
|
---
|
---
|
---
|
|
6.3
|
5.4--7.4
|
8.7
|
7.8--9.8
|
7.6
|
6.9--8.3
|
|
Georgia
|
9.6
|
7.8--11.8
|
13.6
|
10.4--17.6
|
11.6
|
9.7--13.9
|
|
4.4
|
3.0--6.4
|
8.5
|
6.8--10.7
|
6.5
|
5.2--8.0
|
|
Hawaii
|
10.8
|
7.8--14.8
|
9.1
|
6.6--12.6
|
10.1
|
8.4--12.1
|
|
7.9
|
4.7--13.0
|
8.3
|
6.4--10.7
|
8.2
|
6.4--10.5
|
|
Idaho
|
14.4
|
12.2--16.9
|
10.9
|
9.0--13.2
|
12.6
|
11.1--14.3
|
|
5.2
|
3.8--7.1
|
6.8
|
5.0--9.2
|
6.1
|
4.8--7.8
|
|
Illinois
|
11.5
|
8.9--14.7
|
11.4
|
9.5--13.7
|
11.6
|
9.7--13.7
|
|
5.1
|
3.6--7.2
|
8.9
|
7.0--11.4
|
7.2
|
5.6--9.3
|
|
Indiana
|
18.0
|
15.2--21.1
|
14.1
|
11.5--17.2
|
16.0
|
13.8--18.4
|
|
7.7
|
5.6--10.6
|
8.8
|
6.6--11.6
|
8.2
|
6.3--10.7
|
|
Kansas
|
10.6
|
8.0--13.9
|
9.4
|
7.4--11.8
|
10.0
|
8.4--11.8
|
|
5.2
|
3.8--7.1
|
6.8
|
5.1--9.0
|
6.0
|
4.7--7.6
|
|
Kentucky
|
13.2
|
10.3--16.8
|
13.6
|
10.4--17.5
|
13.4
|
10.9--16.2
|
|
5.5
|
3.7--8.3
|
8.2
|
5.4--12.1
|
6.9
|
5.0--9.4
|
|
Louisiana
|
11.3
|
8.8--14.4
|
13.5
|
9.6--18.7
|
12.4
|
10.0--15.4
|
|
7.3
|
4.8--11.1
|
11.8
|
7.2--18.8
|
9.5
|
7.4--12.2
|
|
Maine
|
14.8
|
13.7--16.0
|
14.3
|
13.2--15.5
|
14.8
|
13.9--15.6
|
|
---
|
---
|
---
|
---
|
---
|
---
|
|
Maryland
|
11.3
|
8.8--14.4
|
10.6
|
8.4--13.2
|
11.0
|
9.3--13.0
|
|
4.7
|
3.0--7.1
|
7.7
|
6.1--9.7
|
6.4
|
5.3--7.8
|
|
Massachusetts
|
---
|
---
|
---
|
---
|
---
|
---
|
|
4.1
|
2.7--6.3
|
7.6
|
5.7--10.1
|
5.9
|
4.5--7.8
|
|
Michigan
|
14.4
|
12.2--16.9
|
14.1
|
12.0--16.5
|
14.4
|
12.6--16.5
|
|
---
|
---
|
---
|
---
|
---
|
---
|
|
Mississippi
|
10.2
|
8.3--12.6
|
9.2
|
7.3--11.5
|
9.7
|
8.1--11.7
|
|
5.0
|
3.9--6.4
|
5.4
|
3.9--7.3
|
5.3
|
4.4--6.3
|
|
Missouri
|
10.9
|
9.1--12.9
|
9.6
|
6.9--13.1
|
10.2
|
8.1--12.8
|
|
4.4
|
3.1--6.2
|
6.9
|
4.2--11.3
|
5.7
|
3.8--8.6
|
|
Montana
|
15.7
|
12.3--19.8
|
12.8
|
9.2--17.5
|
14.2
|
11.1--18.0
|
|
5.2
|
3.7--7.4
|
9.1
|
7.1--11.6
|
7.3
|
5.7--9.2
|
|
Nevada
|
15.0
|
12.8--17.4
|
10.7
|
8.8--12.9
|
12.8
|
11.2--14.6
|
|
---
|
---
|
---
|
---
|
---
|
---
|
|
New Hampshire
|
13.6
|
10.1--18.0
|
10.2
|
7.6--13.4
|
11.9
|
9.7--14.5
|
|
6.3
|
3.8--10.1
|
7.1
|
4.8--10.2
|
6.8
|
5.1--9.1
|
|
New Jersey
|
9.5
|
7.0--12.8
|
9.9
|
7.5--13.1
|
9.7
|
8.3--11.5
|
|
3.6
|
2.3--5.6
|
6.1
|
4.6--8.2
|
5.0
|
3.7--6.8
|
|
New Mexico
|
---
|
---
|
---
|
---
|
---
|
---
|
|
13.9
|
11.3--17.0
|
14.3
|
12.0--16.9
|
14.1
|
12.1--16.4
|
|
New York
|
10.5
|
8.4--13.2
|
10.3
|
8.0--13.1
|
10.8
|
9.1--12.9
|
|
4.2
|
2.8--6.1
|
7.2
|
5.3--9.6
|
5.8
|
4.4--7.7
|
|
North Carolina
|
11.4
|
10.0--12.9
|
12.1
|
10.3--14.2
|
11.7
|
10.6--12.9
|
|
4.1
|
2.9--5.9
|
6.7
|
5.3--8.3
|
5.4
|
4.3--6.8
|
|
North Dakota
|
13.2
|
10.3--16.7
|
9.7
|
7.6--12.2
|
11.5
|
9.6--13.6
|
|
4.7
|
3.0--7.2
|
5.7
|
4.0--7.9
|
5.3
|
4.0--6.9
|
|
Oklahoma
|
14.2
|
11.8--17.1
|
11.4
|
8.9--14.4
|
12.7
|
11.2--14.4
|
|
6.2
|
4.3--8.8
|
9.8
|
7.1--13.5
|
8.1
|
6.2--10.4
|
|
Pennsylvania
|
11.4
|
9.2--14.1
|
9.1
|
6.9--11.9
|
10.3
|
8.6--12.4
|
|
3.9
|
2.4--6.1
|
6.2
|
4.7--8.2
|
5.1
|
3.8--6.7
|
|
Rhode Island
|
9.0
|
6.6--12.2
|
8.4
|
6.7--10.4
|
8.7
|
6.9--11.0
|
|
4.8
|
3.7--6.3
|
6.8
|
5.3--8.7
|
5.9
|
4.8--7.1
|
|
South Carolina
|
8.3
|
6.3--10.8
|
12.9
|
9.5--17.2
|
10.6
|
8.6--13.0
|
|
5.3
|
3.1--8.7
|
9.5
|
7.3--12.4
|
7.4
|
5.7--9.6
|
|
South Dakota
|
11.6
|
8.0--16.3
|
9.3
|
7.3--11.8
|
10.4
|
8.7--12.4
|
|
---
|
---
|
---
|
---
|
---
|
---
|
|
Tennessee
|
12.3
|
10.3--14.8
|
11.9
|
9.6--14.7
|
12.2
|
10.4--14.1
|
|
4.3
|
3.1--5.8
|
7.1
|
5.3--9.4
|
5.7
|
4.7--6.9
|
|
Texas
|
12.8
|
10.5--15.4
|
11.1
|
9.6--12.9
|
11.9
|
10.3--13.8
|
|
8.2
|
7.1--9.5
|
9.7
|
7.9--11.9
|
9.0
|
7.9--10.2
|
|
Utah
|
9.6
|
7.3--12.6
|
10.7
|
8.4--13.6
|
10.4
|
8.5--12.6
|
|
5.5
|
3.8--7.8
|
8.8
|
6.6--11.7
|
7.4
|
6.0--9.2
|
|
Vermont
|
---
|
---
|
---
|
---
|
---
|
---
|
|
---
|
---
|
---
|
---
|
---
|
---
|
|
West Virginia
|
16.2
|
13.3--19.6
|
13.7
|
11.1--16.7
|
15.3
|
13.0--17.8
|
|
5.8
|
4.2--7.9
|
7.3
|
5.5--9.7
|
6.8
|
5.5--8.4
|
|
Wisconsin
|
10.1
|
8.0--12.8
|
9.0
|
7.5--10.6
|
9.6
|
8.0--11.3
|
|
3.8
|
2.7--5.4
|
5.8
|
4.4--7.5
|
4.9
|
4.1--5.9
|
|
Wyoming
|
15.8
|
13.7--18.1
|
16.1
|
13.8--18.7
|
15.9
|
14.3--17.7
|
|
6.8
|
5.4--8.5
|
10.8
|
8.9--13.1
|
8.9
|
7.7--10.4
|
|
Median
|
11.4
|
10.8
|
11.6
|
|
5.2
|
7.6
|
6.8
|
|
Range
|
8.3--18.0
|
8.4--17.3
|
8.7--16.8
|
|
3.6--13.9
|
5.4--14.3
|
4.9--14.1
|
|
Local surveys
|
|
|
|
|
|
|
|
|
|
|
|
|
|
|
Boston, MA
|
6.3
|
4.2--9.3
|
5.6
|
3.7--8.3
|
6.0
|
4.4--8.2
|
|
1.9
|
0.9--4.0
|
4.1
|
2.2--7.2
|
3.0
|
1.8--4.8
|
|
Broward County, FL
|
9.9
|
7.3--13.2
|
10.2
|
7.5--13.7
|
10.0
|
7.6--13.0
|
|
8.0
|
6.1--10.6
|
10.2
|
8.4--12.4
|
9.1
|
7.7--10.8
|
|
Charlotte-Mecklenburg, NC
|
11.3
|
9.3--13.6
|
10.3
|
7.9--13.5
|
10.8
|
9.3--12.5
|
|
4.6
|
3.3--6.4
|
6.7
|
4.7--9.4
|
5.6
|
4.3--7.4
|
|
Chicago, IL
|
9.7
|
6.8--13.5
|
8.9
|
6.3--12.3
|
9.9
|
7.9--12.4
|
|
4.0
|
2.3--6.9
|
7.3
|
5.3--10.0
|
6.5
|
4.6--9.0
|
|
Clark County, NV
|
14.4
|
11.9--17.4
|
10.4
|
8.3--13.0
|
12.4
|
10.5--14.5
|
|
---
|
---
|
---
|
---
|
---
|
---
|
|
Dallas, TX
|
9.4
|
6.5--13.5
|
11.0
|
7.9--15.1
|
10.2
|
8.0--12.8
|
|
5.5
|
3.8--7.9
|
10.4
|
7.1--15.0
|
8.1
|
6.2--10.5
|
|
Detroit, MI
|
11.3
|
9.0--14.2
|
12.8
|
9.9--16.4
|
12.1
|
9.7--14.8
|
|
---
|
---
|
---
|
---
|
---
|
---
|
|
Duval County, FL
|
13.9
|
11.5--16.7
|
14.1
|
11.5--17.1
|
14.3
|
12.4--16.5
|
|
8.4
|
6.6--10.6
|
12.3
|
10.2--14.9
|
10.9
|
9.2--12.8
|
|
Los Angeles, CA
|
18.9
|
16.3--21.9
|
14.9
|
11.9--18.5
|
16.9
|
15.2--18.8
|
|
10.0
|
7.2--13.7
|
11.9
|
9.6--14.7
|
11.0
|
8.6--14.0
|
|
Memphis, TN
|
7.6
|
5.3--10.8
|
6.6
|
5.0--8.8
|
7.2
|
5.7--9.1
|
|
2.1
|
1.1--3.9
|
5.5
|
3.6--8.3
|
3.8
|
2.7--5.3
|
|
Miami-Dade County, FL
|
8.9
|
6.7--11.9
|
9.3
|
7.2--12.0
|
9.1
|
7.3--11.4
|
|
8.2
|
6.6--10.0
|
12.3
|
10.2--14.7
|
10.3
|
8.9--11.9
|
|
Milwaukee, WI
|
8.4
|
6.6--10.8
|
9.8
|
7.1--13.5
|
9.2
|
7.4--11.5
|
|
6.8
|
5.0--9.3
|
11.0
|
8.7--13.9
|
9.0
|
7.4--10.9
|
|
New York City, NY
|
10.6
|
9.4--11.8
|
8.8
|
7.8--9.8
|
9.7
|
9.0--10.5
|
|
3.2
|
2.5--4.1
|
5.7
|
4.9--6.6
|
4.4
|
3.7--5.1
|
|
Orange County, FL
|
10.9
|
8.7--13.6
|
9.9
|
7.8--12.5
|
10.4
|
9.1--11.9
|
|
5.0
|
3.4--7.4
|
7.9
|
5.9--10.5
|
6.5
|
5.2--8.2
|
|
Palm Beach County, FL
|
10.2
|
8.6--11.9
|
7.4
|
5.8--9.5
|
9.0
|
7.7--10.4
|
|
6.9
|
5.4--8.9
|
8.6
|
7.1--10.5
|
7.9
|
6.7--9.4
|
|
Philadelphia, PA
|
8.4
|
6.2--11.2
|
9.0
|
5.7--13.9
|
8.9
|
7.1--11.2
|
|
2.8
|
1.7--4.5
|
4.8
|
2.6--8.7
|
4.1
|
2.8--5.9
|
|
San Bernardino, CA
|
18.8
|
15.7--22.3
|
19.1
|
15.7--23.2
|
18.9
|
16.5--21.6
|
|
8.3
|
6.1--11.3
|
16.9
|
13.9--20.3
|
12.6
|
10.5--15.1
|
|
San Diego, CA
|
12.1
|
9.7--15.0
|
9.3
|
7.4--11.7
|
10.7
|
9.1--12.4
|
|
9.5
|
7.9--11.5
|
10.8
|
8.6--13.5
|
10.2
|
8.7--11.8
|
|
San Francisco, CA
|
8.3
|
6.4--10.7
|
7.0
|
5.6--8.7
|
8.1
|
6.8--9.5
|
|
7.9
|
6.3--10.0
|
8.5
|
6.5--11.0
|
8.6
|
7.3--10.0
|
|
Seattle, WA
|
7.8
|
6.0--10.1
|
7.8
|
5.9--10.1
|
8.1
|
6.7--9.9
|
|
7.0
|
5.5--9.0
|
7.6
|
5.7--10.0
|
7.6
|
6.1--9.3
|
|
Median
|
10.0
|
9.5
|
9.9
|
|
6.8
|
8.5
|
8.0
|
|
Range
|
6.3--18.9
|
5.6--19.1
|
6.0--18.9
|
|
1.9--10.0
|
4.1--16.9
|
3.0--12.6
|
|
|
Ever used heroin
|
|
Ever used methamphetamines
|
|
|
Female
|
Male
|
Total
|
|
Female
|
Male
|
Total
|
|
Category
|
%
|
CI§
|
%
|
CI
|
%
|
CI
|
|
%
|
CI
|
%
|
CI
|
%
|
CI
|
|
Race/Ethnicity
|
|
|
|
|
|
|
|
|
|
|
|
|
|
|
White¶
|
1.6
|
1.1--2.3
|
2.7
|
2.1--3.6
|
2.2
|
1.8--2.7
|
|
3.2
|
2.5--4.1
|
4.2
|
3.3--5.5
|
3.7
|
3.1--4.5
|
|
Black¶
|
0.7
|
0.3--1.6
|
3.6
|
2.3--5.7
|
2.2
|
1.3--3.5
|
|
1.0
|
0.5--1.9
|
4.5
|
2.8--7.0
|
2.7
|
1.7--4.3
|
|
Hispanic
|
2.9
|
1.9--4.5
|
3.6
|
2.7--4.8
|
3.3
|
2.6--4.1
|
|
5.2
|
3.8--7.0
|
6.1
|
4.6--8.2
|
5.7
|
4.5--7.1
|
|
Grade
|
|
|
|
|
|
|
|
|
|
|
|
|
|
|
9
|
1.4
|
0.8--2.3
|
2.7
|
1.9--3.8
|
2.1
|
1.6--2.8
|
|
3.3
|
2.3--4.6
|
3.3
|
2.4--4.5
|
3.3
|
2.6--4.1
|
|
10
|
1.5
|
0.9--2.4
|
2.8
|
2.0--3.9
|
2.2
|
1.7--2.9
|
|
2.8
|
2.0--3.9
|
4.5
|
3.5--5.7
|
3.7
|
3.1--4.5
|
|
11
|
2.2
|
1.5--3.2
|
4.1
|
2.9--5.8
|
3.2
|
2.5--4.0
|
|
4.5
|
3.2--6.2
|
5.9
|
4.6--7.5
|
5.2
|
4.3--6.2
|
|
12
|
1.6
|
1.0--2.6
|
3.3
|
2.2--4.8
|
2.5
|
1.8--3.4
|
|
2.7
|
1.9--3.7
|
5.4
|
4.5--6.6
|
4.1
|
3.5--4.8
|
|
Total
|
1.7
|
1.3--2.1
|
3.2
|
2.6--3.9
|
2.5
|
2.2--2.9
|
|
3.3
|
2.7--4.0
|
4.7
|
4.0--5.5
|
4.1
|
3.6--4.6
|
|
|
Ever used heroin
|
|
Ever used methamphetamines
|
|
|
Female
|
Male
|
Total
|
|
Female
|
Male
|
Total
|
|
Site
|
%
|
CI§
|
%
|
CI
|
%
|
CI
|
|
%
|
CI
|
%
|
CI
|
%
|
CI
|
|
State surveys
|
|
|
|
|
|
|
|
|
|
|
|
|
|
|
Alabama
|
1.8
|
0.8--4.2
|
5.4
|
3.4--8.5
|
3.7
|
2.3--5.7
|
|
2.6
|
1.5--4.7
|
7.7
|
5.8--10.1
|
5.3
|
3.8--7.4
|
|
Alaska
|
2.3
|
1.3--4.1
|
3.6
|
2.5--5.3
|
3.3
|
2.4--4.5
|
|
2.8
|
1.8--4.3
|
3.8
|
2.7--5.5
|
3.6
|
2.8--4.5
|
|
Arizona
|
2.6
|
1.8--3.9
|
3.8
|
2.5--5.6
|
3.5
|
2.6--4.8
|
|
5.3
|
4.0--7.0
|
5.5
|
4.2--7.4
|
5.7
|
4.5--7.1
|
|
Arkansas
|
3.9
|
2.2--6.6
|
7.0
|
4.6--10.6
|
5.4
|
3.7--8.0
|
|
4.5
|
2.7--7.4
|
7.5
|
5.5--10.2
|
6.0
|
4.6--7.9
|
|
Colorado
|
2.1
|
1.1--4.1
|
4.1
|
2.5--6.7
|
3.2
|
2.0--4.9
|
|
2.8
|
1.7--4.6
|
4.1
|
2.9--5.8
|
3.5
|
2.7--4.6
|
|
Connecticut
|
2.0
|
1.2--3.4
|
4.1
|
2.8--5.9
|
3.2
|
2.4--4.3
|
|
1.8
|
1.1--3.1
|
4.4
|
3.1--6.2
|
3.3
|
2.5--4.4
|
|
Delaware
|
2.1
|
1.3--3.3
|
2.7
|
1.8--4.0
|
2.5
|
1.9--3.4
|
|
3.5
|
2.6--4.9
|
4.0
|
2.9--5.6
|
4.0
|
3.2--5.0
|
|
Florida
|
---¶
|
---
|
---
|
---
|
---
|
---
|
|
---
|
---
|
---
|
---
|
---
|
---
|
|
Georgia
|
2.1
|
1.4--3.1
|
5.4
|
3.7--7.7
|
3.8
|
2.8--5.1
|
|
3.4
|
2.3--4.8
|
5.8
|
3.9--8.5
|
4.6
|
3.4--6.1
|
|
Hawaii
|
---
|
---
|
---
|
---
|
---
|
---
|
|
3.2
|
1.7--6.1
|
4.3
|
2.9--6.4
|
3.9
|
2.7--5.6
|
|
Idaho
|
2.3
|
1.6--3.4
|
2.7
|
1.7--4.1
|
2.5
|
1.9--3.4
|
|
3.0
|
2.2--4.1
|
3.1
|
1.9--5.0
|
3.1
|
2.3--4.2
|
|
Illinois
|
1.7
|
1.0--3.0
|
4.0
|
3.0--5.3
|
3.0
|
2.2--4.0
|
|
3.1
|
2.1--4.7
|
4.1
|
3.1--5.5
|
3.8
|
2.8--5.0
|
|
Indiana
|
1.8
|
1.0--3.2
|
3.4
|
2.2--5.3
|
2.6
|
1.9--3.6
|
|
3.4
|
2.3--4.9
|
4.8
|
3.1--7.3
|
4.1
|
2.8--5.8
|
|
Kansas
|
1.4
|
0.7--2.6
|
3.3
|
2.2--4.9
|
2.4
|
1.6--3.4
|
|
4.1
|
2.4--6.9
|
4.4
|
3.3--5.9
|
4.3
|
3.0--6.0
|
|
Kentucky
|
2.0
|
1.1--3.8
|
5.0
|
3.0--8.2
|
3.6
|
2.4--5.4
|
|
3.7
|
2.5--5.5
|
6.0
|
4.0--8.9
|
4.9
|
3.6--6.7
|
|
Louisiana
|
3.3
|
1.7--6.4
|
9.3
|
5.3--15.7
|
6.4
|
4.2--9.6
|
|
6.6
|
4.6--9.3
|
9.3
|
5.1--16.4
|
7.9
|
5.5--11.3
|
|
Maine
|
---
|
---
|
---
|
---
|
---
|
---
|
|
---
|
---
|
---
|
---
|
---
|
---
|
|
Maryland
|
1.7
|
1.1--2.7
|
5.8
|
4.5--7.5
|
4.1
|
3.3--5.0
|
|
2.1
|
1.2--3.5
|
6.0
|
4.6--7.8
|
4.3
|
3.4--5.3
|
|
Massachusetts
|
0.8
|
0.5--1.4
|
3.4
|
2.2--5.1
|
2.1
|
1.5--3.1
|
|
1.6
|
1.0--2.5
|
3.9
|
2.9--5.3
|
2.8
|
2.1--3.6
|
|
Michigan
|
3.2
|
1.8--5.6
|
6.5
|
4.7--8.7
|
5.0
|
3.5--7.2
|
|
4.1
|
2.4--7.1
|
7.7
|
5.7--10.3
|
6.2
|
4.4--8.7
|
|
Mississippi
|
2.1
|
1.3--3.3
|
1.9
|
1.1--3.2
|
2.1
|
1.4--2.9
|
|
3.1
|
1.9--4.9
|
2.3
|
1.3--4.0
|
2.8
|
2.0--3.8
|
|
Missouri
|
2.2
|
1.3--3.5
|
3.4
|
1.5--7.5
|
2.8
|
1.6--4.9
|
|
3.2
|
2.3--4.4
|
4.1
|
2.5--6.8
|
3.7
|
2.5--5.3
|
|
Montana
|
1.8
|
0.8--4.1
|
4.1
|
2.1--7.9
|
3.0
|
1.5--5.9
|
|
2.2
|
0.9--5.1
|
3.9
|
2.4--6.1
|
3.1
|
1.9--4.9
|
|
Nevada
|
---
|
---
|
---
|
---
|
---
|
---
|
|
5.2
|
3.9--6.9
|
6.4
|
4.7--8.5
|
5.9
|
4.8--7.2
|
|
New Hampshire
|
2.3
|
1.2--4.1
|
3.4
|
2.1--5.4
|
3.0
|
2.1--4.3
|
|
5.0
|
3.4--7.3
|
4.2
|
3.0--5.9
|
4.7
|
3.6--6.0
|
|
New Jersey
|
1.1
|
0.6--2.0
|
2.6
|
1.5--4.6
|
1.9
|
1.3--2.7
|
|
1.6
|
0.9--2.9
|
2.8
|
1.6--5.0
|
2.3
|
1.5--3.5
|
|
New Mexico
|
3.6
|
2.6--4.8
|
5.8
|
4.1--7.9
|
4.7
|
3.6--6.1
|
|
6.0
|
5.1--7.2
|
6.4
|
4.6--9.0
|
6.3
|
5.0--7.8
|
|
New York
|
2.3
|
1.4--3.7
|
5.1
|
3.7--7.0
|
3.9
|
2.8--5.4
|
|
2.8
|
1.8--4.2
|
5.9
|
4.1--8.4
|
4.8
|
3.4--6.6
|
|
North Carolina
|
1.7
|
0.9--3.2
|
3.3
|
2.3--4.6
|
2.5
|
1.8--3.6
|
|
2.2
|
1.3--3.8
|
4.6
|
3.5--6.1
|
3.4
|
2.5--4.5
|
|
North Dakota
|
---
|
---
|
---
|
---
|
---
|
---
|
|
3.2
|
1.9--5.3
|
3.5
|
2.3--5.1
|
3.4
|
2.4--4.7
|
|
Oklahoma
|
0.7
|
0.3--2.0
|
3.7
|
2.1--6.7
|
2.3
|
1.3--3.9
|
|
4.0
|
2.2--7.2
|
5.5
|
3.7--8.2
|
4.8
|
3.2--7.1
|
|
Pennsylvania
|
1.5
|
0.9--2.4
|
3.4
|
2.2--5.2
|
2.5
|
1.7--3.5
|
|
2.8
|
1.9--3.9
|
4.3
|
3.0--6.1
|
3.5
|
2.7--4.6
|
|
Rhode Island
|
---
|
---
|
---
|
---
|
---
|
---
|
|
---
|
---
|
---
|
---
|
---
|
---
|
|
South Carolina
|
1.4
|
0.5--3.9
|
4.3
|
3.0--6.2
|
2.9
|
2.0--4.3
|
|
2.2
|
1.2--4.1
|
4.1
|
2.9--5.9
|
3.2
|
2.2--4.6
|
|
South Dakota
|
---
|
---
|
---
|
---
|
---
|
---
|
|
2.7
|
1.4--5.1
|
2.8
|
1.9--4.1
|
2.7
|
1.8--4.2
|
|
Tennessee
|
0.8
|
0.4--1.8
|
3.5
|
2.3--5.4
|
2.2
|
1.4--3.3
|
|
2.4
|
1.5--3.6
|
3.6
|
2.5--5.1
|
3.0
|
2.2--4.1
|
|
Texas
|
1.2
|
0.8--1.8
|
3.0
|
2.1--4.3
|
2.1
|
1.7--2.7
|
|
3.2
|
2.4--4.3
|
4.2
|
3.3--5.4
|
3.7
|
3.1--4.4
|
|
Utah
|
1.9
|
1.0--3.5
|
4.0
|
2.5--6.3
|
3.2
|
2.4--4.2
|
|
3.4
|
1.9--6.2
|
4.1
|
2.6--6.4
|
3.9
|
2.8--5.5
|
|
Vermont
|
2.1
|
1.7--2.6
|
4.1
|
3.3--5.1
|
3.2
|
2.8--3.8
|
|
2.8
|
2.2--3.5
|
4.6
|
3.8--5.6
|
3.8
|
3.3--4.4
|
|
West Virginia
|
3.2
|
1.8--5.5
|
4.8
|
3.4--6.7
|
4.4
|
3.4--5.7
|
|
5.5
|
3.6--8.3
|
6.9
|
5.4--9.0
|
6.5
|
5.1--8.1
|
|
Wisconsin
|
1.4
|
0.8--2.5
|
2.3
|
1.5--3.5
|
1.9
|
1.4--2.7
|
|
2.9
|
2.0--4.2
|
3.6
|
2.6--4.9
|
3.3
|
2.6--4.2
|
|
Wyoming
|
2.6
|
1.9--3.6
|
5.6
|
4.5--6.8
|
4.2
|
3.5--5.0
|
|
3.3
|
2.5--4.3
|
6.3
|
5.1--7.8
|
4.9
|
4.1--5.9
|
|
Median
|
2.0
|
4.0
|
3.0
|
|
3.2
|
4.3
|
3.9
|
|
Range
|
0.7--3.9
|
1.9--9.3
|
1.9--6.4
|
|
1.6--6.6
|
2.3--9.3
|
2.3--7.9
|
|
Local surveys
|
|
|
|
|
|
|
|
|
|
|
|
|
|
|
Boston, MA
|
1.2
|
0.4--3.7
|
2.0
|
1.1--3.8
|
1.7
|
0.9--3.2
|
|
1.5
|
0.6--3.9
|
3.1
|
1.6--6.1
|
2.3
|
1.3--4.2
|
|
Broward County, FL
|
3.1
|
1.5--6.2
|
5.9
|
3.8--9.1
|
4.5
|
2.9--7.1
|
|
3.9
|
2.2--7.1
|
7.4
|
5.1--10.6
|
5.7
|
3.9--8.2
|
|
Charlotte-Mecklenburg, NC
|
---
|
---
|
---
|
---
|
---
|
---
|
|
2.2
|
1.2--3.7
|
3.8
|
2.3--6.2
|
3.1
|
2.1--4.6
|
|
Chicago, IL
|
1.9
|
1.0--3.5
|
6.8
|
4.0--11.3
|
4.7
|
3.0--7.2
|
|
2.1
|
0.9--4.9
|
5.5
|
3.2--9.3
|
4.3
|
2.6--6.9
|
|
Clark County, NV
|
---
|
---
|
---
|
---
|
---
|
---
|
|
5.0
|
3.5--7.2
|
6.8
|
4.8--9.6
|
5.9
|
4.5--7.8
|
|
Dallas, TX
|
1.2
|
0.5--2.6
|
3.7
|
2.0--6.5
|
2.4
|
1.5--3.9
|
|
3.2
|
1.9--5.3
|
6.0
|
3.6--9.9
|
4.6
|
3.3--6.4
|
|
Detroit, MI
|
8.8
|
6.4--11.9
|
12.9
|
8.4--19.3
|
11.1
|
7.8--15.5
|
|
9.2
|
6.7--12.6
|
14.7
|
9.9--21.2
|
12.2
|
8.8--16.5
|
|
Duval County, FL
|
---
|
---
|
---
|
---
|
---
|
---
|
|
4.3
|
3.1--5.7
|
8.6
|
6.6--11.2
|
6.9
|
5.5--8.6
|
|
Los Angeles, CA
|
1.6
|
1.0--2.6
|
5.8
|
3.8--8.8
|
3.8
|
2.6--5.6
|
|
5.5
|
4.0--7.6
|
8.5
|
6.1--11.9
|
7.1
|
5.5--9.2
|
|
Memphis, TN
|
1.2
|
0.5--3.1
|
2.8
|
1.4--5.5
|
2.0
|
1.2--3.2
|
|
1.7
|
0.9--3.2
|
3.0
|
1.6--5.6
|
2.3
|
1.5--3.7
|
|
Miami-Dade County, FL
|
2.3
|
1.3--4.1
|
4.9
|
3.2--7.6
|
3.6
|
2.4--5.4
|
|
3.1
|
2.0--4.9
|
4.9
|
3.1--7.5
|
4.0
|
2.8--5.8
|
|
Milwaukee, WI
|
2.7
|
1.6--4.5
|
6.0
|
4.3--8.4
|
4.5
|
3.3--6.0
|
|
3.2
|
2.1--5.0
|
5.4
|
3.9--7.6
|
4.5
|
3.4--5.8
|
|
New York City, NY
|
1.6
|
1.2--2.2
|
3.6
|
3.0--4.5
|
2.6
|
2.1--3.2
|
|
1.8
|
1.4--2.3
|
4.1
|
3.4--4.9
|
2.9
|
2.4--3.4
|
|
Orange County, FL
|
3.2
|
1.8--5.8
|
4.0
|
2.5--6.4
|
3.6
|
2.3--5.4
|
|
2.5
|
1.5--4.2
|
4.8
|
3.2--7.2
|
3.6
|
2.6--5.1
|
|
Palm Beach County, FL
|
2.4
|
1.5--3.8
|
4.2
|
2.9--6.1
|
3.4
|
2.6--4.6
|
|
3.1
|
2.0--4.8
|
4.5
|
3.2--6.3
|
3.9
|
3.0--5.1
|
|
Philadelphia, PA
|
0.7
|
0.3--1.7
|
6.0
|
3.2--11.2
|
3.3
|
1.8--5.8
|
|
1.8
|
0.8--3.8
|
5.9
|
3.4--10.1
|
4.0
|
2.7--5.7
|
|
San Bernardino, CA
|
1.3
|
0.6--2.7
|
4.1
|
2.6--6.3
|
2.7
|
1.9--3.8
|
|
3.5
|
2.3--5.3
|
6.6
|
4.9--8.9
|
5.1
|
4.0--6.3
|
|
San Diego, CA
|
2.0
|
1.3--3.3
|
2.7
|
1.6--4.4
|
2.4
|
1.7--3.3
|
|
3.3
|
2.2--4.8
|
4.4
|
3.1--6.3
|
3.8
|
3.0--4.9
|
|
San Francisco, CA
|
2.4
|
1.3--4.3
|
3.3
|
2.4--4.4
|
3.1
|
2.2--4.2
|
|
3.2
|
2.1--4.9
|
4.2
|
3.1--5.8
|
4.0
|
3.1--5.1
|
|
Seattle, WA
|
2.0
|
1.3--3.1
|
4.8
|
3.4--6.6
|
3.9
|
3.0--5.1
|
|
2.9
|
2.0--4.1
|
5.3
|
3.7--7.4
|
4.5
|
3.5--5.8
|
|
Median
|
2.0
|
4.2
|
3.4
|
|
3.1
|
5.3
|
4.1
|
|
Range
|
0.7--8.8
|
2.0--12.9
|
1.7--11.1
|
|
1.5--9.2
|
3.0--14.7
|
2.3--12.2
|
|
|
Ever took steroids without a doctor's prescription
|
|
Ever injected any illegal drug
|
|
|
Female
|
Male
|
Total
|
|
Female
|
Male
|
Total
|
|
Category
|
%
|
CI§
|
%
|
CI
|
%
|
CI
|
|
%
|
CI
|
%
|
CI
|
%
|
CI
|
|
Race/Ethnicity
|
|
|
|
|
|
|
|
|
|
|
|
|
|
|
White¶
|
2.1
|
1.5--2.9
|
3.9
|
3.0--5.2
|
3.1
|
2.5--3.8
|
|
1.1
|
0.7--1.6
|
2.1
|
1.5--3.0
|
1.6
|
1.2--2.1
|
|
Black¶
|
0.9
|
0.5--1.6
|
4.6
|
3.1--6.9
|
2.8
|
1.9--4.1
|
|
1.2
|
0.7--2.2
|
3.5
|
2.2--5.5
|
2.4
|
1.7--3.4
|
|
Hispanic
|
3.2
|
2.3--4.4
|
4.6
|
3.3--6.3
|
3.9
|
3.1--4.8
|
|
2.9
|
1.8--4.5
|
3.3
|
2.4--4.4
|
3.1
|
2.4--4.0
|
|
Grade
|
|
|
|
|
|
|
|
|
|
|
|
|
|
|
9
|
2.3
|
1.7--3.0
|
4.0
|
2.9--5.3
|
3.2
|
2.7--3.8
|
|
1.8
|
1.1--2.8
|
2.1
|
1.3--3.4
|
2.0
|
1.4--2.7
|
|
10
|
2.3
|
1.6--3.2
|
4.3
|
3.1--5.8
|
3.4
|
2.7--4.2
|
|
1.2
|
0.8--1.9
|
2.7
|
1.8--4.0
|
2.0
|
1.5--2.7
|
|
11
|
2.5
|
1.7--3.6
|
4.4
|
3.3--5.7
|
3.4
|
2.8--4.2
|
|
1.6
|
1.0--2.5
|
3.3
|
2.4--4.6
|
2.5
|
2.0--3.2
|
|
12
|
1.6
|
0.9--2.7
|
4.6
|
3.3--6.3
|
3.1
|
2.3--4.1
|
|
0.9
|
0.6--1.5
|
2.7
|
1.9--3.9
|
1.8
|
1.4--2.5
|
|
Total
|
2.2
|
1.8--2.7
|
4.3
|
3.5--5.2
|
3.3
|
2.9--3.8
|
|
1.4
|
1.2--1.8
|
2.7
|
2.1--3.4
|
2.1
|
1.8--2.5
|
|
|
Ever took steroids without a doctor's prescription
|
|
Ever injected any illegal drug
|
|
|
Female
|
Male
|
Total
|
|
Female
|
Male
|
Total
|
|
Site
|
%
|
CI§
|
%
|
CI
|
%
|
CI
|
|
%
|
CI
|
%
|
CI
|
%
|
CI
|
|
State surveys
|
|
|
|
|
|
|
|
|
|
|
|
|
|
|
Alabama
|
3.3
|
1.9--5.8
|
7.5
|
5.3--10.7
|
5.6
|
3.9--8.1
|
|
2.4
|
1.4--4.3
|
4.4
|
2.8--6.8
|
3.4
|
2.4--4.9
|
|
Alaska
|
---¶
|
---
|
---
|
---
|
---
|
---
|
|
2.0
|
1.1--3.5
|
2.1
|
1.2--3.8
|
2.2
|
1.5--3.4
|
|
Arizona
|
3.4
|
2.2--5.4
|
4.5
|
3.0--6.6
|
4.2
|
3.2--5.5
|
|
1.4
|
0.8--2.5
|
2.9
|
1.9--4.4
|
2.3
|
1.7--3.2
|
|
Arkansas
|
3.5
|
2.1--5.8
|
9.3
|
6.4--13.3
|
6.4
|
4.6--8.9
|
|
3.7
|
2.3--6.0
|
6.2
|
3.9--9.9
|
4.9
|
3.3--7.3
|
|
Colorado
|
2.9
|
1.8--4.7
|
4.3
|
2.8--6.4
|
3.6
|
2.6--5.0
|
|
2.1
|
1.2--3.6
|
3.1
|
1.9--5.0
|
2.7
|
1.8--3.9
|
|
Connecticut
|
1.1
|
0.5--2.3
|
4.2
|
2.8--6.3
|
2.7
|
2.0--3.7
|
|
1.0
|
0.7--1.6
|
3.5
|
2.4--5.0
|
2.2
|
1.6--3.1
|
|
Delaware
|
2.3
|
1.6--3.4
|
4.6
|
3.2--6.4
|
3.7
|
2.9--4.7
|
|
1.9
|
1.1--3.3
|
3.1
|
2.1--4.7
|
2.6
|
2.0--3.4
|
|
Florida
|
2.3
|
1.8--2.8
|
5.4
|
4.6--6.5
|
3.9
|
3.4--4.5
|
|
---
|
---
|
---
|
---
|
---
|
---
|
|
Georgia
|
2.0
|
1.0--3.9
|
6.9
|
5.2--9.1
|
4.5
|
3.2--6.3
|
|
1.7
|
0.9--3.2
|
3.4
|
2.4--5.0
|
2.6
|
1.9--3.4
|
|
Hawaii
|
2.5
|
1.1--5.3
|
4.8
|
2.5--9.0
|
3.8
|
2.2--6.5
|
|
---
|
---
|
---
|
---
|
---
|
---
|
|
Idaho
|
2.4
|
1.6--3.8
|
3.2
|
2.1--4.9
|
2.9
|
2.0--4.1
|
|
1.8
|
1.2--2.8
|
2.7
|
1.8--3.9
|
2.3
|
1.8--2.9
|
|
Illinois
|
1.5
|
0.9--2.5
|
4.1
|
3.1--5.3
|
3.0
|
2.2--3.9
|
|
2.1
|
1.3--3.3
|
3.0
|
2.0--4.5
|
2.6
|
1.9--3.6
|
|
Indiana
|
3.0
|
1.7--5.2
|
3.5
|
2.2--5.4
|
3.2
|
2.4--4.4
|
|
1.6
|
0.8--3.0
|
4.0
|
2.6--6.3
|
2.8
|
1.9--4.1
|
|
Kansas
|
1.8
|
1.1--3.0
|
4.9
|
3.4--7.0
|
3.4
|
2.5--4.7
|
|
0.9
|
0.4--1.8
|
2.4
|
1.6--3.6
|
1.7
|
1.1--2.5
|
|
Kentucky
|
2.2
|
1.3--3.7
|
5.8
|
3.7--9.0
|
4.0
|
2.7--6.0
|
|
2.1
|
1.1--4.1
|
4.7
|
2.8--7.9
|
3.5
|
2.3--5.1
|
|
Louisiana
|
3.8
|
2.6--5.7
|
10.5
|
7.2--15.1
|
7.2
|
5.0--10.2
|
|
2.6
|
1.6--4.3
|
8.1
|
5.1--12.8
|
5.4
|
3.7--7.7
|
|
Maine
|
---
|
---
|
---
|
---
|
---
|
---
|
|
3.4
|
2.9--4.0
|
6.1
|
5.4--6.8
|
4.9
|
4.4--5.4
|
|
Maryland
|
1.9
|
1.2--3.2
|
5.2
|
3.9--6.9
|
3.9
|
3.2--4.7
|
|
1.4
|
0.8--2.5
|
4.1
|
2.7--6.1
|
3.0
|
2.1--4.1
|
|
Massachusetts
|
1.7
|
1.0--2.8
|
4.9
|
3.5--6.8
|
3.3
|
2.4--4.5
|
|
0.6
|
0.3--1.2
|
3.1
|
1.9--4.9
|
1.9
|
1.2--2.9
|
|
Michigan
|
2.0
|
1.2--3.4
|
5.7
|
4.5--7.2
|
4.1
|
3.4--4.9
|
|
2.6
|
1.8--3.7
|
4.6
|
3.7--5.7
|
3.8
|
3.1--4.5
|
|
Mississippi
|
2.9
|
2.0--4.3
|
3.7
|
2.4--5.6
|
3.3
|
2.5--4.5
|
|
2.5
|
1.5--3.9
|
1.7
|
1.0--2.9
|
2.1
|
1.5--3.1
|
|
Missouri
|
2.4
|
1.6--3.7
|
3.6
|
1.9--6.7
|
3.1
|
1.9--4.9
|
|
2.1
|
1.1--3.8
|
2.7
|
1.2--5.9
|
2.4
|
1.3--4.3
|
|
Montana
|
2.5
|
0.8--7.5
|
5.0
|
2.7--9.3
|
3.9
|
1.8--8.1
|
|
2.8
|
0.9--8.4
|
4.6
|
2.4--8.8
|
3.7
|
1.7--8.1
|
|
Nevada
|
3.1
|
2.1--4.5
|
4.3
|
2.9--6.4
|
3.7
|
2.8--4.9
|
|
1.2
|
0.8--2.0
|
2.4
|
1.4--4.0
|
1.8
|
1.2--2.7
|
|
New Hampshire
|
1.4
|
0.7--2.8
|
2.6
|
1.7--4.1
|
2.1
|
1.4--3.1
|
|
---
|
---
|
---
|
---
|
---
|
---
|
|
New Jersey
|
1.2
|
0.7--2.2
|
5.3
|
3.4--8.0
|
3.3
|
2.3--4.8
|
|
1.3
|
0.9--1.7
|
3.5
|
2.3--5.2
|
2.5
|
1.8--3.4
|
|
New Mexico
|
---
|
---
|
---
|
---
|
---
|
---
|
|
3.3
|
2.5--4.4
|
5.3
|
3.6--7.9
|
4.3
|
3.2--5.9
|
|
New York
|
---
|
---
|
---
|
---
|
---
|
---
|
|
2.4
|
1.5--3.8
|
5.0
|
3.5--7.0
|
4.0
|
2.9--5.6
|
|
North Carolina
|
2.3
|
1.4--3.8
|
5.3
|
3.6--7.6
|
3.8
|
2.7--5.4
|
|
1.3
|
0.7--2.4
|
3.1
|
2.1--4.5
|
2.2
|
1.6--3.1
|
|
North Dakota
|
---
|
---
|
---
|
---
|
---
|
---
|
|
1.6
|
0.7--3.5
|
2.7
|
1.3--5.4
|
2.2
|
1.3--3.7
|
|
Oklahoma
|
5.0
|
3.3--7.4
|
5.7
|
3.6--8.7
|
5.3
|
3.8--7.5
|
|
1.1
|
0.5--2.3
|
2.4
|
1.2--4.5
|
1.7
|
1.0--3.0
|
|
Pennsylvania
|
2.2
|
1.5--3.3
|
3.5
|
2.2--5.6
|
3.0
|
2.1--4.2
|
|
1.6
|
1.0--2.7
|
2.5
|
1.4--4.4
|
2.0
|
1.4--3.0
|
|
Rhode Island
|
1.7
|
1.0--2.9
|
3.4
|
2.2--5.4
|
2.6
|
2.0--3.4
|
|
---
|
---
|
---
|
---
|
---
|
---
|
|
South Carolina
|
2.1
|
0.9--4.7
|
4.4
|
2.7--7.0
|
3.4
|
2.2--5.1
|
|
1.0
|
0.3--2.7
|
3.6
|
2.2--6.0
|
2.4
|
1.5--3.6
|
|
South Dakota
|
1.0
|
0.4--2.3
|
3.0
|
2.1--4.4
|
2.1
|
1.4--3.0
|
|
1.6
|
1.0--2.7
|
1.8
|
1.1--3.0
|
1.7
|
1.1--2.6
|
|
Tennessee
|
2.4
|
1.5--3.7
|
4.4
|
3.2--6.0
|
3.4
|
2.6--4.4
|
|
1.0
|
0.6--1.5
|
3.4
|
2.1--5.3
|
2.2
|
1.4--3.3
|
|
Texas
|
2.3
|
1.6--3.2
|
3.5
|
2.7--4.6
|
2.9
|
2.3--3.7
|
|
0.9
|
0.6--1.5
|
2.4
|
1.7--3.4
|
1.7
|
1.3--2.2
|
|
Utah
|
2.6
|
1.4--4.6
|
5.3
|
3.5--7.9
|
4.3
|
3.2--5.9
|
|
1.8
|
1.0--3.3
|
3.1
|
1.6--6.0
|
2.5
|
1.7--3.7
|
|
Vermont
|
1.1
|
0.9--1.4
|
2.9
|
2.4--3.5
|
2.2
|
1.8--2.5
|
|
1.5
|
1.2--1.9
|
2.9
|
2.3--3.7
|
2.3
|
2.1--2.6
|
|
West Virginia
|
4.1
|
2.4--7.0
|
7.4
|
5.7--9.5
|
6.0
|
4.8--7.6
|
|
3.3
|
1.9--5.5
|
4.5
|
3.7--5.6
|
4.0
|
3.3--4.8
|
|
Wisconsin
|
---
|
---
|
---
|
---
|
---
|
---
|
|
---
|
---
|
---
|
---
|
---
|
---
|
|
Wyoming
|
3.9
|
3.0--5.2
|
6.6
|
5.4--8.1
|
5.3
|
4.5--6.3
|
|
3.1
|
2.3--4.1
|
4.6
|
3.6--5.8
|
3.9
|
3.3--4.7
|
|
Median
|
2.3
|
4.7
|
3.6
|
|
1.8
|
3.1
|
2.5
|
|
Range
|
1.0--5.0
|
2.6--10.5
|
2.1--7.2
|
|
0.6--3.7
|
1.7--8.1
|
1.7--5.4
|
|
Local surveys
|
|
|
|
|
|
|
|
|
|
|
|
|
|
|
Boston, MA
|
1.6
|
0.6--4.1
|
4.3
|
2.6--7.1
|
3.0
|
1.9--4.9
|
|
0.9
|
0.3--2.6
|
1.9
|
1.1--3.3
|
1.5
|
0.9--2.4
|
|
Broward County, FL
|
3.3
|
1.9--5.6
|
5.1
|
3.3--7.8
|
4.2
|
2.8--6.1
|
|
3.1
|
1.8--5.2
|
4.5
|
2.7--7.4
|
3.8
|
2.4--6.0
|
|
Charlotte-Mecklenburg, NC
|
1.2
|
0.7--2.3
|
3.4
|
2.1--5.4
|
2.3
|
1.6--3.5
|
|
1.4
|
0.8--2.6
|
2.1
|
1.1--3.9
|
1.8
|
1.1--2.8
|
|
Chicago, IL
|
1.9
|
0.7--4.8
|
6.8
|
3.7--12.1
|
5.0
|
3.1--8.0
|
|
1.7
|
0.8--3.5
|
4.8
|
3.2--7.3
|
3.8
|
2.6--5.4
|
|
Clark County, NV
|
2.9
|
1.8--4.7
|
4.5
|
2.6--7.6
|
3.7
|
2.5--5.4
|
|
1.0
|
0.7--1.6
|
2.5
|
1.3--4.8
|
1.8
|
1.1--2.9
|
|
Dallas, TX
|
2.3
|
1.2--4.5
|
4.0
|
2.5--6.5
|
3.2
|
2.1--4.8
|
|
1.2
|
0.6--2.4
|
2.3
|
1.2--4.2
|
1.9
|
1.3--2.8
|
|
Detroit, MI
|
3.9
|
2.5--5.9
|
7.5
|
5.2--10.7
|
5.8
|
4.0--8.2
|
|
3.3
|
2.1--5.3
|
7.2
|
5.2--9.8
|
5.3
|
3.9--7.0
|
|
Duval County, FL
|
3.7
|
2.5--5.2
|
10.2
|
7.8--13.2
|
7.3
|
5.8--9.3
|
|
2.1
|
1.4--3.2
|
6.6
|
4.8--9.1
|
4.5
|
3.4--5.9
|
|
Los Angeles, CA
|
2.7
|
1.5--4.8
|
4.1
|
2.1--7.8
|
3.5
|
2.3--5.2
|
|
2.3
|
1.6--3.4
|
4.0
|
2.5--6.2
|
3.2
|
2.2--4.6
|
|
Memphis, TN
|
2.0
|
1.1--3.9
|
3.3
|
2.0--5.3
|
2.6
|
1.8--3.8
|
|
0.4
|
0.1--1.6
|
3.0
|
1.6--5.6
|
1.7
|
0.9--3.0
|
|
Miami-Dade County, FL
|
2.0
|
1.2--3.4
|
5.5
|
4.0--7.5
|
3.8
|
2.9--5.0
|
|
2.0
|
1.0--3.7
|
5.7
|
4.2--7.7
|
3.9
|
2.8--5.2
|
|
Milwaukee, WI
|
---
|
---
|
---
|
---
|
---
|
---
|
|
---
|
---
|
---
|
---
|
---
|
---
|
|
New York City, NY
|
---
|
---
|
---
|
---
|
---
|
---
|
|
2.2
|
1.7--2.8
|
3.4
|
2.9--4.1
|
2.8
|
2.3--3.3
|
|
Orange County, FL
|
3.3
|
2.1--5.3
|
2.9
|
1.8--4.8
|
3.1
|
2.2--4.4
|
|
1.7
|
0.8--3.5
|
3.2
|
1.8--5.4
|
2.4
|
1.6--3.8
|
|
Palm Beach County, FL
|
2.0
|
1.2--3.1
|
3.8
|
2.6--5.5
|
3.0
|
2.2--4.0
|
|
2.3
|
1.3--3.8
|
3.6
|
2.4--5.3
|
2.9
|
2.1--4.1
|
|
Philadelphia, PA
|
1.7
|
0.8--3.4
|
4.9
|
3.0--7.9
|
3.5
|
2.5--4.9
|
|
2.3
|
1.3--3.9
|
5.7
|
3.4--9.3
|
3.9
|
2.7--5.6
|
|
San Bernardino, CA
|
1.7
|
0.9--3.2
|
3.7
|
2.4--5.6
|
2.7
|
1.9--3.9
|
|
0.1
|
0.0--0.9
|
3.7
|
2.3--5.9
|
1.9
|
1.2--3.0
|
|
San Diego, CA
|
2.6
|
1.9--3.7
|
2.8
|
1.8--4.2
|
2.7
|
2.0--3.7
|
|
1.6
|
0.9--2.8
|
2.1
|
1.1--3.7
|
1.8
|
1.2--2.7
|
|
San Francisco, CA
|
2.4
|
1.4--4.0
|
3.4
|
2.5--4.8
|
3.2
|
2.4--4.2
|
|
2.2
|
1.3--3.7
|
2.8
|
2.0--4.0
|
2.6
|
1.8--3.6
|
|
Seattle, WA
|
2.7
|
1.9--4.0
|
4.0
|
2.7--5.9
|
3.8
|
2.9--5.1
|
|
1.6
|
1.0--2.7
|
4.4
|
3.0--6.2
|
3.1
|
2.3--4.2
|
|
Median
|
2.3
|
4.0
|
3.3
|
|
1.7
|
3.6
|
2.8
|
|
Range
|
1.2--3.9
|
2.8--10.2
|
2.3--7.3
|
|
0.1--3.3
|
1.9--7.2
|
1.5--5.3
|
|
|
Ever used hallucinogenic drugs
|
|
Ever took prescription drugs without a doctor's prescription
|
|
|
Female
|
Male
|
Total
|
|
Female
|
Male
|
Total
|
|
Category
|
%
|
CI§
|
%
|
CI
|
%
|
CI
|
|
%
|
CI
|
%
|
CI
|
%
|
CI
|
|
Race/Ethnicity
|
|
|
|
|
|
|
|
|
|
|
|
|
|
|
White¶
|
6.2
|
5.0--7.6
|
11.5
|
9.2--14.2
|
9.0
|
7.9--10.3
|
|
23.3
|
21.3--25.4
|
22.8
|
19.6--26.3
|
23.0
|
20.9--25.3
|
|
Black¶
|
1.4
|
0.6--2.9
|
5.1
|
3.5--7.3
|
3.3
|
2.4--4.6
|
|
10.3
|
7.8--13.5
|
13.3
|
11.0--16.0
|
11.8
|
10.2--13.7
|
|
Hispanic
|
6.6
|
5.1--8.6
|
9.2
|
7.2--11.6
|
7.9
|
6.6--9.5
|
|
16.6
|
13.7--20.0
|
17.8
|
15.5--20.3
|
17.2
|
14.8--19.8
|
|
Grade
|
|
|
|
|
|
|
|
|
|
|
|
|
|
|
9
|
5.0
|
3.8--6.4
|
6.6
|
5.3--8.2
|
5.9
|
5.1--6.8
|
|
16.1
|
14.2--18.0
|
14.3
|
12.0--16.9
|
15.1
|
13.5--16.8
|
|
10
|
4.5
|
3.4--5.9
|
10.0
|
7.8--12.9
|
7.4
|
6.1--9.1
|
|
18.2
|
15.4--21.2
|
18.2
|
14.6--22.5
|
18.2
|
15.8--20.9
|
|
11
|
6.9
|
5.1--9.4
|
10.7
|
8.4--13.4
|
8.9
|
7.4--10.6
|
|
21.5
|
18.0--25.4
|
23.9
|
21.0--27.2
|
22.7
|
20.0--25.8
|
|
12
|
5.6
|
4.3--7.4
|
14.2
|
11.5--17.5
|
10.0
|
8.2--12.2
|
|
24.3
|
20.7--28.2
|
27.2
|
24.3--30.3
|
25.8
|
23.4--28.3
|
|
Total
|
5.5
|
4.7--6.4
|
10.2
|
8.7--11.9
|
8.0
|
7.2--8.9
|
|
19.8
|
17.9--21.9
|
20.4
|
18.5--22.5
|
20.2
|
18.6--21.9
|
|
|
Smoked a whole cigarette before age 13 years
|
|
Drank alcohol before age 13 years
|
|
|
Female
|
Male
|
Total
|
|
Female
|
Male
|
Total
|
|
Category
|
%
|
CI†
|
%
|
CI
|
%
|
CI
|
|
%
|
CI
|
%
|
CI
|
%
|
CI
|
|
Race/Ethnicity
|
|
|
|
|
|
|
|
|
|
|
|
|
|
|
White§
|
9.8
|
7.9--12.1
|
10.8
|
8.6--13.5
|
10.3
|
8.6--12.3
|
|
15.5
|
13.9--17.2
|
20.3
|
17.4--23.6
|
18.1
|
16.2--20.1
|
|
Black§
|
6.9
|
5.5--8.7
|
11.2
|
9.3--13.5
|
9.1
|
7.9--10.5
|
|
21.9
|
19.7--24.3
|
27.6
|
24.8--30.7
|
24.9
|
23.0--26.8
|
|
Hispanic
|
10.5
|
8.7--12.6
|
14.7
|
12.9--16.8
|
12.6
|
11.2--14.2
|
|
23.2
|
21.1--25.4
|
31.0
|
28.3--33.8
|
27.1
|
25.4--28.9
|
|
Grade
|
|
|
|
|
|
|
|
|
|
|
|
|
|
|
9
|
11.1
|
9.6--12.9
|
13.0
|
11.0--15.2
|
12.1
|
10.8--13.6
|
|
26.6
|
24.0--29.3
|
29.5
|
25.9--33.4
|
28.1
|
25.7--30.7
|
|
10
|
9.3
|
7.8--11.2
|
12.7
|
9.8--16.3
|
11.2
|
9.3--13.3
|
|
18.5
|
16.5--20.8
|
25.4
|
21.3--30.0
|
22.2
|
19.8--24.7
|
|
11
|
9.0
|
7.5--10.9
|
11.6
|
9.7--13.8
|
10.3
|
9.0--11.8
|
|
14.9
|
12.7--17.3
|
20.7
|
18.4--23.4
|
17.9
|
16.1--19.9
|
|
12
|
7.9
|
5.4--11.4
|
9.2
|
7.5--11.4
|
8.6
|
6.9--10.6
|
|
10.9
|
9.2--12.9
|
17.3
|
14.8--20.1
|
14.2
|
12.5--16.2
|
|
Total
|
9.4
|
8.2--10.8
|
11.8
|
10.3--13.4
|
10.7
|
9.6--11.9
|
|
18.1
|
16.9--19.4
|
23.7
|
21.4--26.2
|
21.1
|
19.6--22.6
|
|
|
Smoked a whole cigarette before age 13 years
|
|
Drank alcohol before age 13 years
|
|
|
Female
|
Male
|
Total
|
|
Female
|
Male
|
Total
|
|
Site
|
%
|
CI†
|
%
|
CI
|
%
|
CI
|
|
%
|
CI
|
%
|
CI
|
%
|
CI
|
|
State surveys
|
|
|
|
|
|
|
|
|
|
|
|
|
|
|
Alabama
|
11.8
|
9.0--15.2
|
17.6
|
14.6--21.2
|
14.8
|
12.4--17.7
|
|
19.0
|
15.1--23.7
|
26.2
|
22.1--30.8
|
22.8
|
19.7--26.3
|
|
Alaska
|
11.6
|
8.9--15.0
|
13.6
|
10.9--16.8
|
12.8
|
10.7--15.3
|
|
16.0
|
13.8--18.4
|
17.6
|
14.9--20.6
|
16.9
|
15.0--19.0
|
|
Arizona
|
10.5
|
7.5--14.6
|
14.2
|
11.1--18.0
|
12.5
|
9.8--15.9
|
|
22.0
|
18.2--26.3
|
28.7
|
24.5--33.2
|
25.6
|
22.1--29.5
|
|
Arkansas
|
15.5
|
12.3--19.3
|
19.7
|
15.9--24.1
|
17.7
|
14.7--21.1
|
|
25.0
|
20.8--29.8
|
32.6
|
28.5--37.0
|
28.9
|
26.0--32.1
|
|
Colorado
|
7.5
|
4.9--11.3
|
10.0
|
7.1--14.0
|
8.8
|
6.3--12.3
|
|
17.5
|
13.8--21.8
|
27.2
|
23.1--31.8
|
22.4
|
19.2--26.0
|
|
Connecticut
|
---§
|
---
|
---
|
---
|
---
|
---
|
|
15.6
|
13.0--18.7
|
19.3
|
16.4--22.6
|
17.6
|
15.6--19.7
|
|
Delaware
|
13.2
|
11.1--15.7
|
13.8
|
11.6--16.4
|
13.7
|
12.0--15.5
|
|
23.0
|
20.4--25.8
|
23.6
|
20.9--26.6
|
23.5
|
21.5--25.7
|
|
Florida
|
10.2
|
9.0--11.4
|
13.7
|
12.3--15.2
|
12.1
|
11.0--13.2
|
|
21.0
|
19.3--22.8
|
25.4
|
23.6--27.2
|
23.3
|
22.1--24.5
|
|
Georgia
|
9.0
|
6.9--11.7
|
14.9
|
12.7--17.4
|
11.9
|
10.5--13.4
|
|
17.5
|
14.9--20.4
|
23.8
|
20.2--27.9
|
20.7
|
18.3--23.3
|
|
Hawaii
|
---
|
---
|
---
|
---
|
---
|
---
|
|
27.6
|
23.0--32.8
|
29.4
|
25.8--33.3
|
28.6
|
25.1--32.5
|
|
Idaho
|
7.8
|
5.9--10.1
|
9.5
|
7.7--11.7
|
8.7
|
7.3--10.5
|
|
16.5
|
13.9--19.5
|
21.6
|
18.7--24.7
|
19.2
|
17.0--21.6
|
|
Illinois
|
9.7
|
7.3--12.9
|
14.6
|
12.0--17.6
|
12.3
|
10.1--14.8
|
|
17.1
|
14.2--20.5
|
24.1
|
19.7--29.2
|
20.7
|
18.1--23.6
|
|
Indiana
|
13.3
|
9.4--18.6
|
11.6
|
8.7--15.3
|
12.5
|
9.6--16.0
|
|
20.2
|
15.7--25.6
|
19.6
|
15.7--24.1
|
19.9
|
16.4--23.9
|
|
Kansas
|
9.7
|
7.1--13.2
|
12.0
|
9.7--14.7
|
10.9
|
8.7--13.6
|
|
19.2
|
15.7--23.2
|
23.0
|
19.6--26.8
|
21.1
|
18.1--24.5
|
|
Kentucky
|
17.7
|
14.2--21.9
|
20.9
|
17.1--25.2
|
19.3
|
16.4--22.6
|
|
18.9
|
15.7--22.6
|
24.4
|
20.7--28.6
|
21.7
|
18.7--25.0
|
|
Louisiana
|
10.9
|
8.3--14.0
|
20.3
|
15.3--26.5
|
15.3
|
12.5--18.6
|
|
24.3
|
18.8--30.8
|
29.5
|
24.7--34.8
|
26.9
|
22.7--31.7
|
|
Maine
|
11.0
|
10.1--12.1
|
12.9
|
11.9--14.1
|
12.1
|
11.3--12.9
|
|
17.4
|
16.1--18.7
|
22.8
|
21.5--24.2
|
20.3
|
19.3--21.3
|
|
Maryland
|
9.0
|
6.7--11.8
|
12.5
|
10.3--15.1
|
10.8
|
9.1--12.7
|
|
21.8
|
18.0--26.3
|
26.9
|
23.1--31.1
|
24.5
|
21.3--28.1
|
|
Massachusetts
|
7.9
|
6.1--10.1
|
10.8
|
8.5--13.7
|
9.3
|
7.6--11.4
|
|
14.3
|
11.9--17.1
|
19.9
|
17.6--22.5
|
17.2
|
15.4--19.2
|
|
Michigan
|
10.3
|
8.3--12.8
|
11.6
|
10.1--13.2
|
11.1
|
9.6--12.7
|
|
16.4
|
14.0--19.1
|
21.0
|
18.0--24.3
|
18.8
|
16.7--21.1
|
|
Mississippi
|
16.1
|
13.4--19.2
|
17.1
|
14.3--20.3
|
16.6
|
14.5--18.9
|
|
22.8
|
19.2--26.9
|
30.0
|
26.6--33.5
|
26.4
|
23.3--29.7
|
|
Missouri
|
8.7
|
5.6--13.2
|
10.9
|
7.9--14.8
|
9.9
|
7.0--13.8
|
|
14.7
|
10.6--20.0
|
25.8
|
20.7--31.6
|
20.4
|
16.2--25.3
|
|
Montana
|
11.3
|
8.2--15.4
|
13.1
|
10.4--16.3
|
12.3
|
9.8--15.3
|
|
20.0
|
16.4--24.2
|
27.8
|
24.0--31.9
|
24.0
|
20.7--27.5
|
|
Nevada
|
9.2
|
7.5--11.2
|
13.3
|
11.0--16.1
|
11.3
|
9.9--12.8
|
|
22.5
|
19.7--25.6
|
28.6
|
25.3--32.2
|
25.6
|
23.3--28.0
|
|
New Hampshire
|
9.8
|
7.5--12.7
|
11.0
|
8.9--13.6
|
10.4
|
8.7--12.5
|
|
11.5
|
9.1--14.4
|
17.7
|
14.9--20.9
|
14.8
|
12.9--16.8
|
|
New Jersey
|
4.0
|
2.8--5.6
|
9.3
|
6.7--12.8
|
6.8
|
5.1--9.1
|
|
14.3
|
10.8--18.7
|
21.3
|
18.7--24.3
|
18.0
|
15.5--20.8
|
|
New Mexico
|
14.2
|
11.9--16.7
|
19.3
|
16.2--22.9
|
16.8
|
14.4--19.4
|
|
27.0
|
25.0--29.1
|
31.7
|
29.4--34.0
|
29.4
|
27.8--31.1
|
|
New York
|
6.7
|
5.2--8.6
|
9.6
|
7.8--11.8
|
8.2
|
6.9--9.8
|
|
17.2
|
14.0--20.8
|
24.4
|
22.1--26.9
|
21.0
|
18.6--23.5
|
|
North Carolina
|
9.4
|
7.8--11.4
|
15.4
|
13.0--18.1
|
12.4
|
10.8--14.1
|
|
15.7
|
13.1--18.8
|
22.5
|
18.5--27.2
|
19.0
|
16.3--22.1
|
|
North Dakota
|
10.1
|
8.2--12.4
|
14.1
|
11.5--17.1
|
12.3
|
10.5--14.4
|
|
16.0
|
13.7--18.7
|
23.3
|
20.1--26.8
|
19.9
|
18.0--21.9
|
|
Oklahoma
|
9.6
|
6.9--13.3
|
13.3
|
10.0--17.4
|
11.5
|
9.1--14.6
|
|
15.3
|
12.3--18.8
|
23.6
|
19.2--28.6
|
19.4
|
16.8--22.4
|
|
Pennsylvania
|
8.9
|
6.3--12.4
|
9.7
|
7.5--12.4
|
9.3
|
7.2--11.8
|
|
17.2
|
13.7--21.4
|
20.7
|
17.3--24.4
|
19.0
|
15.9--22.6
|
|
Rhode Island
|
8.0
|
6.6--9.7
|
8.8
|
7.0--11.0
|
8.4
|
7.1--9.9
|
|
14.8
|
12.6--17.3
|
16.8
|
14.7--19.2
|
15.8
|
14.1--17.6
|
|
South Carolina
|
11.1
|
8.8--13.8
|
16.5
|
12.0--22.3
|
13.8
|
11.0--17.1
|
|
20.2
|
15.8--25.5
|
20.6
|
16.4--25.6
|
20.4
|
16.6--24.9
|
|
South Dakota
|
7.4
|
4.9--11.1
|
16.9
|
13.2--21.5
|
12.3
|
9.7--15.5
|
|
13.6
|
10.8--16.9
|
24.3
|
19.8--29.4
|
19.1
|
15.9--22.8
|
|
Tennessee
|
10.5
|
8.8--12.6
|
17.6
|
15.2--20.2
|
14.2
|
12.4--16.2
|
|
17.5
|
14.9--20.3
|
22.9
|
20.7--25.3
|
20.4
|
18.5--22.4
|
|
Texas
|
8.7
|
7.1--10.5
|
14.1
|
11.7--16.8
|
11.4
|
9.9--13.1
|
|
19.7
|
16.2--23.8
|
27.3
|
24.0--30.9
|
23.6
|
20.4--27.1
|
|
Utah
|
3.7
|
2.4--5.5
|
7.5
|
5.0--11.1
|
5.9
|
4.5--7.5
|
|
9.1
|
6.5--12.8
|
13.6
|
11.1--16.6
|
11.5
|
9.2--14.3
|
|
Vermont
|
10.7
|
9.3--12.2
|
12.2
|
10.3--14.3
|
11.6
|
10.2--13.2
|
|
14.8
|
13.4--16.3
|
21.1
|
18.9--23.3
|
18.2
|
16.8--19.7
|
|
West Virginia
|
15.2
|
12.2--18.8
|
19.5
|
16.5--22.8
|
17.6
|
15.0--20.5
|
|
18.1
|
14.9--21.9
|
26.8
|
22.0--32.1
|
22.7
|
19.4--26.3
|
|
Wisconsin
|
7.6
|
6.0--9.6
|
11.1
|
9.2--13.4
|
9.4
|
8.0--10.9
|
|
16.8
|
13.9--20.2
|
21.5
|
18.6--24.8
|
19.2
|
16.8--22.0
|
|
Wyoming
|
14.4
|
12.3--16.8
|
16.9
|
14.7--19.4
|
15.8
|
14.0--17.7
|
|
22.3
|
19.9--25.0
|
29.6
|
26.6--32.7
|
26.1
|
23.9--28.5
|
|
Median
|
9.9
|
13.4
|
12.1
|
|
17.5
|
23.7
|
20.5
|
|
Range
|
3.7--17.7
|
7.5--20.9
|
5.9--19.3
|
|
9.1--27.6
|
13.6--32.6
|
11.5--29.4
|
|
Local surveys
|
|
|
|
|
|
|
|
|
|
|
|
|
|
|
Boston, MA
|
5.1
|
3.5--7.5
|
9.9
|
7.4--13.2
|
7.5
|
5.9--9.5
|
|
19.7
|
16.0--23.9
|
24.8
|
21.5--28.5
|
22.2
|
19.5--25.2
|
|
Broward County, FL
|
5.9
|
4.2--8.2
|
10.3
|
8.2--12.8
|
8.1
|
6.6--9.8
|
|
25.2
|
21.6--29.1
|
26.5
|
23.0--30.3
|
25.8
|
23.1--28.8
|
|
Charlotte-Mecklenburg, NC
|
6.4
|
4.8--8.4
|
12.6
|
9.7--16.2
|
9.4
|
7.7--11.4
|
|
17.7
|
14.5--21.3
|
21.0
|
17.5--24.9
|
19.3
|
17.0--21.8
|
|
Chicago, IL
|
10.4
|
8.3--13.1
|
14.1
|
10.6--18.6
|
12.9
|
10.6--15.6
|
|
21.4
|
17.0--26.7
|
22.6
|
19.0--26.6
|
22.4
|
19.4--25.7
|
|
Clark County, NV
|
8.5
|
6.7--10.7
|
14.3
|
11.4--17.8
|
11.5
|
9.8--13.4
|
|
23.0
|
19.8--26.4
|
27.6
|
24.0--31.6
|
25.3
|
23.0--27.8
|
|
Dallas, TX
|
6.8
|
5.0--9.1
|
15.6
|
11.6--20.6
|
11.1
|
8.7--14.0
|
|
25.1
|
20.9--29.8
|
33.3
|
29.3--37.6
|
29.2
|
26.4--32.3
|
|
Detroit, MI
|
11.7
|
9.4--14.6
|
12.4
|
9.2--16.3
|
12.0
|
9.6--14.9
|
|
22.0
|
18.5--25.9
|
25.5
|
21.4--30.1
|
23.7
|
20.8--27.0
|
|
Duval County, FL
|
11.4
|
9.3--13.9
|
15.7
|
13.2--18.6
|
13.8
|
11.8--16.0
|
|
23.9
|
21.0--27.1
|
26.1
|
23.2--29.1
|
25.2
|
22.8--27.7
|
|
Los Angeles, CA
|
7.2
|
5.8--8.9
|
11.3
|
8.7--14.4
|
9.3
|
7.4--11.6
|
|
21.4
|
16.7--26.9
|
29.3
|
24.9--34.2
|
25.5
|
22.8--28.4
|
|
Memphis, TN
|
4.5
|
3.2--6.2
|
7.8
|
6.0--10.0
|
6.0
|
4.9--7.4
|
|
16.7
|
13.6--20.3
|
17.1
|
13.7--21.2
|
17.0
|
14.3--20.2
|
|
Miami-Dade County, FL
|
6.6
|
4.9--8.8
|
9.6
|
7.6--11.9
|
8.2
|
6.7--9.9
|
|
22.3
|
19.4--25.6
|
28.5
|
25.6--31.7
|
25.6
|
23.5--27.9
|
|
Milwaukee, WI
|
11.5
|
9.3--14.1
|
16.6
|
13.8--19.9
|
14.0
|
12.0--16.3
|
|
21.0
|
18.0--24.3
|
23.7
|
20.9--26.9
|
22.4
|
20.3--24.6
|
|
New York City, NY
|
7.8
|
6.8--9.0
|
10.1
|
9.0--11.3
|
8.9
|
8.1--9.7
|
|
23.4
|
21.0--25.9
|
25.0
|
23.0--27.0
|
24.1
|
22.4--25.9
|
|
Orange County, FL
|
8.2
|
6.4--10.6
|
11.2
|
8.7--14.4
|
9.8
|
8.1--11.7
|
|
22.0
|
18.1--26.4
|
27.2
|
23.1--31.7
|
24.6
|
21.2--28.3
|
|
Palm Beach County, FL
|
8.4
|
6.5--10.9
|
10.7
|
8.5--13.3
|
9.6
|
8.1--11.3
|
|
20.1
|
17.3--23.1
|
23.7
|
20.3--27.5
|
22.0
|
19.6--24.7
|
|
Philadelphia, PA
|
11.2
|
8.0--15.4
|
12.2
|
9.0--16.3
|
11.8
|
9.2--14.9
|
|
21.6
|
18.0--25.8
|
27.0
|
21.5--33.3
|
24.4
|
20.8--28.4
|
|
San Bernardino, CA
|
5.7
|
4.0--8.1
|
14.2
|
11.1--17.9
|
10.0
|
8.0--12.4
|
|
20.8
|
17.3--24.9
|
32.1
|
27.5--37.1
|
26.6
|
23.5--29.9
|
|
San Diego, CA
|
7.1
|
5.6--9.0
|
10.9
|
8.6--13.7
|
9.1
|
7.6--10.9
|
|
20.1
|
16.9--23.8
|
25.2
|
21.8--29.0
|
22.7
|
20.1--25.7
|
|
San Francisco, CA
|
6.6
|
5.1--8.7
|
9.9
|
7.9--12.4
|
8.5
|
7.2--10.0
|
|
16.5
|
14.3--19.0
|
21.3
|
18.5--24.3
|
19.0
|
17.2--21.0
|
|
Seattle, WA
|
4.9
|
3.4--7.0
|
9.1
|
7.2--11.5
|
7.3
|
5.9--9.0
|
|
15.1
|
12.5--18.1
|
20.3
|
17.2--23.9
|
18.0
|
15.7--20.5
|
|
Median
|
7.1
|
11.2
|
9.5
|
|
21.4
|
25.3
|
23.9
|
|
Range
|
4.5--11.7
|
7.8--16.6
|
6.0--14.0
|
|
15.1--25.2
|
17.1--33.3
|
17.0--29.2
|
|
|
Female
|
Male
|
Total
|
|
Category
|
%
|
CI*
|
%
|
CI
|
%
|
CI
|
|
Race/Ethnicity
|
|
|
|
|
|
|
|
White†
|
4.0
|
3.3--4.8
|
7.1
|
5.7--8.7
|
5.7
|
4.8--6.6
|
|
Black†
|
4.1
|
3.0--5.7
|
16.1
|
13.4--19.2
|
10.2
|
8.7--11.9
|
|
Hispanic
|
7.8
|
6.2--9.8
|
12.9
|
11.2--14.8
|
10.3
|
9.1--11.8
|
|
Grade
|
|
|
|
|
|
|
|
9
|
6.8
|
5.4--8.4
|
11.1
|
9.1--13.4
|
9.1
|
7.8--10.5
|
|
10
|
5.6
|
4.5--7.1
|
10.6
|
8.5--13.3
|
8.3
|
7.1--9.8
|
|
11
|
4.3
|
3.4--5.4
|
8.6
|
7.1--10.3
|
6.5
|
5.6--7.5
|
|
12
|
2.6
|
1.9--3.4
|
7.8
|
6.4--9.4
|
5.2
|
4.4--6.3
|
|
Total
|
5.0
|
4.3--5.7
|
9.7
|
8.4--11.1
|
7.5
|
6.7--8.3
|
|
|
Female
|
Male
|
Total
|
|
Site
|
%
|
CI*
|
%
|
CI
|
%
|
CI
|
|
State surveys
|
|
|
|
|
|
|
|
Alabama
|
4.7
|
3.0--7.2
|
11.1
|
8.4--14.7
|
8.0
|
6.0--10.6
|
|
Alaska
|
8.9
|
7.0--11.3
|
10.3
|
7.7--13.5
|
10.0
|
8.2--12.0
|
|
Arizona
|
9.0
|
6.6--12.1
|
14.2
|
11.4--17.5
|
11.8
|
9.4--14.7
|
|
Arkansas
|
6.6
|
5.1--8.6
|
12.6
|
10.0--15.7
|
9.6
|
8.0--11.4
|
|
Colorado
|
6.6
|
4.4--9.7
|
10.0
|
7.2--13.6
|
8.3
|
6.3--10.8
|
|
Connecticut
|
3.5
|
2.4--5.1
|
7.9
|
6.2--10.1
|
5.8
|
4.6--7.3
|
|
Delaware
|
8.5
|
6.9--10.6
|
14.2
|
12.2--16.4
|
11.4
|
10.0--13.0
|
|
Florida
|
6.4
|
5.5--7.4
|
11.5
|
10.4--12.8
|
9.1
|
8.2--10.0
|
|
Georgia
|
5.4
|
3.9--7.4
|
10.6
|
8.7--12.8
|
8.0
|
6.4--9.9
|
|
Hawaii
|
10.3
|
6.3--16.5
|
13.2
|
10.5--16.6
|
11.9
|
9.1--15.4
|
|
Idaho
|
4.0
|
3.0--5.3
|
8.1
|
6.1--10.5
|
6.1
|
5.0--7.5
|
|
Illinois
|
6.0
|
4.5--8.1
|
11.0
|
8.7--13.7
|
8.6
|
6.9--10.6
|
|
Indiana
|
6.7
|
4.7--9.5
|
8.6
|
6.6--11.2
|
7.6
|
5.9--9.9
|
|
Kansas
|
4.5
|
3.1--6.5
|
8.8
|
6.7--11.6
|
6.7
|
5.0--8.9
|
|
Kentucky
|
6.9
|
4.8--9.8
|
11.4
|
8.1--15.6
|
9.2
|
6.9--12.1
|
|
Louisiana
|
6.1
|
4.0--9.0
|
14.2
|
9.8--20.2
|
10.0
|
7.4--13.3
|
|
Maine
|
7.1
|
6.3--8.0
|
12.2
|
11.2--13.4
|
9.8
|
9.0--10.5
|
|
Maryland
|
5.3
|
3.6--7.7
|
10.8
|
7.4--15.5
|
8.1
|
5.7--11.4
|
|
Massachusetts
|
6.2
|
5.0--7.8
|
11.6
|
9.3--14.4
|
9.0
|
7.4--10.8
|
|
Michigan
|
5.8
|
4.5--7.5
|
9.9
|
8.0--12.2
|
7.9
|
6.5--9.6
|
|
Mississippi
|
6.3
|
4.9--8.1
|
10.4
|
8.0--13.3
|
8.4
|
6.9--10.2
|
|
Missouri
|
5.0
|
3.5--7.1
|
8.2
|
5.9--11.4
|
6.7
|
5.1--8.7
|
|
Montana
|
8.2
|
5.3--12.5
|
11.2
|
7.4--16.4
|
9.7
|
6.5--14.1
|
|
Nevada
|
5.9
|
4.4--7.8
|
12.7
|
9.9--16.0
|
9.3
|
7.7--11.3
|
|
New Hampshire
|
7.3
|
5.2--10.1
|
9.4
|
7.4--11.7
|
8.4
|
6.9--10.2
|
|
New Jersey
|
2.3
|
1.4--3.8
|
5.8
|
4.3--7.7
|
4.1
|
3.1--5.4
|
|
New Mexico
|
15.4
|
12.8--18.5
|
21.4
|
16.9--26.6
|
18.4
|
15.0--22.5
|
|
New York
|
4.8
|
3.3--6.9
|
10.2
|
7.9--13.0
|
7.7
|
6.1--9.7
|
|
North Carolina
|
4.4
|
3.5--5.6
|
12.1
|
10.3--14.3
|
8.1
|
7.2--9.1
|
|
North Dakota
|
5.2
|
3.6--7.7
|
7.4
|
5.3--10.1
|
6.4
|
4.7--8.7
|
|
Oklahoma
|
6.2
|
3.7--10.3
|
8.3
|
5.8--11.7
|
7.3
|
5.2--10.3
|
|
Pennsylvania
|
4.5
|
3.4--6.0
|
6.1
|
4.4--8.3
|
5.3
|
4.3--6.6
|
|
Rhode Island
|
6.5
|
5.1--8.3
|
10.1
|
8.5--11.9
|
8.3
|
7.2--9.5
|
|
South Carolina
|
5.8
|
3.7--8.8
|
10.6
|
8.4--13.2
|
8.3
|
6.6--10.2
|
|
South Dakota
|
3.1
|
1.4--6.7
|
7.5
|
5.2--10.6
|
5.3
|
3.7--7.6
|
|
Tennessee
|
5.8
|
4.7--7.1
|
12.2
|
10.3--14.5
|
9.2
|
7.9--10.8
|
|
Texas
|
4.9
|
3.6--6.7
|
11.2
|
9.4--13.2
|
8.1
|
6.9--9.5
|
|
Utah
|
3.5
|
2.1--5.7
|
6.7
|
4.9--9.0
|
5.2
|
3.8--7.2
|
|
Vermont
|
6.4
|
5.2--7.7
|
10.6
|
9.3--12.1
|
8.7
|
7.9--9.7
|
|
West Virginia
|
7.0
|
4.7--10.4
|
10.5
|
8.3--13.2
|
9.0
|
7.4--11.0
|
|
Wisconsin
|
3.9
|
2.8--5.6
|
7.4
|
5.7--9.4
|
5.7
|
4.6--7.2
|
|
Wyoming
|
7.1
|
5.6--9.0
|
11.1
|
9.2--13.3
|
9.3
|
7.8--10.9
|
|
Median
|
6.0
|
10.6
|
8.3
|
|
Range
|
2.3--15.4
|
5.8--21.4
|
4.1--18.4
|
|
Local surveys
|
|
|
|
|
|
|
|
Boston, MA
|
5.7
|
3.9--8.3
|
13.1
|
10.0--16.9
|
9.3
|
7.5--11.5
|
|
Broward County, FL
|
4.0
|
2.6--6.2
|
8.5
|
6.5--11.0
|
6.3
|
5.0--7.9
|
|
Charlotte-Mecklenburg, NC
|
4.6
|
3.3--6.5
|
11.8
|
8.9--15.5
|
8.2
|
6.6--10.0
|
|
Chicago, IL
|
7.1
|
4.1--11.9
|
11.4
|
8.1--15.9
|
9.6
|
7.0--13.1
|
|
Clark County, NV
|
6.0
|
4.4--8.2
|
13.2
|
9.6--17.9
|
9.7
|
7.5--12.5
|
|
Dallas, TX
|
6.6
|
4.8--8.8
|
15.7
|
12.1--20.1
|
11.0
|
8.7--13.9
|
|
Detroit, MI
|
9.5
|
7.2--12.4
|
16.3
|
12.9--20.2
|
12.8
|
10.6--15.4
|
|
Duval County, FL
|
7.5
|
5.9--9.5
|
14.4
|
12.3--16.9
|
11.2
|
9.5--13.1
|
|
Los Angeles, CA
|
5.8
|
4.1--8.1
|
13.1
|
9.3--18.2
|
9.6
|
7.4--12.2
|
|
Memphis, TN
|
7.0
|
4.8--10.1
|
11.4
|
8.4--15.3
|
9.2
|
7.1--11.9
|
|
Miami-Dade County, FL
|
5.5
|
3.8--7.7
|
10.6
|
8.7--12.8
|
8.1
|
6.7--9.8
|
|
Milwaukee, WI
|
11.4
|
9.4--13.6
|
19.6
|
16.9--22.6
|
15.4
|
13.7--17.3
|
|
New York City, NY
|
4.8
|
4.1--5.6
|
8.8
|
7.6--10.3
|
6.7
|
5.9--7.6
|
|
Orange County, FL
|
4.9
|
3.2--7.5
|
11.2
|
8.8--14.1
|
8.1
|
6.5--10.0
|
|
Palm Beach County, FL
|
6.9
|
5.0--9.4
|
10.6
|
8.6--13.1
|
8.8
|
7.3--10.5
|
|
Philadelphia, PA
|
8.5
|
6.4--11.1
|
14.6
|
10.4--20.0
|
11.5
|
9.1--14.5
|
|
San Bernardino, CA
|
8.1
|
5.9--11.2
|
18.1
|
14.6--22.1
|
13.2
|
11.0--15.7
|
|
San Diego, CA
|
6.2
|
5.0--7.8
|
12.1
|
9.6--15.1
|
9.2
|
7.6--11.0
|
|
San Francisco, CA
|
5.1
|
3.9--6.5
|
8.7
|
6.8--10.9
|
7.1
|
5.8--8.6
|
|
Seattle, WA
|
6.3
|
4.9--8.0
|
9.9
|
7.8--12.4
|
8.6
|
7.2--10.2
|
|
Median
|
6.2
|
11.9
|
9.2
|
|
Range
|
4.0--11.4
|
8.5--19.6
|
6.3--15.4
|
|
|
Smoked cigarettes on school property*
|
|
Used smokeless tobacco on school property†
|
|
|
Female
|
Male
|
Total
|
|
Female
|
Male
|
Total
|
|
Category
|
%
|
CI§
|
%
|
CI
|
%
|
CI
|
|
%
|
CI
|
%
|
CI
|
%
|
CI
|
|
Race/Ethnicity
|
|
|
|
|
|
|
|
|
|
|
|
|
|
|
White¶
|
4.7
|
3.8--5.9
|
6.6
|
5.4--8.2
|
5.8
|
4.8--6.8
|
|
1.1
|
0.7--1.7
|
12.1
|
8.8--16.3
|
7.0
|
5.3--9.0
|
|
Black¶
|
1.2
|
0.7--2.1
|
4.0
|
2.6--6.1
|
2.6
|
1.8--3.7
|
|
1.0
|
0.5--1.8
|
4.1
|
2.7--6.2
|
2.6
|
1.7--3.7
|
|
Hispanic
|
3.7
|
2.9--4.7
|
5.9
|
4.7--7.4
|
4.8
|
4.1--5.6
|
|
1.2
|
0.7--2.0
|
5.3
|
3.9--7.0
|
3.2
|
2.5--4.1
|
|
Grade
|
|
|
|
|
|
|
|
|
|
|
|
|
|
|
9
|
3.0
|
2.4--3.9
|
4.2
|
3.3--5.3
|
3.7
|
3.1--4.4
|
|
1.6
|
1.1--2.5
|
6.2
|
4.5--8.5
|
4.1
|
3.1--5.4
|
|
10
|
3.5
|
2.6--4.7
|
5.6
|
4.1--7.6
|
4.7
|
3.8--5.7
|
|
0.9
|
0.5--1.6
|
8.8
|
6.4--12.0
|
5.1
|
3.8--6.8
|
|
11
|
5.1
|
4.0--6.7
|
7.1
|
5.4--9.2
|
6.2
|
5.0--7.6
|
|
1.1
|
0.6--2.1
|
11.0
|
8.5--14.1
|
6.2
|
4.9--7.8
|
|
12
|
4.4
|
3.3--6.0
|
8.4
|
6.9--10.3
|
6.5
|
5.3--7.8
|
|
0.6
|
0.3--1.0
|
12.6
|
9.5--16.6
|
6.7
|
5.1--8.8
|
|
Total
|
4.0
|
3.4--4.7
|
6.2
|
5.3--7.2
|
5.1
|
4.5--5.8
|
|
1.1
|
0.8--1.5
|
9.4
|
7.3--12.0
|
5.5
|
4.4--6.8
|
|
|
Smoked cigarettes on school property*
|
|
Used smokeless tobacco on school property†
|
|
|
Female
|
Male
|
Total
|
|
Female
|
Male
|
Total
|
|
Site
|
%
|
CI§
|
%
|
CI
|
%
|
CI
|
|
%
|
CI
|
%
|
CI
|
%
|
CI
|
|
State surveys
|
|
|
|
|
|
|
|
|
|
|
|
|
|
|
Alabama
|
3.7
|
2.5--5.4
|
8.2
|
5.9--11.4
|
6.0
|
4.6--7.8
|
|
1.6
|
0.8--3.5
|
13.0
|
10.3--16.2
|
7.4
|
5.9--9.3
|
|
Alaska
|
4.3
|
2.8--6.6
|
4.1
|
2.7--6.3
|
4.5
|
3.2--6.2
|
|
3.5
|
2.0--6.0
|
9.6
|
6.7--13.6
|
6.7
|
4.8--9.3
|
|
Arizona
|
3.9
|
2.8--5.3
|
5.4
|
4.0--7.1
|
4.7
|
3.8--5.9
|
|
1.4
|
0.7--2.8
|
5.0
|
3.6--6.8
|
3.3
|
2.4--4.4
|
|
Arkansas
|
4.1
|
2.7--6.3
|
6.3
|
4.0--9.7
|
5.3
|
4.0--6.9
|
|
3.1
|
1.8--5.5
|
12.2
|
9.7--15.4
|
7.8
|
6.1--9.8
|
|
Colorado
|
7.7
|
5.1--11.4
|
8.8
|
5.8--13.1
|
8.3
|
5.8--11.6
|
|
2.6
|
1.7--4.1
|
9.1
|
6.7--12.3
|
5.9
|
4.4--7.9
|
|
Connecticut
|
---¶
|
---
|
---
|
---
|
---
|
---
|
|
---
|
---
|
---
|
---
|
---
|
---
|
|
Delaware
|
6.6
|
4.9--8.8
|
6.8
|
5.2--9.0
|
6.9
|
5.5--8.6
|
|
1.6
|
1.0--2.6
|
6.4
|
4.7--8.7
|
4.2
|
3.2--5.5
|
|
Florida
|
3.8
|
3.1--4.7
|
6.6
|
5.6--7.7
|
5.3
|
4.6--6.0
|
|
---
|
---
|
---
|
---
|
---
|
---
|
|
Georgia
|
3.4
|
2.2--5.2
|
6.2
|
4.8--8.1
|
4.7
|
3.6--6.2
|
|
1.1
|
0.7--1.9
|
9.0
|
6.3--12.6
|
5.0
|
3.5--7.0
|
|
Hawaii
|
---
|
---
|
---
|
---
|
---
|
---
|
|
---
|
---
|
---
|
---
|
---
|
---
|
|
Idaho
|
3.1
|
2.1--4.6
|
3.5
|
2.4--5.1
|
3.4
|
2.5--4.4
|
|
1.3
|
0.7--2.2
|
9.4
|
7.3--11.8
|
5.5
|
4.3--7.0
|
|
Illinois
|
4.5
|
3.3--5.9
|
6.9
|
5.2--9.0
|
5.8
|
4.6--7.3
|
|
1.5
|
0.8--2.8
|
7.4
|
5.7--9.6
|
4.7
|
3.6--6.0
|
|
Indiana
|
8.1
|
5.2--12.3
|
7.0
|
5.2--9.4
|
7.5
|
5.7--9.8
|
|
1.1
|
0.4--2.7
|
8.8
|
6.5--11.9
|
5.0
|
3.8--6.6
|
|
Kansas
|
3.2
|
2.0--5.3
|
5.3
|
3.6--7.6
|
4.3
|
3.1--5.9
|
|
1.1
|
0.5--2.1
|
6.9
|
4.9--9.6
|
4.0
|
3.0--5.4
|
|
Kentucky
|
7.9
|
5.3--11.6
|
10.9
|
8.2--14.3
|
9.4
|
7.3--12.0
|
|
1.5
|
0.8--3.0
|
16.8
|
14.2--19.8
|
9.3
|
7.8--11.2
|
|
Louisiana
|
2.5
|
1.6--3.9
|
4.4
|
2.2--8.7
|
3.4
|
2.2--5.3
|
|
1.3
|
0.8--2.1
|
10.0
|
6.5--15.2
|
5.6
|
3.5--8.7
|
|
Maine
|
---
|
---
|
---
|
---
|
---
|
---
|
|
---
|
---
|
---
|
---
|
---
|
---
|
|
Maryland
|
3.0
|
1.8--4.8
|
4.4
|
2.9--6.5
|
3.7
|
2.7--5.0
|
|
0.7
|
0.3--1.7
|
4.4
|
2.9--6.5
|
2.8
|
1.8--4.1
|
|
Massachusetts
|
4.8
|
3.5--6.5
|
8.6
|
6.5--11.3
|
6.7
|
5.3--8.5
|
|
---
|
---
|
---
|
---
|
---
|
---
|
|
Michigan
|
5.7
|
4.4--7.5
|
6.0
|
4.6--7.6
|
5.9
|
4.8--7.2
|
|
---
|
---
|
---
|
---
|
---
|
---
|
|
Mississippi
|
2.3
|
1.5--3.6
|
6.0
|
4.6--7.9
|
4.2
|
3.4--5.1
|
|
0.9
|
0.4--1.8
|
9.6
|
7.1--12.8
|
5.3
|
4.0--7.1
|
|
Missouri
|
4.0
|
2.4--6.6
|
5.2
|
3.2--8.4
|
4.6
|
3.0--7.0
|
|
0.7
|
0.2--2.0
|
10.2
|
7.5--13.9
|
5.5
|
4.0--7.6
|
|
Montana
|
5.5
|
3.9--7.6
|
5.3
|
3.9--7.3
|
5.4
|
4.1--7.0
|
|
1.0
|
0.5--1.9
|
16.1
|
12.0--21.3
|
8.8
|
6.6--11.7
|
|
Nevada
|
3.8
|
2.6--5.5
|
7.1
|
4.9--10.2
|
5.6
|
4.1--7.5
|
|
1.1
|
0.6--2.0
|
5.2
|
3.8--7.2
|
3.2
|
2.4--4.3
|
|
New Hampshire
|
---
|
---
|
---
|
---
|
---
|
---
|
|
---
|
---
|
---
|
---
|
---
|
---
|
|
New Jersey
|
---
|
---
|
---
|
---
|
---
|
---
|
|
---
|
---
|
---
|
---
|
---
|
---
|
|
New Mexico
|
7.9
|
6.1--10.2
|
9.5
|
7.9--11.4
|
8.7
|
7.4--10.2
|
|
---
|
---
|
---
|
---
|
---
|
---
|
|
New York
|
5.3
|
4.0--7.0
|
7.2
|
5.6--9.3
|
6.5
|
5.1--8.2
|
|
---
|
---
|
---
|
---
|
---
|
---
|
|
North Carolina
|
---
|
---
|
---
|
---
|
---
|
---
|
|
---
|
---
|
---
|
---
|
---
|
---
|
|
North Dakota
|
---
|
---
|
---
|
---
|
---
|
---
|
|
---
|
---
|
---
|
---
|
---
|
---
|
|
Oklahoma
|
4.3
|
2.5--7.2
|
6.0
|
4.1--8.8
|
5.2
|
3.6--7.4
|
|
0.6
|
0.2--1.8
|
9.5
|
7.0--12.7
|
5.1
|
3.6--7.0
|
|
Pennsylvania
|
3.4
|
2.3--4.8
|
5.0
|
3.7--6.9
|
4.2
|
3.4--5.2
|
|
0.9
|
0.4--1.8
|
7.1
|
5.0--9.9
|
4.0
|
2.9--5.5
|
|
Rhode Island
|
5.1
|
3.2--8.0
|
5.7
|
4.4--7.3
|
5.4
|
4.1--7.1
|
|
---
|
---
|
---
|
---
|
---
|
---
|
|
South Carolina
|
4.8
|
2.9--7.9
|
7.3
|
4.7--11.4
|
6.2
|
4.3--8.9
|
|
1.3
|
0.6--2.9
|
12.1
|
8.4--17.0
|
6.7
|
4.9--9.0
|
|
South Dakota
|
5.0
|
2.9--8.6
|
7.3
|
5.4--9.7
|
6.2
|
4.5--8.4
|
|
1.9
|
0.9--4.3
|
13.8
|
11.3--16.7
|
8.0
|
6.5--9.8
|
|
Tennessee
|
4.0
|
2.7--5.7
|
7.8
|
5.6--10.7
|
6.0
|
4.4--8.0
|
|
1.3
|
0.8--2.2
|
13.6
|
10.3--17.6
|
7.5
|
5.6--10.1
|
|
Texas
|
3.6
|
2.5--5.1
|
5.8
|
3.9--8.4
|
4.7
|
3.5--6.3
|
|
0.9
|
0.5--1.7
|
6.6
|
4.8--9.1
|
3.8
|
2.9--5.0
|
|
Utah
|
1.0
|
0.5--2.0
|
3.6
|
2.3--5.4
|
2.4
|
1.7--3.2
|
|
1.1
|
0.6--2.1
|
4.5
|
2.4--8.4
|
3.0
|
1.8--5.0
|
|
Vermont
|
---
|
---
|
---
|
---
|
---
|
---
|
|
---
|
---
|
---
|
---
|
---
|
---
|
|
West Virginia
|
4.6
|
2.8--7.5
|
6.2
|
4.6--8.2
|
5.5
|
4.1--7.2
|
|
1.5
|
0.9--2.4
|
16.8
|
13.0--21.6
|
9.3
|
7.3--11.8
|
|
Wisconsin
|
3.5
|
2.5--5.0
|
6.0
|
4.4--8.2
|
4.8
|
3.6--6.3
|
|
---
|
---
|
---
|
---
|
---
|
---
|
|
Wyoming
|
7.4
|
6.2--8.9
|
9.0
|
7.4--10.8
|
8.2
|
7.2--9.4
|
|
3.5
|
2.5--5.0
|
16.5
|
14.2--19.1
|
10.3
|
8.8--11.9
|
|
Median
|
4.2
|
6.2
|
5.4
|
|
1.3
|
9.5
|
5.5
|
|
Range
|
1.0--8.1
|
3.5--10.9
|
2.4--9.4
|
|
0.6--3.5
|
4.4--16.8
|
2.8--10.3
|
|
Local surveys
|
|
|
|
|
|
|
|
|
|
|
|
|
|
|
Boston, MA
|
3.4
|
2.4--5.0
|
6.7
|
3.7--12.0
|
5.0
|
3.3--7.6
|
|
0.0
|
----
|
2.3
|
1.2--4.2
|
1.1
|
0.6--2.1
|
|
Broward County, FL
|
4.6
|
3.2--6.5
|
5.5
|
4.1--7.3
|
5.1
|
4.0--6.4
|
|
2.1
|
1.0--4.1
|
6.0
|
4.0--8.9
|
4.1
|
2.7--6.2
|
|
Charlotte-Mecklenburg, NC
|
---
|
---
|
---
|
---
|
---
|
---
|
|
---
|
---
|
---
|
---
|
---
|
---
|
|
Chicago, IL
|
4.3
|
2.4--7.4
|
7.0
|
4.6--10.5
|
5.7
|
4.0--8.0
|
|
2.0
|
0.8--4.8
|
2.6
|
1.4--4.9
|
2.6
|
1.7--4.0
|
|
Clark County, NV
|
3.5
|
2.3--5.5
|
7.3
|
4.6--11.2
|
5.4
|
3.8--7.8
|
|
0.4
|
0.1--1.3
|
4.4
|
2.7--7.1
|
2.5
|
1.5--3.9
|
|
Dallas, TX
|
1.9
|
0.9--3.9
|
7.3
|
4.8--10.9
|
4.5
|
3.0--6.7
|
|
0.5
|
0.1--2.2
|
2.9
|
1.4--5.6
|
1.7
|
0.9--3.1
|
|
Detroit, MI
|
2.1
|
1.2--3.6
|
4.1
|
2.4--7.1
|
3.1
|
2.1--4.6
|
|
---
|
---
|
---
|
---
|
---
|
---
|
|
Duval County, FL
|
---
|
---
|
---
|
---
|
---
|
---
|
|
---
|
---
|
---
|
---
|
---
|
---
|
|
Los Angeles, CA
|
2.5
|
1.3--4.9
|
3.5
|
1.9--6.4
|
3.1
|
2.0--4.7
|
|
0.7
|
0.3--1.5
|
3.2
|
1.9--5.2
|
2.0
|
1.2--3.3
|
|
Memphis, TN
|
1.1
|
0.4--3.0
|
2.4
|
1.5--3.8
|
1.7
|
1.0--3.0
|
|
0.9
|
0.4--2.3
|
3.0
|
1.8--4.9
|
1.9
|
1.2--3.2
|
|
Miami-Dade County, FL
|
3.1
|
2.0--4.7
|
4.7
|
3.6--6.2
|
3.9
|
3.1--5.0
|
|
1.2
|
0.5--2.9
|
3.3
|
2.0--5.4
|
2.2
|
1.3--3.7
|
|
Milwaukee, WI
|
3.1
|
2.0--4.8
|
4.8
|
3.0--7.7
|
4.0
|
2.7--5.9
|
|
---
|
---
|
---
|
---
|
---
|
---
|
|
New York City, NY
|
3.1
|
2.3--4.3
|
4.1
|
3.4--4.8
|
3.6
|
3.0--4.3
|
|
---
|
---
|
---
|
---
|
---
|
---
|
|
Orange County, FL
|
1.0
|
0.4--2.1
|
4.5
|
2.8--7.0
|
2.7
|
1.8--4.0
|
|
1.1
|
0.5--2.6
|
5.1
|
3.5--7.3
|
3.1
|
2.3--4.3
|
|
Palm Beach County, FL
|
3.1
|
2.1--4.4
|
5.8
|
4.3--7.8
|
4.5
|
3.7--5.6
|
|
1.1
|
0.5--2.3
|
4.7
|
3.5--6.3
|
3.0
|
2.2--4.1
|
|
Philadelphia, PA
|
3.9
|
2.6--5.6
|
4.2
|
2.2--8.0
|
4.0
|
2.7--5.9
|
|
1.3
|
0.5--3.1
|
2.3
|
0.8--6.1
|
2.0
|
1.0--4.0
|
|
San Bernardino, CA
|
3.7
|
2.2--6.1
|
9.2
|
6.8--12.2
|
6.5
|
5.0--8.3
|
|
1.3
|
0.7--2.6
|
3.5
|
2.2--5.4
|
2.4
|
1.6--3.5
|
|
San Diego, CA
|
2.1
|
1.2--3.7
|
2.3
|
1.3--4.1
|
2.2
|
1.4--3.4
|
|
0.4
|
0.1--1.3
|
1.5
|
0.7--3.2
|
1.0
|
0.5--1.8
|
|
San Francisco, CA
|
2.9
|
1.9--4.4
|
5.2
|
3.8--7.1
|
4.1
|
3.3--5.1
|
|
1.1
|
0.6--2.3
|
1.8
|
1.1--2.9
|
1.5
|
0.9--2.3
|
|
Seattle, WA
|
3.6
|
2.5--5.1
|
6.3
|
4.6--8.6
|
5.3
|
4.2--6.6
|
|
1.2
|
0.7--2.0
|
3.5
|
2.2--5.4
|
2.7
|
1.9--3.8
|
|
Median
|
3.1
|
5.0
|
4.0
|
|
1.1
|
3.2
|
2.2
|
|
Range
|
1.0--4.6
|
2.3--9.2
|
1.7--6.5
|
|
0.0--2.1
|
1.5--6.0
|
1.0--4.1
|
|
|
Drank alcohol on school property
|
|
Used marijuana on school property
|
|
|
Female
|
Male
|
Total
|
|
Female
|
Male
|
Total
|
|
Category
|
%
|
CI§
|
%
|
CI
|
%
|
CI
|
|
%
|
CI
|
%
|
CI
|
%
|
CI
|
|
Race/Ethnicity
|
|
|
|
|
|
|
|
|
|
|
|
|
|
|
White¶
|
2.3
|
1.7--3.1
|
4.1
|
3.3--5.2
|
3.3
|
2.8--3.9
|
|
2.3
|
1.7--3.2
|
5.1
|
4.0--6.5
|
3.8
|
3.1--4.7
|
|
Black¶
|
4.8
|
3.5--6.6
|
5.9
|
4.5--7.7
|
5.4
|
4.3--6.7
|
|
2.9
|
2.0--4.1
|
8.3
|
6.5--10.6
|
5.6
|
4.5--7.1
|
|
Hispanic
|
5.9
|
4.5--7.7
|
7.9
|
6.2--9.9
|
6.9
|
5.6--8.5
|
|
4.2
|
2.8--6.4
|
8.7
|
7.0--10.7
|
6.5
|
5.1--8.2
|
|
Grade
|
|
|
|
|
|
|
|
|
|
|
|
|
|
|
9
|
4.5
|
3.5--5.6
|
4.3
|
3.4--5.4
|
4.4
|
3.7--5.2
|
|
3.4
|
2.5--4.6
|
5.2
|
4.0--6.7
|
4.3
|
3.6--5.2
|
|
10
|
3.5
|
2.7--4.6
|
5.9
|
4.4--7.8
|
4.8
|
3.9--5.8
|
|
2.5
|
1.7--3.7
|
6.4
|
5.1--8.2
|
4.6
|
3.7--5.7
|
|
11
|
3.4
|
2.5--4.7
|
5.7
|
4.5--7.2
|
4.6
|
3.8--5.6
|
|
3.0
|
2.1--4.4
|
6.9
|
5.5--8.7
|
5.0
|
4.0--6.3
|
|
12
|
2.7
|
2.0--3.6
|
5.4
|
4.2--6.8
|
4.1
|
3.3--5.1
|
|
2.1
|
1.5--2.9
|
7.0
|
5.5--9.0
|
4.6
|
3.7--5.7
|
|
Total
|
3.6
|
3.0--4.3
|
5.3
|
4.5--6.2
|
4.5
|
3.9--5.1
|
|
2.8
|
2.2--3.5
|
6.3
|
5.3--7.5
|
4.6
|
4.0--5.4
|
|
|
Drank alcohol on school property
|
|
Used marijuana on school property
|
|
|
Female
|
Male
|
Total
|
|
Female
|
Male
|
Total
|
|
Site
|
%
|
CI§
|
%
|
CI
|
%
|
CI
|
|
%
|
CI
|
%
|
CI
|
%
|
CI
|
|
State surveys
|
|
|
|
|
|
|
|
|
|
|
|
|
|
|
Alabama
|
4.1
|
2.6--6.3
|
6.6
|
5.0--8.6
|
5.4
|
4.0--7.2
|
|
2.6
|
1.5--4.4
|
6.5
|
4.5--9.5
|
4.6
|
3.1--6.6
|
|
Alaska
|
2.3
|
1.4--3.9
|
3.3
|
2.0--5.5
|
3.0
|
2.2--4.1
|
|
4.5
|
3.1--6.6
|
6.9
|
5.0--9.6
|
5.9
|
4.7--7.5
|
|
Arizona
|
5.5
|
3.8--7.9
|
6.0
|
5.0--7.1
|
5.9
|
4.8--7.3
|
|
4.7
|
2.9--7.4
|
7.7
|
6.2--9.5
|
6.4
|
5.0--8.1
|
|
Arkansas
|
4.6
|
3.1--6.7
|
7.6
|
5.3--10.9
|
6.1
|
4.5--8.2
|
|
2.9
|
1.7--5.1
|
6.1
|
3.8--9.9
|
4.5
|
2.8--7.2
|
|
Colorado
|
3.8
|
2.5--5.6
|
4.5
|
2.7--7.5
|
4.1
|
3.0--5.6
|
|
4.3
|
3.2--5.9
|
7.9
|
5.4--11.3
|
6.1
|
4.5--8.3
|
|
Connecticut
|
4.0
|
3.0--5.4
|
6.0
|
4.7--7.6
|
5.0
|
4.1--6.1
|
|
4.1
|
3.1--5.4
|
8.2
|
6.3--10.8
|
6.2
|
4.8--8.0
|
|
Delaware
|
4.6
|
3.0--6.9
|
5.3
|
3.7--7.5
|
5.0
|
3.8--6.7
|
|
3.8
|
2.5--5.9
|
7.2
|
5.7--9.0
|
5.6
|
4.4--7.2
|
|
Florida
|
3.6
|
3.0--4.3
|
6.0
|
5.1--7.0
|
4.9
|
4.4--5.4
|
|
3.1
|
2.5--3.9
|
7.2
|
6.0--8.7
|
5.2
|
4.4--6.0
|
|
Georgia
|
3.0
|
1.9--4.7
|
5.4
|
4.1--7.1
|
4.2
|
3.3--5.3
|
|
1.5
|
0.8--2.7
|
5.4
|
3.7--7.8
|
3.4
|
2.3--5.0
|
|
Hawaii
|
8.1
|
5.4--12.0
|
7.6
|
4.8--11.9
|
7.9
|
5.6--11.0
|
|
7.3
|
3.9--13.5
|
9.3
|
5.9--14.3
|
8.3
|
5.2--13.0
|
|
Idaho
|
3.4
|
2.4--4.9
|
3.5
|
2.3--5.3
|
3.5
|
2.6--4.7
|
|
2.5
|
1.6--3.7
|
3.5
|
2.4--5.0
|
3.0
|
2.2--4.1
|
|
Illinois
|
3.5
|
2.5--4.8
|
5.3
|
3.5--7.8
|
4.4
|
3.3--5.9
|
|
3.1
|
2.2--4.6
|
6.7
|
4.5--9.8
|
5.0
|
3.6--6.8
|
|
Indiana
|
2.7
|
1.6--4.5
|
4.3
|
3.1--6.0
|
3.5
|
2.6--4.8
|
|
4.2
|
2.7--6.5
|
4.7
|
3.4--6.4
|
4.4
|
3.3--5.9
|
|
Kansas
|
2.8
|
1.7--4.6
|
3.5
|
2.5--5.1
|
3.2
|
2.2--4.5
|
|
1.9
|
1.1--3.2
|
3.4
|
2.6--4.4
|
2.7
|
2.0--3.5
|
|
Kentucky
|
3.2
|
1.8--5.6
|
7.2
|
4.9--10.4
|
5.2
|
3.7--7.3
|
|
2.0
|
1.1--3.6
|
4.1
|
2.7--6.2
|
3.1
|
2.2--4.4
|
|
Louisiana
|
3.1
|
1.8--5.5
|
8.2
|
4.5--14.3
|
5.6
|
3.3--9.2
|
|
1.7
|
1.1--2.7
|
5.8
|
3.0--10.8
|
3.6
|
2.1--6.1
|
|
Maine
|
2.8
|
2.3--3.4
|
5.0
|
4.4--5.7
|
4.0
|
3.6--4.5
|
|
---¶
|
---
|
---
|
---
|
---
|
---
|
|
Maryland
|
4.7
|
2.9--7.8
|
4.7
|
3.2--6.9
|
4.8
|
3.5--6.4
|
|
3.7
|
2.7--5.3
|
6.2
|
4.4--8.7
|
5.0
|
3.8--6.6
|
|
Massachusetts
|
2.9
|
2.0--4.2
|
4.6
|
3.5--5.9
|
3.8
|
2.9--4.9
|
|
3.3
|
2.1--5.0
|
8.4
|
6.4--11.1
|
5.9
|
4.5--7.7
|
|
Michigan
|
3.1
|
2.3--4.4
|
4.2
|
3.0--5.7
|
3.7
|
3.0--4.7
|
|
4.0
|
2.7--5.7
|
5.7
|
4.3--7.4
|
4.8
|
3.7--6.2
|
|
Mississippi
|
3.3
|
2.2--4.7
|
5.3
|
4.1--6.8
|
4.3
|
3.5--5.4
|
|
1.7
|
0.9--3.1
|
3.4
|
2.4--4.7
|
2.5
|
1.7--3.7
|
|
Missouri
|
1.7
|
0.7--3.8
|
4.3
|
2.9--6.5
|
3.0
|
2.0--4.5
|
|
1.9
|
1.0--3.5
|
5.0
|
3.7--6.6
|
3.4
|
2.5--4.7
|
|
Montana
|
3.9
|
2.9--5.3
|
6.1
|
4.2--8.8
|
5.1
|
3.8--6.7
|
|
4.5
|
3.2--6.2
|
7.1
|
5.3--9.5
|
5.8
|
4.6--7.4
|
|
Nevada
|
4.1
|
3.1--5.4
|
4.8
|
3.4--6.8
|
4.4
|
3.5--5.6
|
|
3.1
|
2.1--4.6
|
6.5
|
4.8--8.6
|
4.9
|
3.9--6.1
|
|
New Hampshire
|
3.9
|
2.3--6.6
|
4.6
|
3.3--6.3
|
4.3
|
3.2--5.9
|
|
5.3
|
3.5--7.9
|
8.3
|
6.3--10.9
|
6.8
|
5.4--8.6
|
|
New Jersey
|
---
|
---
|
---
|
---
|
---
|
---
|
|
---
|
---
|
---
|
---
|
---
|
---
|
|
New Mexico
|
7.4
|
5.5--9.9
|
8.5
|
6.7--10.7
|
8.0
|
6.3--10.2
|
|
8.8
|
7.1--10.9
|
10.6
|
7.6--14.5
|
9.7
|
7.7--12.3
|
|
New York
|
---
|
---
|
---
|
---
|
---
|
---
|
|
---
|
---
|
---
|
---
|
---
|
---
|
|
North Carolina
|
3.5
|
2.2--5.5
|
4.7
|
3.8--5.8
|
4.1
|
3.1--5.3
|
|
2.4
|
1.5--3.9
|
5.7
|
4.0--8.0
|
4.0
|
2.9--5.4
|
|
North Dakota
|
2.9
|
1.7--5.0
|
5.4
|
4.1--7.1
|
4.2
|
3.3--5.4
|
|
2.9
|
1.6--5.1
|
4.7
|
3.4--6.5
|
3.8
|
2.8--5.2
|
|
Oklahoma
|
3.8
|
1.9--7.1
|
4.0
|
2.4--6.5
|
3.9
|
2.9--5.2
|
|
2.4
|
1.3--4.4
|
3.4
|
1.8--6.3
|
2.9
|
1.8--4.8
|
|
Pennsylvania
|
2.7
|
1.5--4.9
|
2.9
|
1.8--4.9
|
2.8
|
2.0--4.1
|
|
2.3
|
1.4--3.9
|
4.7
|
3.1--7.0
|
3.5
|
2.5--5.0
|
|
Rhode Island
|
2.3
|
1.6--3.3
|
4.2
|
2.9--6.0
|
3.2
|
2.3--4.5
|
|
3.0
|
2.0--4.4
|
7.3
|
5.7--9.3
|
5.1
|
4.0--6.5
|
|
South Carolina
|
3.0
|
1.6--5.5
|
4.0
|
2.4--6.6
|
3.6
|
2.3--5.7
|
|
1.6
|
0.7--3.4
|
5.8
|
4.2--8.1
|
3.7
|
2.6--5.3
|
|
South Dakota
|
---
|
---
|
---
|
---
|
---
|
---
|
|
1.5
|
0.8--2.7
|
4.2
|
2.8--6.2
|
2.9
|
2.0--4.0
|
|
Tennessee
|
2.4
|
1.7--3.5
|
3.7
|
2.7--4.9
|
3.0
|
2.3--3.9
|
|
3.0
|
1.9--4.7
|
4.5
|
3.1--6.6
|
3.8
|
2.6--5.4
|
|
Texas
|
3.9
|
3.0--5.0
|
5.4
|
4.2--7.0
|
4.7
|
4.0--5.5
|
|
3.2
|
2.2--4.5
|
5.9
|
4.4--7.9
|
4.6
|
3.7--5.8
|
|
Utah
|
1.8
|
1.0--3.1
|
3.4
|
1.9--5.8
|
2.7
|
1.9--3.8
|
|
1.9
|
0.9--3.9
|
2.6
|
1.4--4.9
|
2.5
|
1.7--3.7
|
|
Vermont
|
1.9
|
1.4--2.6
|
4.5
|
3.6--5.5
|
3.3
|
2.8--4.0
|
|
3.7
|
2.7--5.2
|
8.5
|
7.0--10.4
|
6.3
|
5.2--7.7
|
|
West Virginia
|
4.2
|
2.8--6.3
|
6.9
|
5.2--9.0
|
5.7
|
4.6--7.2
|
|
2.4
|
1.4--4.1
|
5.4
|
4.2--7.0
|
3.9
|
3.2--4.8
|
|
Wisconsin
|
---
|
---
|
---
|
---
|
---
|
---
|
|
---
|
---
|
---
|
---
|
---
|
---
|
|
Wyoming
|
4.7
|
3.6--6.1
|
8.1
|
6.6--9.7
|
6.4
|
5.5--7.5
|
|
3.0
|
2.2--4.0
|
7.4
|
6.0--9.0
|
5.3
|
4.4--6.2
|
|
Median
|
3.4
|
4.9
|
4.2
|
|
3.0
|
6.0
|
4.6
|
|
Range
|
1.7--8.1
|
2.9--8.5
|
2.7--8.0
|
|
1.5--8.8
|
2.6--10.6
|
2.5--9.7
|
|
Local surveys
|
|
|
|
|
|
|
|
|
|
|
|
|
|
|
Boston, MA
|
3.1
|
1.9--5.0
|
4.4
|
2.8--7.0
|
3.7
|
2.6--5.3
|
|
4.1
|
2.4--6.9
|
9.7
|
6.7--13.7
|
6.8
|
4.8--9.6
|
|
Broward County, FL
|
3.3
|
2.1--5.1
|
6.7
|
4.8--9.3
|
4.9
|
3.7--6.5
|
|
5.3
|
3.7--7.5
|
8.3
|
6.2--11.0
|
6.9
|
5.5--8.5
|
|
Charlotte-Mecklenburg, NC
|
3.0
|
2.0--4.4
|
5.2
|
3.3--8.1
|
4.1
|
3.0--5.6
|
|
2.4
|
1.2--4.5
|
8.4
|
6.1--11.4
|
5.3
|
3.9--7.1
|
|
Chicago, IL
|
6.2
|
4.1--9.3
|
7.8
|
5.3--11.3
|
7.1
|
5.3--9.5
|
|
5.5
|
3.8--8.0
|
10.2
|
7.2--14.1
|
8.0
|
6.4--10.1
|
|
Clark County, NV
|
4.7
|
3.4--6.5
|
5.1
|
3.3--8.0
|
4.9
|
3.7--6.5
|
|
3.3
|
2.0--5.3
|
6.8
|
4.6--9.8
|
5.1
|
3.8--6.7
|
|
Dallas, TX
|
5.5
|
3.2--9.4
|
5.7
|
3.4--9.4
|
5.6
|
3.9--8.0
|
|
2.5
|
1.5--4.4
|
10.9
|
8.1--14.4
|
6.6
|
5.0--8.7
|
|
Detroit, MI
|
4.1
|
2.9--5.6
|
4.4
|
2.8--7.0
|
4.2
|
3.1--5.7
|
|
4.1
|
2.8--6.0
|
8.0
|
5.6--11.4
|
6.1
|
4.6--8.1
|
|
Duval County, FL
|
5.0
|
3.8--6.4
|
6.4
|
5.2--8.0
|
5.8
|
4.9--6.9
|
|
4.0
|
2.7--5.9
|
7.9
|
6.1--10.2
|
6.0
|
4.7--7.6
|
|
Los Angeles, CA
|
6.1
|
3.9--9.3
|
7.6
|
5.7--10.1
|
6.9
|
5.0--9.4
|
|
5.5
|
3.4--9.0
|
9.8
|
6.7--13.9
|
7.7
|
6.0--9.9
|
|
Memphis, TN
|
2.4
|
1.4--4.2
|
4.8
|
3.3--6.9
|
3.5
|
2.5--5.0
|
|
4.6
|
2.9--7.2
|
9.4
|
6.4--13.5
|
6.9
|
5.0--9.3
|
|
Miami-Dade County, FL
|
4.4
|
3.0--6.2
|
6.5
|
5.0--8.5
|
5.4
|
4.3--6.8
|
|
4.9
|
3.7--6.6
|
9.0
|
7.1--11.4
|
7.1
|
5.8--8.6
|
|
Milwaukee, WI
|
---
|
---
|
---
|
---
|
---
|
---
|
|
---
|
---
|
---
|
---
|
---
|
---
|
|
New York City, NY
|
---
|
---
|
---
|
---
|
---
|
---
|
|
---
|
---
|
---
|
---
|
---
|
---
|
|
Orange County, FL
|
4.9
|
3.4--7.2
|
6.6
|
4.7--9.1
|
5.7
|
4.4--7.4
|
|
2.8
|
1.7--4.7
|
7.1
|
4.8--10.5
|
5.0
|
3.5--7.0
|
|
Palm Beach County, FL
|
2.8
|
1.9--4.1
|
5.6
|
4.4--7.1
|
4.3
|
3.5--5.3
|
|
3.7
|
2.5--5.4
|
7.2
|
5.6--9.2
|
5.6
|
4.5--6.8
|
|
Philadelphia, PA
|
4.2
|
2.9--6.2
|
4.0
|
1.8--8.6
|
4.1
|
2.6--6.3
|
|
5.6
|
4.0--7.9
|
7.1
|
4.5--10.9
|
6.4
|
4.6--8.8
|
|
San Bernardino, CA
|
10.0
|
7.3--13.6
|
11.9
|
9.2--15.2
|
10.9
|
9.0--13.2
|
|
7.4
|
5.1--10.6
|
14.1
|
11.2--17.7
|
10.8
|
8.7--13.2
|
|
San Diego, CA
|
8.4
|
6.4--11.0
|
6.6
|
5.2--8.3
|
7.5
|
6.2--9.0
|
|
3.4
|
2.6--4.6
|
5.4
|
4.1--6.9
|
4.4
|
3.6--5.4
|
|
San Francisco, CA
|
6.1
|
4.2--8.6
|
5.9
|
4.7--7.5
|
6.0
|
4.8--7.4
|
|
4.0
|
2.8--5.7
|
6.5
|
4.9--8.6
|
5.5
|
4.4--6.8
|
|
Seattle, WA
|
4.7
|
3.4--6.5
|
6.6
|
4.6--9.3
|
6.0
|
4.6--7.7
|
|
5.0
|
3.6--6.9
|
7.8
|
6.0--10.1
|
6.7
|
5.3--8.3
|
|
Median
|
4.7
|
6.1
|
5.5
|
|
4.1
|
8.1
|
6.5
|
|
Range
|
2.4--10.0
|
4.0--11.9
|
3.5--10.9
|
|
2.4--7.4
|
5.4--14.1
|
4.4--10.8
|
|
|
Female
|
Male
|
Total
|
|
Category
|
%
|
CI†
|
%
|
CI
|
%
|
CI
|
|
Race/Ethnicity
|
|
|
|
|
|
|
|
White§
|
16.5
|
14.4--18.9
|
22.7
|
19.7--26.0
|
19.8
|
17.6--22.2
|
|
Black§
|
18.8
|
15.0--23.2
|
25.7
|
22.0--29.7
|
22.2
|
19.5--25.2
|
|
Hispanic
|
27.1
|
23.3--31.2
|
35.1
|
32.0--38.4
|
31.2
|
28.2--34.4
|
|
Grade
|
|
|
|
|
|
|
|
9
|
21.1
|
18.4--24.0
|
22.9
|
19.2--27.0
|
22.0
|
19.5--24.8
|
|
10
|
19.6
|
17.2--22.3
|
27.3
|
24.0--30.9
|
23.7
|
21.5--26.0
|
|
11
|
20.5
|
17.7--23.7
|
27.8
|
23.9--32.1
|
24.3
|
21.5--27.3
|
|
12
|
15.4
|
12.8--18.3
|
25.8
|
22.9--28.8
|
20.6
|
18.3--23.2
|
|
Total
|
19.3
|
17.3--21.4
|
25.9
|
23.2--28.7
|
22.7
|
20.7--24.9
|
|
|
Female
|
Male
|
Total
|
|
Site
|
%
|
CI†
|
%
|
CI
|
%
|
CI
|
|
State surveys
|
|
|
|
|
|
|
|
Alabama
|
24.6
|
19.8--30.0
|
30.7
|
27.4--34.3
|
27.6
|
25.0--30.4
|
|
Alaska
|
21.6
|
18.5--25.1
|
28.0
|
24.5--31.8
|
24.8
|
22.4--27.4
|
|
Arizona
|
30.9
|
27.3--34.6
|
38.0
|
33.7--42.6
|
34.6
|
31.7--37.5
|
|
Arkansas
|
28.8
|
25.1--32.9
|
34.1
|
29.8--38.5
|
31.4
|
28.2--34.7
|
|
Colorado
|
19.7
|
16.5--23.4
|
25.7
|
21.0--30.9
|
22.7
|
19.7--26.1
|
|
Connecticut
|
25.1
|
22.0--28.6
|
32.7
|
29.4--36.2
|
28.9
|
26.4--31.6
|
|
Delaware
|
17.2
|
14.4--20.4
|
24.4
|
21.6--27.5
|
20.9
|
19.2--22.7
|
|
Florida
|
18.0
|
16.0--20.2
|
25.4
|
23.9--27.0
|
21.8
|
20.4--23.3
|
|
Georgia
|
29.4
|
26.7--32.2
|
36.6
|
32.0--41.4
|
32.9
|
30.4--35.5
|
|
Hawaii
|
34.1
|
30.7--37.7
|
38.2
|
32.8--44.0
|
36.1
|
33.1--39.2
|
|
Idaho
|
20.7
|
17.4--24.3
|
24.4
|
21.3--27.8
|
22.7
|
20.0--25.6
|
|
Illinois
|
22.5
|
18.7--27.0
|
32.3
|
26.8--38.2
|
27.5
|
23.7--31.7
|
|
Indiana
|
23.7
|
20.1--27.8
|
27.3
|
23.9--31.0
|
25.5
|
23.0--28.1
|
|
Kansas
|
12.7
|
10.9--14.7
|
17.4
|
14.8--20.4
|
15.1
|
13.6--16.8
|
|
Kentucky
|
23.1
|
19.0--27.7
|
27.9
|
24.6--31.5
|
25.6
|
22.6--28.7
|
|
Louisiana
|
20.9
|
17.4--24.8
|
24.7
|
19.7--30.4
|
22.8
|
19.4--26.6
|
|
Maine
|
17.1
|
15.9--18.4
|
24.9
|
23.5--26.5
|
21.2
|
20.2--22.2
|
|
Maryland
|
24.8
|
21.5--28.3
|
33.7
|
29.6--38.0
|
29.3
|
26.5--32.2
|
|
Massachusetts
|
21.7
|
18.7--25.0
|
30.5
|
27.2--34.0
|
26.1
|
23.5--29.0
|
|
Michigan
|
27.7
|
25.4--30.1
|
31.3
|
28.5--34.3
|
29.5
|
27.6--31.4
|
|
Mississippi
|
14.6
|
12.2--17.5
|
21.5
|
18.1--25.4
|
18.0
|
15.9--20.4
|
|
Missouri
|
15.5
|
12.9--18.4
|
19.0
|
15.6--23.0
|
17.3
|
14.6--20.3
|
|
Montana
|
16.4
|
13.6--19.5
|
24.5
|
21.6--27.6
|
20.7
|
18.6--23.0
|
|
Nevada
|
32.8
|
30.2--35.5
|
38.1
|
34.4--42.1
|
35.6
|
33.0--38.2
|
|
New Hampshire
|
18.3
|
14.4--23.1
|
25.4
|
21.0--30.4
|
22.1
|
19.4--25.1
|
|
New Jersey
|
27.8
|
24.4--31.4
|
36.3
|
32.0--40.9
|
32.2
|
29.4--35.2
|
|
New Mexico
|
29.4
|
26.1--32.9
|
32.3
|
28.7--36.2
|
30.9
|
27.7--34.4
|
|
New York
|
20.2
|
17.9--22.7
|
27.3
|
24.5--30.2
|
24.0
|
22.0--26.2
|
|
North Carolina
|
23.4
|
20.4--26.7
|
37.2
|
33.5--41.1
|
30.2
|
27.3--33.2
|
|
North Dakota
|
16.9
|
14.6--19.5
|
21.6
|
18.4--25.3
|
19.5
|
17.3--21.9
|
|
Oklahoma
|
15.0
|
11.7--19.0
|
18.3
|
14.5--22.9
|
16.8
|
13.9--20.1
|
|
Pennsylvania
|
13.6
|
10.7--17.1
|
18.6
|
16.1--21.4
|
16.1
|
14.0--18.4
|
|
Rhode Island
|
21.4
|
17.6--25.8
|
28.7
|
25.3--32.3
|
25.2
|
22.1--28.5
|
|
South Carolina
|
23.0
|
19.0--27.6
|
32.4
|
25.5--40.1
|
27.6
|
24.1--31.4
|
|
South Dakota
|
15.7
|
13.0--18.8
|
19.6
|
17.3--22.2
|
17.7
|
16.4--19.0
|
|
Tennessee
|
16.7
|
14.5--19.1
|
21.0
|
18.2--24.1
|
18.8
|
16.8--21.1
|
|
Texas
|
23.4
|
20.7--26.3
|
28.2
|
25.3--31.4
|
25.9
|
23.4--28.6
|
|
Utah
|
16.7
|
13.6--20.3
|
22.5
|
18.2--27.6
|
19.7
|
16.7--23.0
|
|
Vermont
|
17.8
|
15.7--20.2
|
23.9
|
20.6--27.6
|
21.1
|
18.5--23.9
|
|
West Virginia
|
26.4
|
23.0--30.1
|
29.5
|
25.3--34.0
|
28.0
|
25.4--30.7
|
|
Wisconsin
|
19.3
|
16.4--22.6
|
21.7
|
19.0--24.6
|
20.5
|
18.4--22.7
|
|
Wyoming
|
21.6
|
19.3--24.1
|
25.5
|
23.0--28.1
|
23.7
|
21.9--25.6
|
|
Median
|
21.5
|
27.3
|
24.4
|
|
Range
|
12.7--34.1
|
17.4--38.2
|
15.1--36.1
|
|
Local surveys
|
|
|
|
|
|
|
|
Boston, MA
|
19.5
|
16.1--23.4
|
26.7
|
22.8--31.0
|
23.2
|
20.5--26.1
|
|
Broward County, FL
|
19.8
|
16.6--23.4
|
26.6
|
22.3--31.3
|
23.2
|
20.4--26.2
|
|
Charlotte-Mecklenburg, NC
|
31.1
|
27.2--35.3
|
45.0
|
41.3--48.7
|
37.9
|
35.3--40.6
|
|
Chicago, IL
|
27.3
|
24.4--30.4
|
36.6
|
30.5--43.1
|
32.1
|
28.2--36.4
|
|
Clark County, NV
|
34.6
|
31.6--37.7
|
42.7
|
37.8--47.7
|
38.8
|
35.6--42.0
|
|
Dallas, TX
|
33.7
|
28.7--39.1
|
44.1
|
38.9--49.5
|
38.7
|
34.7--42.8
|
|
Detroit, MI
|
22.1
|
19.0--25.5
|
31.2
|
25.5--37.5
|
26.6
|
23.3--30.3
|
|
Duval County, FL
|
33.8
|
30.9--36.9
|
39.9
|
36.3--43.7
|
36.8
|
34.2--39.4
|
|
Los Angeles, CA
|
36.0
|
29.3--43.4
|
42.8
|
37.4--48.5
|
39.5
|
33.9--45.4
|
|
Memphis, TN
|
12.4
|
10.0--15.4
|
19.2
|
16.1--22.6
|
15.8
|
13.8--17.9
|
|
Miami-Dade County, FL
|
22.5
|
19.4--26.0
|
28.1
|
25.2--31.3
|
25.6
|
23.2--28.1
|
|
Milwaukee, WI
|
17.4
|
14.7--20.4
|
28.5
|
25.3--32.1
|
23.0
|
21.0--25.1
|
|
New York City, NY
|
19.6
|
17.8--21.5
|
27.5
|
25.5--29.6
|
23.3
|
21.7--24.9
|
|
Orange County, FL
|
23.8
|
19.8--28.4
|
28.0
|
23.9--32.5
|
25.9
|
22.6--29.6
|
|
Palm Beach County, FL
|
20.3
|
17.7--23.2
|
25.8
|
22.7--29.2
|
23.1
|
21.0--25.4
|
|
Philadelphia, PA
|
20.0
|
16.7--23.8
|
30.8
|
26.0--36.0
|
25.2
|
21.9--28.7
|
|
San Bernardino, CA
|
25.0
|
21.6--28.8
|
36.7
|
32.8--40.9
|
31.0
|
28.1--34.0
|
|
San Diego, CA
|
29.2
|
26.2--32.3
|
28.3
|
25.3--31.5
|
28.7
|
26.4--31.1
|
|
San Francisco, CA
|
31.6
|
28.9--34.4
|
36.7
|
33.7--39.8
|
34.1
|
32.0--36.4
|
|
Seattle, WA
|
28.0
|
24.8--31.4
|
35.8
|
32.1--39.6
|
32.0
|
29.3--34.9
|
|
Median
|
24.4
|
31.0
|
27.6
|
|
Range
|
12.4--36.0
|
19.2--45.0
|
15.8--39.5
|
|
|
Ever had sexual intercourse
|
|
Had first sexual intercourse before age 13 years
|
|
|
Female
|
Male
|
Total
|
|
Female
|
Male
|
Total
|
|
Category
|
%
|
CI*
|
%
|
CI
|
%
|
CI
|
|
%
|
CI
|
%
|
CI
|
%
|
CI
|
|
Race/Ethnicity
|
|
|
|
|
|
|
|
|
|
|
|
|
|
|
White†
|
44.7
|
41.0--48.4
|
39.6
|
33.9--45.6
|
42.0
|
37.9--46.3
|
|
2.2
|
1.7--3.0
|
4.4
|
3.4--5.8
|
3.4
|
2.7--4.3
|
|
Black†
|
58.3
|
53.5--63.0
|
72.1
|
67.8--76.1
|
65.2
|
62.0--68.3
|
|
5.6
|
4.0--7.7
|
24.9
|
21.6--28.6
|
15.2
|
13.1--17.6
|
|
Hispanic
|
45.4
|
41.6--49.4
|
52.8
|
49.2--56.4
|
49.1
|
46.0--52.2
|
|
3.7
|
2.7--4.9
|
9.8
|
8.5--11.2
|
6.7
|
5.9--7.7
|
|
Grade
|
|
|
|
|
|
|
|
|
|
|
|
|
|
|
9
|
29.3
|
26.3--32.4
|
33.6
|
29.1--38.5
|
31.6
|
28.7--34.7
|
|
3.6
|
2.8--4.8
|
11.3
|
8.9--14.2
|
7.7
|
6.3--9.3
|
|
10
|
39.6
|
36.0--43.4
|
41.9
|
34.8--49.3
|
40.9
|
36.7--45.2
|
|
3.6
|
2.7--4.8
|
9.0
|
6.9--11.7
|
6.5
|
5.3--8.0
|
|
11
|
52.5
|
47.7--57.3
|
53.4
|
48.2--58.4
|
53.0
|
48.5--57.4
|
|
2.7
|
1.8--3.8
|
5.9
|
4.5--7.7
|
4.3
|
3.5--5.4
|
|
12
|
65.0
|
60.7--69.0
|
59.6
|
53.1--65.7
|
62.3
|
58.5--65.9
|
|
2.2
|
1.5--3.2
|
6.4
|
5.0--8.1
|
4.4
|
3.5--5.4
|
|
Total
|
45.7
|
43.0--48.5
|
46.1
|
41.5--50.9
|
46.0
|
42.9--49.2
|
|
3.1
|
2.7--3.6
|
8.4
|
7.0--10.1
|
5.9
|
5.1--6.8
|
|
|
Ever had sexual intercourse
|
|
Had first sexual intercourse before age 13 years
|
|
|
Female
|
Male
|
Total
|
|
Female
|
Male
|
Total
|
|
Site
|
%
|
CI*
|
%
|
CI
|
%
|
CI
|
|
%
|
CI
|
%
|
CI
|
%
|
CI
|
|
State surveys
|
|
|
|
|
|
|
|
|
|
|
|
|
|
|
Alabama
|
51.4
|
46.8--56.1
|
61.8
|
55.5--67.8
|
56.6
|
51.5--61.6
|
|
4.1
|
2.6--6.5
|
16.2
|
11.8--21.7
|
10.1
|
7.3--13.7
|
|
Alaska
|
42.9
|
37.0--48.9
|
44.0
|
39.5--48.6
|
43.5
|
39.4--47.6
|
|
2.6
|
1.6--4.2
|
7.1
|
4.6--10.9
|
5.1
|
3.6--7.0
|
|
Arizona
|
44.8
|
41.0--48.7
|
52.1
|
46.5--57.7
|
48.6
|
44.4--52.7
|
|
2.9
|
1.8--4.5
|
7.8
|
5.9--10.3
|
5.5
|
4.1--7.4
|
|
Arkansas
|
51.4
|
46.2--56.5
|
55.9
|
50.6--61.1
|
53.6
|
49.4--57.7
|
|
6.7
|
4.9--9.1
|
14.3
|
10.7--19.0
|
10.3
|
8.0--13.1
|
|
Colorado
|
36.2
|
28.1--45.1
|
43.7
|
36.7--50.9
|
40.0
|
32.7--47.7
|
|
2.7
|
1.5--4.8
|
6.4
|
4.1--9.7
|
4.6
|
3.3--6.3
|
|
Connecticut
|
38.0
|
33.3--42.9
|
42.9
|
38.2--47.8
|
40.5
|
36.4--44.8
|
|
2.8
|
1.9--4.2
|
6.1
|
4.3--8.7
|
4.6
|
3.3--6.2
|
|
Delaware
|
57.1
|
52.5--61.6
|
57.9
|
53.2--62.4
|
57.5
|
53.8--61.2
|
|
5.8
|
4.4--7.5
|
13.4
|
10.9--16.4
|
9.7
|
8.3--11.4
|
|
Florida
|
47.7
|
44.9--50.4
|
53.4
|
50.5--56.3
|
50.6
|
48.1--53.1
|
|
4.3
|
3.6--5.1
|
12.0
|
10.4--13.8
|
8.3
|
7.3--9.3
|
|
Georgia
|
---†
|
---
|
---
|
---
|
---
|
---
|
|
---
|
---
|
---
|
---
|
---
|
---
|
|
Hawaii
|
45.8
|
37.0--55.0
|
42.7
|
35.2--50.6
|
44.3
|
37.2--51.6
|
|
4.1
|
3.0--5.5
|
7.8
|
5.3--11.4
|
6.0
|
4.8--7.5
|
|
Idaho
|
39.2
|
35.5--43.1
|
38.8
|
35.3--42.5
|
39.0
|
36.0--42.1
|
|
3.4
|
2.4--4.7
|
4.9
|
3.9--6.2
|
4.2
|
3.4--5.1
|
|
Illinois
|
43.8
|
38.8--48.9
|
52.3
|
46.1--58.5
|
48.1
|
43.0--53.2
|
|
3.6
|
2.4--5.3
|
8.9
|
7.1--11.1
|
6.3
|
5.1--7.7
|
|
Indiana
|
52.8
|
47.7--57.9
|
45.5
|
39.3--51.8
|
49.2
|
44.5--54.0
|
|
2.8
|
1.7--4.5
|
6.3
|
3.6--10.9
|
4.5
|
2.9--7.1
|
|
Kansas
|
46.2
|
40.4--52.1
|
47.0
|
42.0--52.0
|
46.6
|
42.1--51.2
|
|
1.7
|
1.0--2.9
|
7.2
|
5.5--9.4
|
4.5
|
3.4--5.9
|
|
Kentucky
|
47.8
|
41.6--54.0
|
49.0
|
43.6--54.4
|
48.3
|
43.8--52.7
|
|
4.0
|
2.6--6.1
|
9.3
|
6.6--13.0
|
6.7
|
4.9--9.0
|
|
Louisiana
|
---
|
---
|
---
|
---
|
---
|
---
|
|
---
|
---
|
---
|
---
|
---
|
---
|
|
Maine
|
45.9
|
43.9--47.8
|
45.9
|
43.9--48.0
|
46.0
|
44.3--47.6
|
|
2.8
|
2.3--3.4
|
7.3
|
6.4--8.3
|
5.0
|
4.5--5.6
|
|
Maryland
|
---
|
---
|
---
|
---
|
---
|
---
|
|
---
|
---
|
---
|
---
|
---
|
---
|
|
Massachusetts
|
44.6
|
40.3--49.0
|
48.0
|
43.7--52.4
|
46.4
|
42.6--50.2
|
|
3.0
|
2.1--4.1
|
8.0
|
6.0--10.5
|
5.4
|
4.3--6.8
|
|
Michigan
|
44.3
|
38.9--49.8
|
46.9
|
42.5--51.4
|
45.6
|
41.1--50.1
|
|
3.0
|
2.1--4.2
|
7.2
|
5.4--9.6
|
5.1
|
4.1--6.5
|
|
Mississippi
|
58.2
|
51.3--64.8
|
63.9
|
57.8--69.6
|
61.0
|
54.8--66.8
|
|
8.1
|
6.4--10.3
|
18.7
|
15.1--23.0
|
13.4
|
11.0--16.2
|
|
Missouri
|
47.3
|
39.3--55.4
|
50.2
|
42.4--57.9
|
48.7
|
41.4--56.2
|
|
3.4
|
2.2--5.2
|
7.9
|
5.5--11.2
|
5.7
|
4.0--8.1
|
|
Montana
|
47.0
|
42.4--51.7
|
48.1
|
41.6--54.7
|
47.6
|
42.8--52.4
|
|
3.7
|
2.0--6.7
|
7.7
|
5.1--11.3
|
5.7
|
3.8--8.6
|
|
Nevada
|
45.3
|
40.7--49.9
|
52.6
|
47.5--57.8
|
49.0
|
44.7--53.4
|
|
3.4
|
2.4--4.7
|
10.0
|
8.3--12.0
|
6.7
|
5.6--8.0
|
|
New Hampshire
|
46.2
|
41.5--51.0
|
46.1
|
41.5--50.9
|
46.3
|
42.1--50.5
|
|
1.9
|
1.1--3.2
|
6.4
|
4.4--9.2
|
4.3
|
3.2--5.8
|
|
New Jersey
|
43.6
|
36.8--50.6
|
49.0
|
42.3--55.9
|
46.3
|
40.0--52.7
|
|
1.5
|
0.6--3.4
|
6.7
|
4.3--10.2
|
4.1
|
2.7--6.2
|
|
New Mexico
|
---
|
---
|
---
|
---
|
---
|
---
|
|
4.7
|
4.0--5.6
|
10.1
|
8.5--12.0
|
7.4
|
6.6--8.4
|
|
New York
|
38.4
|
33.8--43.3
|
45.6
|
42.3--49.0
|
42.0
|
38.6--45.6
|
|
3.3
|
2.3--4.7
|
8.8
|
6.7--11.5
|
6.1
|
4.9--7.6
|
|
North Carolina
|
48.2
|
43.2--53.1
|
54.2
|
48.7--59.6
|
51.1
|
46.2--56.0
|
|
5.1
|
4.3--6.2
|
10.1
|
8.4--12.0
|
7.5
|
6.5--8.7
|
|
North Dakota
|
46.7
|
42.5--50.9
|
42.3
|
36.9--48.0
|
44.6
|
41.0--48.4
|
|
2.1
|
1.0--4.4
|
4.8
|
3.2--7.0
|
3.5
|
2.5--4.9
|
|
Oklahoma
|
50.7
|
43.2--58.2
|
51.2
|
45.2--57.2
|
51.1
|
44.9--57.2
|
|
3.4
|
2.0--5.7
|
6.0
|
4.2--8.3
|
4.7
|
3.5--6.2
|
|
Pennsylvania
|
51.0
|
44.4--57.4
|
45.8
|
38.8--53.1
|
48.3
|
42.1--54.6
|
|
3.6
|
2.3--5.4
|
7.9
|
5.2--11.7
|
5.8
|
4.1--8.0
|
|
Rhode Island
|
42.8
|
38.5--47.3
|
45.6
|
40.7--50.6
|
44.2
|
39.9--48.7
|
|
2.4
|
1.5--3.9
|
8.0
|
6.4--9.8
|
5.2
|
4.2--6.4
|
|
South Carolina
|
50.7
|
43.4--58.1
|
56.3
|
48.8--63.6
|
53.4
|
46.9--59.8
|
|
6.3
|
4.4--9.0
|
12.2
|
8.8--16.6
|
9.2
|
7.3--11.5
|
|
South Dakota
|
46.9
|
39.6--54.4
|
47.1
|
43.4--50.9
|
47.0
|
42.4--51.7
|
|
3.7
|
2.1--6.4
|
7.6
|
5.5--10.6
|
5.7
|
4.3--7.5
|
|
Tennessee
|
51.2
|
46.6--55.8
|
55.6
|
49.0--61.9
|
53.4
|
49.2--57.5
|
|
3.3
|
2.3--4.8
|
11.5
|
9.0--14.7
|
7.5
|
5.9--9.5
|
|
Texas
|
49.3
|
45.9--52.7
|
53.9
|
50.2--57.6
|
51.6
|
48.9--54.3
|
|
3.1
|
2.2--4.3
|
9.1
|
7.7--10.6
|
6.1
|
5.2--7.1
|
|
Utah
|
---
|
---
|
---
|
---
|
---
|
---
|
|
---
|
---
|
---
|
---
|
---
|
---
|
|
Vermont
|
---
|
---
|
---
|
---
|
---
|
---
|
|
2.9
|
2.2--3.9
|
6.5
|
6.0--7.1
|
4.8
|
4.4--5.3
|
|
West Virginia
|
54.7
|
48.6--60.7
|
53.6
|
47.6--59.4
|
54.1
|
48.5--59.6
|
|
4.6
|
3.2--6.5
|
7.5
|
5.6--10.0
|
6.0
|
4.8--7.6
|
|
Wisconsin
|
41.1
|
35.5--46.8
|
40.7
|
34.5--47.3
|
40.9
|
35.5--46.6
|
|
2.5
|
1.4--4.2
|
4.4
|
2.9--6.5
|
3.4
|
2.4--4.8
|
|
Wyoming
|
51.6
|
47.9--55.2
|
49.6
|
46.1--53.1
|
50.6
|
47.7--53.4
|
|
3.0
|
2.2--4.0
|
8.8
|
7.2--10.6
|
5.9
|
4.9--7.1
|
|
Median
|
46.8
|
48.5
|
48.2
|
|
3.3
|
7.8
|
5.7
|
|
Range
|
36.2--58.2
|
38.8--63.9
|
39.0--61.0
|
|
1.5--8.1
|
4.4--18.7
|
3.4--13.4
|
|
Local surveys
|
|
|
|
|
|
|
|
|
|
|
|
|
|
|
Boston, MA
|
44.9
|
39.9--50.1
|
63.0
|
57.7--68.1
|
53.6
|
49.4--57.7
|
|
3.5
|
2.2--5.7
|
14.6
|
11.1--19.0
|
9.0
|
7.1--11.3
|
|
Broward County, FL
|
47.2
|
41.5--53.1
|
58.0
|
53.0--62.8
|
52.2
|
47.6--56.8
|
|
5.3
|
3.6--7.7
|
13.5
|
10.3--17.4
|
9.2
|
7.4--11.2
|
|
Charlotte-Mecklenburg, NC
|
44.4
|
38.5--50.5
|
54.9
|
49.8--59.9
|
49.6
|
44.9--54.2
|
|
3.3
|
2.4--4.7
|
12.2
|
9.9--15.0
|
7.6
|
6.3--9.2
|
|
Chicago, IL
|
45.3
|
39.0--51.8
|
61.9
|
53.4--69.7
|
53.6
|
48.0--59.2
|
|
5.1
|
3.4--7.5
|
18.4
|
12.8--25.8
|
12.0
|
8.8--16.0
|
|
Clark County, NV
|
45.1
|
40.1--50.3
|
50.3
|
43.8--56.8
|
47.8
|
42.8--52.9
|
|
3.7
|
2.5--5.5
|
10.2
|
8.1--12.7
|
7.0
|
5.6--8.7
|
|
Dallas, TX
|
49.0
|
41.4--56.7
|
62.7
|
55.0--69.8
|
55.5
|
49.1--61.7
|
|
3.8
|
2.3--6.2
|
15.5
|
11.5--20.6
|
9.4
|
7.3--12.1
|
|
Detroit, MI
|
51.6
|
45.1--58.1
|
72.4
|
63.4--79.8
|
61.6
|
56.0--66.9
|
|
4.0
|
2.5--6.4
|
26.0
|
21.1--31.7
|
14.3
|
11.8--17.4
|
|
Duval County, FL
|
50.7
|
46.4--55.0
|
57.5
|
53.1--61.7
|
53.9
|
50.5--57.2
|
|
4.8
|
3.5--6.7
|
15.9
|
13.4--18.9
|
10.1
|
8.5--12.0
|
|
Los Angeles, CA
|
32.6
|
26.0--40.0
|
44.2
|
34.2--54.8
|
38.3
|
30.2--47.1
|
|
1.7
|
0.8--3.6
|
8.6
|
5.6--12.9
|
5.1
|
3.7--6.9
|
|
Memphis, TN
|
53.4
|
47.0--59.7
|
70.7
|
66.0--75.0
|
61.6
|
57.0--66.1
|
|
3.8
|
2.5--5.7
|
21.6
|
17.4--26.4
|
12.1
|
9.8--15.0
|
|
Miami-Dade County, FL
|
47.0
|
42.7--51.4
|
59.9
|
55.6--63.9
|
53.4
|
49.9--56.8
|
|
4.7
|
3.5--6.4
|
14.5
|
12.0--17.4
|
9.6
|
8.0--11.4
|
|
Milwaukee, WI
|
58.5
|
53.4--63.3
|
68.2
|
63.8--72.3
|
63.1
|
59.3--66.8
|
|
5.3
|
3.8--7.3
|
19.9
|
16.6--23.8
|
12.2
|
10.5--14.2
|
|
New York City, NY
|
34.5
|
30.3--38.9
|
45.2
|
39.6--50.9
|
39.3
|
34.9--44.0
|
|
4.1
|
3.3--5.0
|
13.5
|
11.2--16.2
|
8.3
|
7.2--9.7
|
|
Orange County, FL
|
43.7
|
38.5--49.1
|
58.5
|
52.5--64.3
|
51.0
|
46.4--55.7
|
|
3.3
|
1.9--5.6
|
10.8
|
8.4--13.9
|
7.0
|
5.6--8.8
|
|
Palm Beach County, FL
|
51.4
|
46.9--55.9
|
58.0
|
53.8--62.1
|
54.7
|
51.2--58.3
|
|
3.1
|
2.1--4.5
|
13.4
|
10.5--16.9
|
8.3
|
6.6--10.3
|
|
Philadelphia, PA
|
58.9
|
52.5--65.0
|
68.5
|
61.3--74.9
|
63.5
|
57.8--68.8
|
|
6.0
|
4.1--8.7
|
24.0
|
19.7--29.0
|
14.5
|
11.9--17.6
|
|
San Bernardino, CA
|
40.0
|
33.8--46.5
|
57.8
|
51.0--64.2
|
48.8
|
43.3--54.3
|
|
2.7
|
1.6--4.5
|
11.8
|
9.1--15.3
|
7.2
|
5.6--9.3
|
|
San Diego, CA
|
34.2
|
29.9--38.7
|
44.2
|
39.2--49.3
|
39.2
|
35.3--43.2
|
|
2.9
|
1.8--4.8
|
6.8
|
5.1--8.9
|
4.8
|
3.7--6.4
|
|
San Francisco, CA
|
24.8
|
20.9--29.2
|
32.5
|
28.6--36.6
|
28.7
|
25.6--32.0
|
|
2.4
|
1.4--4.0
|
8.7
|
6.7--11.2
|
5.6
|
4.4--7.1
|
|
Seattle, WA
|
---
|
---
|
---
|
---
|
---
|
---
|
|
---
|
---
|
---
|
---
|
---
|
---
|
|
Median
|
45.3
|
58.0
|
53.4
|
|
3.8
|
13.5
|
9.0
|
|
Range
|
24.8--58.9
|
32.5--72.4
|
28.7--63.5
|
|
1.7--6.0
|
6.8--26.0
|
4.8--14.5
|
|
|
Had sexual intercourse with four or more persons during their life
|
|
Currently sexually active
|
|
|
Female
|
Male
|
Total
|
|
Female
|
Male
|
Total
|
|
Category
|
%
|
CI†
|
%
|
CI
|
%
|
CI
|
|
%
|
CI
|
%
|
CI
|
%
|
CI
|
|
Race/Ethnicity
|
|
|
|
|
|
|
|
|
|
|
|
|
|
|
White§
|
10.0
|
8.7--11.6
|
11.0
|
8.6--13.9
|
10.5
|
9.0--12.3
|
|
35.4
|
32.4--38.5
|
28.9
|
24.7--33.4
|
32.0
|
28.8--35.3
|
|
Black§
|
18.0
|
15.6--20.7
|
39.4
|
33.4--45.8
|
28.6
|
25.5--32.0
|
|
45.0
|
40.8--49.2
|
50.3
|
45.1--55.6
|
47.7
|
44.2--51.2
|
|
Hispanic
|
10.4
|
8.6--12.6
|
18.0
|
15.5--20.9
|
14.2
|
12.7--15.9
|
|
34.1
|
31.1--37.2
|
35.0
|
31.4--38.8
|
34.6
|
32.2--37.0
|
|
Grade
|
|
|
|
|
|
|
|
|
|
|
|
|
|
|
9
|
6.3
|
4.9--8.0
|
11.1
|
8.7--14.0
|
8.8
|
7.4--10.5
|
|
21.6
|
18.8--24.7
|
21.2
|
17.8--25.1
|
21.4
|
19.0--24.0
|
|
10
|
7.6
|
6.2--9.4
|
15.3
|
11.9--19.5
|
11.7
|
9.9--13.7
|
|
29.3
|
26.0--33.0
|
28.8
|
24.3--33.8
|
29.1
|
26.1--32.3
|
|
11
|
12.9
|
11.0--15.1
|
17.5
|
14.3--21.2
|
15.2
|
13.2--17.5
|
|
41.5
|
37.3--45.9
|
39.1
|
35.4--43.0
|
40.3
|
36.9--43.9
|
|
12
|
19.1
|
16.5--22.0
|
22.7
|
18.7--27.2
|
20.9
|
18.2--24.0
|
|
53.1
|
50.0--56.2
|
45.1
|
40.0--50.4
|
49.1
|
45.9--52.4
|
|
Total
|
11.2
|
10.1--12.4
|
16.2
|
13.7--19.1
|
13.8
|
12.4--15.4
|
|
35.6
|
33.4--38.0
|
32.6
|
29.4--36.0
|
34.2
|
31.9--36.5
|
|
|
Had sexual intercourse with four or more persons during their life
|
|
Currently sexually active
|
|
|
Female
|
Male
|
Total
|
|
Female
|
Male
|
Total
|
|
Site
|
%
|
CI†
|
%
|
CI
|
%
|
CI
|
|
%
|
CI
|
%
|
CI
|
%
|
CI
|
|
State surveys
|
|
|
|
|
|
|
|
|
|
|
|
|
|
|
Alabama
|
14.4
|
10.7--19.1
|
25.7
|
20.0--32.3
|
19.9
|
15.4--25.4
|
|
42.0
|
37.9--46.1
|
40.9
|
35.6--46.5
|
41.5
|
37.2--46.0
|
|
Alaska
|
10.7
|
8.0--14.3
|
12.1
|
8.7--16.5
|
11.4
|
9.3--13.9
|
|
31.1
|
25.6--37.2
|
29.6
|
25.9--33.6
|
30.4
|
26.5--34.6
|
|
Arizona
|
10.4
|
8.1--13.3
|
17.4
|
14.9--20.2
|
14.1
|
12.3--16.2
|
|
34.4
|
31.2--37.7
|
34.2
|
30.3--38.4
|
34.5
|
31.5--37.7
|
|
Arkansas
|
15.5
|
11.7--20.3
|
20.8
|
16.9--25.4
|
18.0
|
14.8--21.7
|
|
39.9
|
34.1--45.9
|
37.6
|
31.8--43.9
|
38.9
|
34.6--43.3
|
|
Colorado
|
11.0
|
7.5--16.1
|
16.5
|
12.9--20.7
|
13.8
|
10.8--17.4
|
|
25.6
|
19.5--33.0
|
29.1
|
23.9--35.0
|
27.4
|
22.2--33.3
|
|
Connecticut
|
8.4
|
6.3--11.0
|
12.5
|
9.7--16.0
|
10.5
|
8.5--12.8
|
|
30.3
|
26.1--34.7
|
28.9
|
25.6--32.4
|
29.6
|
26.3--33.1
|
|
Delaware
|
18.0
|
14.8--21.7
|
23.9
|
20.5--27.6
|
21.0
|
18.1--24.1
|
|
44.2
|
39.9--48.6
|
41.5
|
37.2--45.9
|
42.9
|
39.2--46.7
|
|
Florida
|
11.4
|
10.1--12.8
|
21.4
|
19.5--23.4
|
16.6
|
15.4--17.8
|
|
37.0
|
34.5--39.5
|
36.8
|
34.1--39.6
|
37.0
|
34.8--39.3
|
|
Georgia
|
---§
|
---
|
---
|
---
|
---
|
---
|
|
---
|
---
|
---
|
---
|
---
|
---
|
|
Hawaii
|
11.3
|
7.7--16.2
|
10.9
|
6.9--16.9
|
11.1
|
7.7--15.6
|
|
33.9
|
27.0--41.5
|
27.2
|
21.3--33.9
|
30.5
|
24.4--37.4
|
|
Idaho
|
---
|
---
|
---
|
---
|
---
|
---
|
|
---
|
---
|
---
|
---
|
---
|
---
|
|
Illinois
|
10.8
|
8.7--13.3
|
18.3
|
14.8--22.4
|
14.5
|
12.3--17.0
|
|
35.4
|
31.3--39.8
|
36.9
|
31.9--42.2
|
36.2
|
32.1--40.6
|
|
Indiana
|
13.7
|
10.2--18.2
|
13.5
|
9.6--18.5
|
13.7
|
10.7--17.5
|
|
41.3
|
36.7--46.1
|
31.9
|
26.1--38.3
|
36.7
|
32.8--40.7
|
|
Kansas
|
11.8
|
9.1--15.1
|
16.4
|
12.9--20.7
|
14.2
|
11.3--17.6
|
|
35.2
|
30.3--40.4
|
33.3
|
28.0--39.0
|
34.2
|
30.0--38.8
|
|
Kentucky
|
10.7
|
8.1--14.0
|
14.7
|
11.6--18.5
|
12.7
|
10.6--15.2
|
|
36.1
|
29.9--42.7
|
31.2
|
26.3--36.6
|
33.6
|
29.8--37.5
|
|
Louisiana
|
---
|
---
|
---
|
---
|
---
|
---
|
|
---
|
---
|
---
|
---
|
---
|
---
|
|
Maine
|
10.7
|
9.6--12.0
|
13.1
|
11.8--14.4
|
11.9
|
11.0--12.9
|
|
37.1
|
35.2--39.0
|
33.3
|
31.4--35.3
|
35.3
|
33.8--36.8
|
|
Maryland
|
---
|
---
|
---
|
---
|
---
|
---
|
|
---
|
---
|
---
|
---
|
---
|
---
|
|
Massachusetts
|
10.6
|
8.6--12.9
|
15.2
|
12.7--18.2
|
12.9
|
10.9--15.1
|
|
36.0
|
32.0--40.2
|
33.1
|
29.6--36.7
|
34.6
|
31.6--37.8
|
|
Michigan
|
11.5
|
9.1--14.4
|
15.7
|
12.0--20.3
|
13.6
|
10.9--16.7
|
|
35.6
|
30.6--40.8
|
32.6
|
28.6--36.9
|
34.1
|
30.2--38.3
|
|
Mississippi
|
17.6
|
14.1--21.7
|
30.1
|
24.4--36.5
|
23.7
|
19.4--28.6
|
|
44.0
|
37.8--50.5
|
45.9
|
40.4--51.5
|
44.9
|
39.3--50.7
|
|
Missouri
|
13.6
|
10.6--17.3
|
18.3
|
12.6--25.9
|
16.0
|
11.7--21.5
|
|
36.3
|
29.9--43.2
|
34.9
|
28.8--41.4
|
35.5
|
29.9--41.6
|
|
Montana
|
14.7
|
12.0--17.9
|
17.3
|
12.8--23.0
|
16.0
|
13.1--19.4
|
|
33.6
|
29.7--37.8
|
30.8
|
25.8--36.2
|
32.2
|
28.8--35.8
|
|
Nevada
|
10.9
|
8.7--13.5
|
20.3
|
16.6--24.7
|
15.7
|
13.1--18.7
|
|
32.8
|
28.7--37.3
|
32.5
|
27.5--37.9
|
32.7
|
28.9--36.8
|
|
New Hampshire
|
10.9
|
8.3--14.1
|
11.6
|
9.0--14.9
|
11.4
|
9.3--14.0
|
|
39.5
|
34.9--44.2
|
32.9
|
28.9--37.2
|
36.3
|
32.4--40.3
|
|
New Jersey
|
8.8
|
6.7--11.4
|
16.3
|
12.4--21.2
|
12.5
|
9.8--15.9
|
|
33.7
|
28.7--39.2
|
33.5
|
28.6--38.9
|
33.6
|
29.5--38.0
|
|
New Mexico
|
12.4
|
10.2--14.9
|
17.8
|
14.9--21.2
|
15.1
|
12.7--17.8
|
|
33.5
|
29.8--37.5
|
31.8
|
29.1--34.5
|
32.6
|
29.8--35.7
|
|
New York
|
8.4
|
6.7--10.4
|
18.4
|
15.2--22.0
|
13.4
|
11.5--15.5
|
|
29.7
|
26.1--33.5
|
33.2
|
29.8--36.7
|
31.5
|
28.7--34.5
|
|
North Carolina
|
12.2
|
10.2--14.6
|
19.2
|
16.0--22.9
|
15.7
|
13.4--18.2
|
|
35.7
|
31.0--40.7
|
37.5
|
32.5--42.8
|
36.6
|
32.1--41.4
|
|
North Dakota
|
11.6
|
9.1--14.6
|
11.7
|
8.8--15.4
|
11.7
|
9.6--14.2
|
|
37.2
|
32.8--41.9
|
29.3
|
24.3--34.9
|
33.3
|
29.6--37.1
|
|
Oklahoma
|
15.2
|
11.3--20.2
|
20.1
|
15.4--25.9
|
17.6
|
13.9--22.1
|
|
40.3
|
33.3--47.8
|
39.5
|
34.2--45.1
|
39.8
|
34.3--45.5
|
|
Pennsylvania
|
13.2
|
10.0--17.1
|
17.7
|
13.5--22.8
|
15.4
|
12.2--19.3
|
|
39.6
|
33.6--45.8
|
34.3
|
29.1--39.9
|
36.9
|
31.8--42.2
|
|
Rhode Island
|
8.6
|
6.5--11.3
|
13.7
|
11.2--16.6
|
11.2
|
9.5--13.2
|
|
32.6
|
27.4--38.2
|
32.0
|
28.9--35.3
|
32.3
|
28.7--36.1
|
|
South Carolina
|
14.8
|
10.7--20.2
|
24.9
|
19.9--30.7
|
19.7
|
15.8--24.2
|
|
37.0
|
30.9--43.5
|
40.4
|
35.3--45.6
|
38.6
|
33.8--43.5
|
|
South Dakota
|
14.4
|
10.1--20.2
|
16.0
|
13.2--19.3
|
15.2
|
12.1--18.9
|
|
38.9
|
32.0--46.3
|
33.7
|
30.6--37.1
|
36.3
|
31.7--41.1
|
|
Tennessee
|
13.3
|
10.6--16.4
|
19.8
|
16.3--23.8
|
16.6
|
13.9--19.7
|
|
38.4
|
34.3--42.7
|
39.1
|
34.0--44.5
|
38.8
|
35.2--42.5
|
|
Texas
|
12.7
|
10.7--15.0
|
20.3
|
18.0--22.9
|
16.5
|
14.8--18.4
|
|
38.5
|
35.6--41.6
|
36.9
|
33.4--40.5
|
37.7
|
35.1--40.3
|
|
Utah
|
---
|
---
|
---
|
---
|
---
|
---
|
|
---
|
---
|
---
|
---
|
---
|
---
|
|
Vermont
|
10.8
|
9.5--12.1
|
12.0
|
10.7--13.4
|
11.4
|
10.3--12.6
|
|
---
|
---
|
---
|
---
|
---
|
---
|
|
West Virginia
|
14.6
|
11.0--19.1
|
16.4
|
12.7--20.8
|
15.5
|
12.7--18.8
|
|
42.4
|
37.0--48.1
|
38.2
|
33.1--43.5
|
40.3
|
35.6--45.1
|
|
Wisconsin
|
8.7
|
6.6--11.4
|
11.0
|
7.1--16.6
|
9.9
|
7.1--13.7
|
|
31.7
|
26.8--36.9
|
26.9
|
22.1--32.3
|
29.3
|
24.8--34.3
|
|
Wyoming
|
16.8
|
14.4--19.6
|
19.0
|
16.7--21.5
|
17.9
|
16.1--19.9
|
|
40.4
|
36.9--44.1
|
35.0
|
32.1--38.1
|
37.8
|
35.2--40.3
|
|
Median
|
11.6
|
17.3
|
14.5
|
|
36.2
|
33.4
|
35.4
|
|
Range
|
8.4--18.0
|
10.9--30.1
|
9.9--23.7
|
|
25.6--44.2
|
26.9--45.9
|
27.4--44.9
|
|
Local surveys
|
|
|
|
|
|
|
|
|
|
|
|
|
|
|
Boston, MA
|
11.7
|
8.6--15.6
|
30.0
|
25.0--35.5
|
20.6
|
17.2--24.4
|
|
32.7
|
27.9--37.9
|
43.6
|
38.7--48.6
|
38.0
|
33.9--42.3
|
|
Broward County, FL
|
14.5
|
11.5--18.0
|
25.5
|
21.6--29.8
|
19.8
|
17.0--22.9
|
|
37.1
|
32.0--42.6
|
40.2
|
36.1--44.5
|
38.4
|
34.5--42.5
|
|
Charlotte-Mecklenburg, NC
|
13.2
|
10.3--16.8
|
20.2
|
16.7--24.2
|
16.6
|
14.1--19.5
|
|
34.5
|
29.4--39.9
|
35.5
|
31.3--39.9
|
35.1
|
31.5--38.8
|
|
Chicago, IL
|
9.6
|
7.4--12.3
|
29.0
|
21.0--38.6
|
19.5
|
15.2--24.6
|
|
35.5
|
29.6--41.9
|
43.0
|
34.3--52.1
|
39.3
|
33.0--46.0
|
|
Clark County, NV
|
9.9
|
7.4--13.2
|
19.3
|
14.7--25.1
|
14.8
|
11.7--18.6
|
|
31.9
|
27.5--36.6
|
32.0
|
26.6--37.9
|
32.0
|
28.1--36.1
|
|
Dallas, TX
|
10.4
|
7.2--14.8
|
24.2
|
19.5--29.5
|
16.9
|
13.6--20.9
|
|
36.7
|
30.2--43.8
|
42.8
|
37.4--48.5
|
39.6
|
34.5--44.9
|
|
Detroit, MI
|
14.1
|
11.5--17.3
|
34.5
|
28.2--41.5
|
23.7
|
20.0--27.9
|
|
39.7
|
33.2--46.5
|
53.5
|
45.2--61.6
|
46.4
|
40.5--52.3
|
|
Duval County, FL
|
13.1
|
10.6--16.1
|
22.7
|
19.7--26.1
|
17.6
|
15.4--20.1
|
|
37.8
|
33.9--41.9
|
37.3
|
33.3--41.4
|
37.7
|
34.6--40.8
|
|
Los Angeles, CA
|
4.1
|
2.6--6.3
|
14.0
|
9.6--20.0
|
8.9
|
6.5--12.0
|
|
23.2
|
17.8--29.7
|
28.1
|
19.8--38.4
|
25.6
|
19.0--33.6
|
|
Memphis, TN
|
13.2
|
10.5--16.4
|
34.0
|
29.9--38.4
|
23.0
|
20.2--26.0
|
|
39.0
|
34.0--44.3
|
49.4
|
44.5--54.3
|
44.0
|
40.1--48.0
|
|
Miami-Dade County, FL
|
10.1
|
8.3--12.2
|
25.3
|
22.2--28.6
|
17.7
|
15.6--20.0
|
|
36.1
|
31.8--40.6
|
40.2
|
36.4--44.1
|
38.1
|
34.9--41.5
|
|
Milwaukee, WI
|
16.4
|
13.3--20.1
|
32.8
|
28.5--37.3
|
24.2
|
21.2--27.4
|
|
43.4
|
38.9--48.1
|
44.5
|
39.7--49.4
|
44.0
|
40.4--47.6
|
|
New York City, NY
|
8.8
|
7.5--10.3
|
21.5
|
17.8--25.7
|
14.5
|
12.4--17.0
|
|
25.2
|
21.8--28.9
|
30.1
|
25.8--34.8
|
27.4
|
23.8--31.3
|
|
Orange County, FL
|
11.9
|
8.4--16.6
|
23.3
|
18.4--29.1
|
17.6
|
14.0--21.8
|
|
32.2
|
27.7--37.0
|
40.4
|
35.0--46.1
|
36.2
|
32.1--40.5
|
|
Palm Beach County, FL
|
13.5
|
11.0--16.4
|
22.7
|
19.5--26.3
|
18.2
|
16.0--20.5
|
|
37.9
|
34.0--41.9
|
38.4
|
34.8--42.2
|
38.3
|
35.5--41.1
|
|
Philadelphia, PA
|
16.8
|
12.3--22.5
|
35.1
|
29.4--41.2
|
25.5
|
21.4--30.2
|
|
45.2
|
38.9--51.7
|
47.7
|
40.4--55.0
|
46.5
|
40.8--52.2
|
|
San Bernardino, CA
|
6.7
|
4.6--9.6
|
22.3
|
18.1--27.2
|
14.4
|
11.8--17.4
|
|
30.4
|
25.1--36.4
|
40.9
|
35.2--46.8
|
35.5
|
31.0--40.3
|
|
San Diego, CA
|
7.4
|
5.6--9.6
|
14.9
|
12.1--18.2
|
11.2
|
9.4--13.2
|
|
25.0
|
20.8--29.7
|
30.3
|
26.3--34.6
|
27.7
|
24.1--31.6
|
|
San Francisco, CA
|
5.5
|
3.8--7.8
|
14.1
|
11.8--16.8
|
9.9
|
8.1--11.9
|
|
19.1
|
15.7--22.9
|
21.8
|
18.2--25.9
|
20.5
|
17.8--23.4
|
|
Seattle, WA
|
---
|
---
|
---
|
---
|
---
|
---
|
|
---
|
---
|
---
|
---
|
---
|
---
|
|
Median
|
11.7
|
23.3
|
17.6
|
|
35.5
|
40.2
|
38.0
|
|
Range
|
4.1--16.8
|
14.0--35.1
|
8.9--25.5
|
|
19.1--45.2
|
21.8--53.5
|
20.5--46.5
|
|
|
Condom use
|
|
Birth control pill use
|
|
|
Female
|
Male
|
Total
|
|
Female
|
Male
|
Total
|
|
Category
|
%
|
CI§
|
%
|
CI
|
%
|
CI
|
|
%
|
CI
|
%
|
CI
|
%
|
CI
|
|
Race/Ethnicity
|
|
|
|
|
|
|
|
|
|
|
|
|
|
|
White¶
|
56.1
|
52.2--60.0
|
71.0
|
67.5--74.3
|
63.3
|
60.4--66.1
|
|
31.4
|
27.2--36.0
|
21.6
|
17.7--26.0
|
26.8
|
23.7--30.1
|
|
Black¶
|
51.8
|
47.5--56.0
|
72.5
|
65.5--78.5
|
62.4
|
57.9--66.8
|
|
9.8
|
7.3--12.9
|
6.6
|
4.6--9.5
|
8.1
|
6.7--9.8
|
|
Hispanic
|
48.0
|
43.7--52.4
|
61.7
|
57.7--65.6
|
54.9
|
51.7--58.0
|
|
9.9
|
7.0--13.8
|
11.5
|
8.8--15.0
|
10.8
|
8.5--13.7
|
|
Grade
|
|
|
|
|
|
|
|
|
|
|
|
|
|
|
9
|
57.7
|
51.1--64.0
|
69.9
|
63.7--75.5
|
64.0
|
60.3--67.6
|
|
9.7
|
6.6--14.2
|
10.7
|
7.8--14.6
|
10.2
|
8.0--13.0
|
|
10
|
63.5
|
58.3--68.3
|
71.9
|
66.5--76.7
|
67.8
|
64.0--71.4
|
|
15.6
|
12.1--19.8
|
14.0
|
10.3--18.7
|
14.7
|
12.1--17.8
|
|
11
|
54.0
|
50.1--57.9
|
68.9
|
64.2--73.2
|
61.4
|
58.7--64.0
|
|
22.5
|
19.3--26.1
|
18.9
|
14.9--23.7
|
20.7
|
18.0--23.6
|
|
12
|
46.3
|
41.1--51.5
|
65.0
|
61.0--68.9
|
55.0
|
51.5--58.5
|
|
34.4
|
27.6--41.8
|
19.6
|
15.3--24.7
|
27.6
|
23.2--32.6
|
|
Total
|
53.9
|
51.4--56.4
|
68.6
|
66.0--71.2
|
61.1
|
59.0--63.1
|
|
23.0
|
19.8--26.6
|
16.5
|
13.6--19.9
|
19.8
|
17.4--22.5
|
|
|
Condom use
|
|
Birth control pill use
|
|
|
Female
|
Male
|
Total
|
|
Female
|
Male
|
Total
|
|
Site
|
%
|
CI§
|
%
|
CI
|
%
|
CI
|
|
%
|
CI
|
%
|
CI
|
%
|
CI
|
|
State surveys
|
|
|
|
|
|
|
|
|
|
|
|
|
|
|
Alabama
|
54.7
|
49.2--60.2
|
62.5
|
54.6--69.8
|
58.5
|
53.4--63.5
|
|
24.7
|
20.5--29.4
|
16.5
|
11.8--22.7
|
20.7
|
17.2--24.7
|
|
Alaska
|
55.9
|
48.7--62.9
|
68.9
|
59.9--76.6
|
62.2
|
57.5--66.7
|
|
28.9
|
22.4--36.4
|
23.3
|
17.1--30.9
|
26.0
|
21.3--31.3
|
|
Arizona
|
49.5
|
45.4--53.6
|
70.6
|
62.4--77.7
|
59.7
|
54.9--64.4
|
|
16.1
|
9.5--26.0
|
17.6
|
12.3--24.4
|
16.7
|
12.4--22.0
|
|
Arkansas
|
47.3
|
37.9--57.0
|
72.4
|
63.2--80.0
|
58.7
|
51.5--65.5
|
|
22.7
|
16.7--30.1
|
15.5
|
10.2--23.0
|
19.4
|
14.7--25.2
|
|
Colorado
|
59.0
|
48.5--68.8
|
66.6
|
59.7--72.8
|
63.2
|
56.7--69.2
|
|
25.6
|
17.2--36.3
|
19.4
|
12.8--28.2
|
22.3
|
15.4--31.1
|
|
Connecticut
|
56.1
|
50.2--61.9
|
62.9
|
55.7--69.6
|
59.4
|
54.4--64.1
|
|
25.6
|
19.6--32.7
|
22.7
|
16.7--30.1
|
24.1
|
19.2--29.9
|
|
Delaware
|
55.2
|
49.0--61.1
|
69.5
|
64.7--74.0
|
62.0
|
58.1--65.8
|
|
21.5
|
17.0--26.8
|
17.9
|
14.4--21.9
|
19.6
|
16.6--23.1
|
|
Florida
|
60.1
|
56.7--63.4
|
70.0
|
67.2--72.6
|
65.1
|
63.0--67.1
|
|
19.9
|
16.3--23.9
|
13.0
|
10.3--16.3
|
16.4
|
13.9--19.3
|
|
Georgia
|
---¶
|
---
|
---
|
---
|
---
|
---
|
|
---
|
---
|
---
|
---
|
---
|
---
|
|
Hawaii
|
34.2
|
26.0--43.5
|
65.4
|
54.8--74.6
|
47.7
|
39.8--55.8
|
|
15.5
|
11.5--20.7
|
12.9
|
7.2--22.2
|
14.5
|
11.3--18.3
|
|
Idaho
|
---
|
---
|
---
|
---
|
---
|
---
|
|
---
|
---
|
---
|
---
|
---
|
---
|
|
Illinois
|
58.1
|
52.6--63.4
|
68.1
|
62.7--73.1
|
63.2
|
58.8--67.4
|
|
22.1
|
17.7--27.2
|
19.9
|
15.4--25.3
|
21.0
|
18.6--23.5
|
|
Indiana
|
51.6
|
43.8--59.3
|
65.9
|
58.2--72.7
|
58.0
|
52.3--63.5
|
|
26.7
|
21.6--32.5
|
18.9
|
12.4--27.7
|
23.2
|
18.6--28.5
|
|
Kansas
|
54.2
|
48.3--60.0
|
66.0
|
60.8--71.0
|
60.1
|
55.4--64.6
|
|
21.6
|
15.7--28.9
|
20.1
|
14.9--26.6
|
20.8
|
16.3--26.3
|
|
Kentucky
|
54.5
|
46.3--62.4
|
66.3
|
59.0--72.9
|
59.9
|
53.1--66.4
|
|
26.9
|
20.9--33.8
|
19.4
|
14.8--25.1
|
23.4
|
19.6--27.6
|
|
Louisiana
|
---
|
---
|
---
|
---
|
---
|
---
|
|
---
|
---
|
---
|
---
|
---
|
---
|
|
Maine
|
57.4
|
54.7--60.0
|
64.4
|
61.3--67.4
|
60.5
|
58.4--62.6
|
|
38.8
|
35.9--41.7
|
29.1
|
26.3--32.1
|
34.2
|
32.1--36.3
|
|
Maryland
|
---
|
---
|
---
|
---
|
---
|
---
|
|
---
|
---
|
---
|
---
|
---
|
---
|
|
Massachusetts
|
50.6
|
46.3--54.8
|
65.7
|
60.8--70.3
|
57.5
|
54.1--60.8
|
|
---
|
---
|
---
|
---
|
---
|
---
|
|
Michigan
|
55.2
|
50.8--59.6
|
68.2
|
61.8--74.0
|
61.4
|
56.7--65.9
|
|
20.6
|
16.2--25.9
|
22.6
|
16.8--29.5
|
21.4
|
17.1--26.5
|
|
Mississippi
|
61.3
|
55.2--67.1
|
70.3
|
63.5--76.4
|
65.7
|
60.5--70.6
|
|
15.9
|
10.6--23.1
|
12.3
|
8.0--18.4
|
14.3
|
10.7--19.0
|
|
Missouri
|
51.1
|
43.7--58.4
|
68.7
|
60.6--75.8
|
59.8
|
53.9--65.5
|
|
27.0
|
19.7--35.8
|
21.7
|
16.6--27.8
|
24.3
|
19.3--30.2
|
|
Montana
|
58.4
|
50.0--66.3
|
77.3
|
71.3--82.3
|
67.5
|
62.5--72.2
|
|
34.4
|
28.4--41.0
|
19.8
|
14.0--27.2
|
27.4
|
22.4--32.9
|
|
Nevada
|
57.3
|
51.2--63.3
|
68.2
|
62.5--73.4
|
62.9
|
59.0--66.7
|
|
20.5
|
16.0--25.9
|
13.5
|
9.5--18.8
|
16.9
|
13.9--20.4
|
|
New Hampshire
|
53.7
|
45.2--62.1
|
60.7
|
53.0--68.0
|
56.8
|
51.6--61.9
|
|
40.8
|
33.6--48.4
|
24.4
|
18.7--31.2
|
33.0
|
27.6--38.8
|
|
New Jersey
|
57.1
|
49.4--64.5
|
74.0
|
67.3--79.8
|
65.5
|
60.5--70.2
|
|
22.9
|
16.7--30.7
|
16.0
|
10.7--23.2
|
19.5
|
15.2--24.6
|
|
New Mexico
|
50.4
|
46.5--54.3
|
65.1
|
61.2--68.9
|
57.5
|
54.8--60.0
|
|
15.2
|
12.2--18.7
|
11.0
|
7.9--15.3
|
13.2
|
10.4--16.6
|
|
New York
|
68.3
|
64.3--72.0
|
67.5
|
63.2--71.6
|
67.6
|
64.1--71.0
|
|
19.1
|
14.3--25.1
|
15.2
|
11.1--20.6
|
17.0
|
13.1--21.6
|
|
North Carolina
|
56.0
|
52.4--59.6
|
65.5
|
62.4--68.5
|
60.7
|
58.3--63.1
|
|
---
|
---
|
---
|
---
|
---
|
---
|
|
North Dakota
|
---
|
---
|
---
|
---
|
---
|
---
|
|
24.7
|
20.1--30.0
|
15.1
|
10.6--21.1
|
20.4
|
16.8--24.6
|
|
Oklahoma
|
49.5
|
42.3--56.8
|
64.1
|
55.1--72.1
|
56.7
|
50.0--63.2
|
|
22.1
|
15.8--29.9
|
23.4
|
16.7--31.8
|
22.7
|
18.0--28.2
|
|
Pennsylvania
|
59.5
|
54.2--64.5
|
70.6
|
64.7--75.8
|
64.8
|
60.3--69.1
|
|
25.4
|
20.1--31.5
|
20.5
|
15.6--26.5
|
23.0
|
19.4--27.1
|
|
Rhode Island
|
54.5
|
48.9--60.1
|
68.2
|
60.7--74.9
|
61.2
|
56.6--65.7
|
|
25.8
|
16.9--37.3
|
17.1
|
13.3--21.8
|
21.6
|
16.2--28.2
|
|
South Carolina
|
53.8
|
45.7--61.7
|
66.0
|
58.3--72.9
|
60.0
|
53.2--66.3
|
|
20.5
|
14.4--28.4
|
18.9
|
11.9--28.8
|
19.7
|
14.1--26.8
|
|
South Dakota
|
55.4
|
47.6--63.0
|
68.8
|
61.0--75.6
|
61.6
|
55.2--67.6
|
|
25.3
|
17.8--34.7
|
19.4
|
12.5--28.8
|
22.6
|
17.4--28.8
|
|
Tennessee
|
51.2
|
45.5--56.8
|
67.8
|
61.8--73.3
|
59.5
|
54.9--63.9
|
|
20.7
|
16.8--25.3
|
12.3
|
8.6--17.4
|
16.6
|
13.8--20.0
|
|
Texas
|
53.0
|
47.8--58.2
|
62.6
|
58.8--66.3
|
57.7
|
54.2--61.1
|
|
17.4
|
13.9--21.6
|
10.1
|
7.4--13.7
|
13.9
|
11.3--17.0
|
|
Utah
|
---
|
---
|
---
|
---
|
---
|
---
|
|
---
|
---
|
---
|
---
|
---
|
---
|
|
Vermont
|
---
|
---
|
---
|
---
|
---
|
---
|
|
---
|
---
|
---
|
---
|
---
|
---
|
|
West Virginia
|
48.4
|
41.6--55.1
|
61.4
|
53.7--68.7
|
54.4
|
49.0--59.7
|
|
26.3
|
21.1--32.1
|
19.6
|
12.5--29.2
|
23.1
|
17.7--29.6
|
|
Wisconsin
|
59.3
|
54.5--63.9
|
69.0
|
63.0--74.4
|
63.7
|
59.8--67.4
|
|
32.8
|
26.7--39.6
|
20.3
|
15.5--26.1
|
27.2
|
22.8--32.0
|
|
Wyoming
|
57.2
|
52.6--61.7
|
67.3
|
62.6--71.8
|
61.7
|
58.2--65.1
|
|
30.9
|
26.5--35.8
|
15.6
|
12.3--19.5
|
23.7
|
20.5--27.3
|
|
Median
|
55.2
|
67.5
|
60.5
|
|
23.8
|
18.9
|
21.2
|
|
Range
|
34.2--68.3
|
60.7--77.3
|
47.7--67.6
|
|
15.2--40.8
|
10.1--29.1
|
13.2--34.2
|
|
Local surveys
|
|
|
|
|
|
|
|
|
|
|
|
|
|
|
Boston, MA
|
56.7
|
48.4--64.7
|
77.2
|
70.2--83.0
|
68.1
|
63.2--72.7
|
|
13.2
|
8.7--19.5
|
13.4
|
9.0--19.6
|
13.2
|
9.7--17.8
|
|
Broward County, FL
|
67.0
|
61.4--72.2
|
73.8
|
67.4--79.4
|
70.6
|
66.4--74.4
|
|
13.1
|
9.1--18.4
|
6.9
|
4.1--11.4
|
9.9
|
7.3--13.3
|
|
Charlotte-Mecklenburg, NC
|
57.0
|
50.6--63.2
|
74.1
|
67.4--79.8
|
65.5
|
60.6--70.2
|
|
15.6
|
11.1--21.3
|
10.4
|
6.8--15.5
|
13.0
|
9.9--16.9
|
|
Chicago, IL
|
57.6
|
47.2--67.4
|
71.0
|
62.1--78.6
|
65.1
|
57.7--71.9
|
|
11.2
|
7.1--17.2
|
11.0
|
7.0--16.9
|
11.0
|
7.8--15.2
|
|
Clark County, NV
|
59.6
|
52.4--66.4
|
66.1
|
58.7--72.9
|
63.0
|
58.2--67.6
|
|
22.3
|
16.0--30.1
|
12.5
|
7.5--20.0
|
17.2
|
13.1--22.2
|
|
Dallas, TX
|
51.4
|
43.2--59.6
|
68.6
|
60.0--76.2
|
60.3
|
55.1--65.3
|
|
8.5
|
4.4--15.8
|
3.8
|
2.0--7.0
|
6.1
|
3.6--10.0
|
|
Detroit, MI
|
56.9
|
49.8--63.7
|
78.4
|
69.9--85.1
|
68.8
|
61.9--74.9
|
|
10.0
|
7.0--14.2
|
5.1
|
3.2--7.9
|
7.3
|
5.3--10.1
|
|
Duval County, FL
|
51.9
|
46.5--57.2
|
65.7
|
58.3--72.4
|
58.3
|
54.0--62.5
|
|
20.6
|
16.3--25.6
|
10.2
|
6.7--15.0
|
15.7
|
13.1--18.7
|
|
Los Angeles, CA
|
53.8
|
46.4--61.1
|
66.6
|
58.7--73.7
|
60.5
|
54.9--65.9
|
|
8.2
|
4.4--14.8
|
7.5
|
4.8--11.5
|
7.8
|
5.3--11.4
|
|
Memphis, TN
|
67.8
|
62.0--73.0
|
76.6
|
70.3--81.8
|
72.4
|
68.0--76.4
|
|
12.3
|
8.3--17.9
|
6.1
|
3.5--10.3
|
9.2
|
6.8--12.4
|
|
Miami-Dade County, FL
|
55.8
|
49.1--62.3
|
71.5
|
65.5--76.9
|
63.9
|
59.3--68.3
|
|
13.2
|
9.4--18.1
|
4.9
|
2.8--8.3
|
8.9
|
6.3--12.4
|
|
Milwaukee, WI
|
59.6
|
53.6--65.3
|
73.5
|
68.0--78.3
|
66.2
|
62.0--70.2
|
|
11.2
|
7.9--15.6
|
10.8
|
7.5--15.2
|
11.0
|
8.4--14.2
|
|
New York City, NY
|
65.1
|
61.2--68.9
|
77.3
|
73.1--81.0
|
71.1
|
68.2--73.9
|
|
6.8
|
5.4--8.6
|
6.7
|
5.3--8.5
|
6.8
|
5.7--8.0
|
|
Orange County, FL
|
60.8
|
53.3--67.8
|
71.5
|
63.4--78.4
|
66.8
|
61.7--71.5
|
|
11.6
|
7.3--17.9
|
7.9
|
4.9--12.6
|
9.6
|
7.0--13.0
|
|
Palm Beach County, FL
|
64.1
|
58.8--69.1
|
72.8
|
67.0--78.0
|
68.2
|
64.2--72.0
|
|
18.1
|
14.2--22.9
|
14.1
|
10.5--18.6
|
16.0
|
13.2--19.3
|
|
Philadelphia, PA
|
52.6
|
45.1--60.1
|
73.9
|
65.6--80.8
|
62.8
|
56.2--69.1
|
|
11.0
|
7.6--15.6
|
8.5
|
5.4--13.1
|
9.7
|
6.9--13.6
|
|
San Bernardino, CA
|
55.0
|
48.7--61.2
|
63.3
|
56.4--69.7
|
59.7
|
54.2--65.0
|
|
6.2
|
3.2--11.6
|
8.9
|
5.2--14.9
|
7.7
|
4.8--12.2
|
|
San Diego, CA
|
62.2
|
55.1--68.9
|
68.6
|
60.8--75.4
|
65.5
|
60.5--70.1
|
|
19.9
|
14.8--26.2
|
16.0
|
11.2--22.3
|
17.7
|
14.3--21.8
|
|
San Francisco, CA
|
54.2
|
46.7--61.6
|
58.5
|
51.5--65.3
|
56.5
|
51.5--61.5
|
|
11.6
|
7.5--17.5
|
17.0
|
12.0--23.6
|
14.4
|
10.9--19.0
|
|
Seattle, WA
|
---
|
---
|
---
|
---
|
---
|
---
|
|
---
|
---
|
---
|
---
|
---
|
---
|
|
Median
|
57.0
|
71.5
|
65.5
|
|
11.6
|
8.9
|
9.9
|
|
Range
|
51.4--67.8
|
58.5--78.4
|
56.5--72.4
|
|
6.2--22.3
|
3.8--17.0
|
6.1--17.7
|
|
|
Depo-Provera use
|
|
Birth control pill use or Depo-Provera use
|
|
|
Female
|
Male
|
Total
|
|
Female
|
Male
|
Total
|
|
Category
|
%
|
CI§
|
%
|
CI
|
%
|
CI
|
|
%
|
CI
|
%
|
CI
|
%
|
CI
|
|
Race/Ethnicity
|
|
|
|
|
|
|
|
|
|
|
|
|
|
|
White¶
|
3.1
|
2.1--4.5
|
1.9
|
0.9--3.8
|
2.5
|
1.8--3.4
|
|
34.5
|
30.2--39.2
|
23.4
|
19.8--27.5
|
29.3
|
26.0--32.8
|
|
Black¶
|
8.5
|
6.0--11.9
|
1.2
|
0.7--2.2
|
4.8
|
3.3--6.9
|
|
18.2
|
14.9--22.2
|
7.9
|
5.5--11.1
|
12.9
|
10.4--16.0
|
|
Hispanic
|
4.9
|
3.2--7.3
|
1.6
|
0.8--3.1
|
3.2
|
2.3--4.5
|
|
14.8
|
11.4--19.0
|
13.1
|
10.3--16.6
|
14.0
|
11.4--17.1
|
|
Grade
|
|
|
|
|
|
|
|
|
|
|
|
|
|
|
9
|
3.3
|
2.1--5.1
|
1.1
|
0.4--3.1
|
2.2
|
1.4--3.4
|
|
13.0
|
9.4--17.8
|
11.8
|
8.6--16.1
|
12.4
|
9.9--15.4
|
|
10
|
4.9
|
3.0--8.0
|
0.6
|
0.2--1.7
|
2.8
|
1.8--4.2
|
|
20.5
|
16.6--25.0
|
14.6
|
10.9--19.4
|
17.5
|
14.7--20.7
|
|
11
|
4.3
|
3.0--6.1
|
1.0
|
0.5--2.3
|
2.7
|
1.9--3.7
|
|
26.8
|
23.6--30.2
|
20.0
|
15.9--24.7
|
23.4
|
20.7--26.3
|
|
12
|
4.6
|
3.5--6.2
|
3.5
|
1.9--6.6
|
4.1
|
3.2--5.4
|
|
39.0
|
32.2--46.3
|
23.1
|
19.1--27.6
|
31.8
|
26.9--37.0
|
|
Total
|
4.4
|
3.5--5.5
|
1.7
|
1.1--2.7
|
3.1
|
2.6--3.7
|
|
27.4
|
24.0--31.0
|
18.3
|
15.5--21.4
|
22.9
|
20.3--25.7
|
|
|
Depo-Provera use
|
|
Birth control pill use or Depo-Provera use
|
|
|
Female
|
Male
|
Total
|
|
Female
|
Male
|
Total
|
|
Site
|
%
|
CI§
|
%
|
CI
|
%
|
CI
|
|
%
|
CI
|
%
|
CI
|
%
|
CI
|
|
State surveys
|
|
|
|
|
|
|
|
|
|
|
|
|
|
|
Alabama
|
7.2
|
4.4--11.6
|
3.9
|
2.1--7.2
|
5.7
|
4.1--7.7
|
|
31.9
|
27.5--36.5
|
20.4
|
14.8--27.5
|
26.4
|
22.8--30.4
|
|
Alaska
|
6.3
|
3.3--11.5
|
3.0
|
1.2--7.3
|
4.8
|
2.8--8.1
|
|
35.2
|
29.0--41.8
|
26.3
|
19.9--33.7
|
30.8
|
26.3--35.8
|
|
Arizona
|
3.4
|
1.8--6.4
|
1.5
|
0.9--2.5
|
2.6
|
1.6--4.2
|
|
19.5
|
12.6--29.0
|
19.0
|
13.9--25.5
|
19.3
|
14.9--24.6
|
|
Arkansas
|
7.2
|
4.5--11.4
|
2.2
|
1.1--4.4
|
4.9
|
3.3--7.4
|
|
29.9
|
23.3--37.5
|
17.8
|
12.0--25.4
|
24.4
|
19.2--30.4
|
|
Colorado
|
5.8
|
2.6--12.5
|
2.6
|
1.0--6.7
|
4.1
|
2.1--8.0
|
|
31.4
|
22.3--42.2
|
22.0
|
15.9--29.5
|
26.4
|
19.8--34.1
|
|
Connecticut
|
4.2
|
2.3--7.5
|
1.6
|
0.6--4.3
|
2.9
|
1.6--5.1
|
|
29.7
|
23.9--36.3
|
24.3
|
18.4--31.4
|
27.0
|
22.3--32.4
|
|
Delaware
|
3.9
|
2.5--5.9
|
2.0
|
0.9--4.3
|
2.9
|
1.9--4.5
|
|
25.4
|
20.6--30.8
|
19.9
|
16.2--24.1
|
22.6
|
19.3--26.2
|
|
Florida
|
2.0
|
1.1--3.7
|
0.9
|
0.5--1.4
|
1.4
|
0.9--2.2
|
|
21.9
|
18.3--25.9
|
13.9
|
11.2--17.1
|
17.8
|
15.3--20.7
|
|
Georgia
|
---¶
|
---
|
---
|
---
|
---
|
---
|
|
---
|
---
|
---
|
---
|
---
|
---
|
|
Hawaii
|
4.3
|
2.0--8.8
|
1.0
|
0.2--4.5
|
2.8
|
1.3--6.0
|
|
19.8
|
15.9--24.5
|
13.9
|
7.5--24.5
|
17.3
|
13.6--21.7
|
|
Idaho
|
---
|
---
|
---
|
---
|
---
|
---
|
|
---
|
---
|
---
|
---
|
---
|
---
|
|
Illinois
|
5.9
|
3.6--9.5
|
2.0
|
0.9--4.6
|
3.9
|
2.4--6.5
|
|
28.0
|
22.1--34.7
|
21.9
|
16.5--28.5
|
24.9
|
21.2--29.0
|
|
Indiana
|
8.9
|
4.3--17.6
|
2.1
|
0.6--7.4
|
5.9
|
3.0--11.3
|
|
35.6
|
27.8--44.3
|
21.0
|
14.2--29.9
|
29.2
|
23.0--36.2
|
|
Kansas
|
7.5
|
4.2--12.9
|
2.7
|
1.2--6.0
|
5.1
|
3.2--8.0
|
|
29.1
|
22.7--36.4
|
22.8
|
17.4--29.3
|
26.0
|
22.1--30.3
|
|
Kentucky
|
6.0
|
3.6--9.8
|
2.3
|
0.9--5.4
|
4.3
|
2.6--6.9
|
|
32.9
|
26.9--39.5
|
21.7
|
17.2--27.0
|
27.6
|
23.9--31.7
|
|
Louisiana
|
---
|
---
|
---
|
---
|
---
|
---
|
|
---
|
---
|
---
|
---
|
---
|
---
|
|
Maine
|
5.9
|
4.7--7.4
|
3.5
|
2.6--4.9
|
4.8
|
4.0--5.8
|
|
44.7
|
41.8--47.6
|
32.7
|
29.8--35.7
|
39.0
|
37.0--41.1
|
|
Maryland
|
---
|
---
|
---
|
---
|
---
|
---
|
|
---
|
---
|
---
|
---
|
---
|
---
|
|
Massachusetts
|
---
|
---
|
---
|
---
|
---
|
---
|
|
---
|
---
|
---
|
---
|
---
|
---
|
|
Michigan
|
7.0
|
4.7--10.2
|
0.8
|
0.3--2.3
|
4.1
|
2.8--6.0
|
|
27.6
|
23.8--31.8
|
23.4
|
17.5--30.5
|
25.5
|
21.4--30.2
|
|
Mississippi
|
5.7
|
3.3--9.7
|
1.6
|
0.6--4.1
|
3.7
|
2.4--5.6
|
|
21.6
|
16.5--27.8
|
13.8
|
9.6--19.4
|
18.0
|
14.6--22.0
|
|
Missouri
|
5.6
|
2.7--11.0
|
2.4
|
1.1--5.3
|
4.0
|
2.4--6.7
|
|
32.6
|
25.2--40.9
|
24.1
|
18.2--31.2
|
28.3
|
22.8--34.6
|
|
Montana
|
3.5
|
1.9--6.4
|
0.9
|
0.3--2.9
|
2.2
|
1.2--4.1
|
|
37.9
|
31.2--45.1
|
20.7
|
14.8--28.1
|
29.6
|
24.2--35.6
|
|
Nevada
|
4.2
|
2.3--7.8
|
2.4
|
0.9--5.9
|
3.3
|
1.9--5.5
|
|
24.8
|
20.0--30.3
|
15.9
|
11.6--21.3
|
20.2
|
17.0--23.8
|
|
New Hampshire
|
2.5
|
0.9--6.7
|
4.6
|
1.5--13.1
|
3.4
|
1.6--7.1
|
|
43.3
|
36.0--50.9
|
29.1
|
21.9--37.4
|
36.4
|
30.7--42.5
|
|
New Jersey
|
0.7
|
0.2--2.9
|
1.4
|
0.4--4.6
|
1.0
|
0.4--2.6
|
|
23.6
|
17.2--31.5
|
17.4
|
12.1--24.3
|
20.5
|
16.3--25.5
|
|
New Mexico
|
6.5
|
4.5--9.4
|
2.1
|
1.2--3.5
|
4.4
|
3.3--5.9
|
|
21.7
|
18.8--24.9
|
13.1
|
9.8--17.4
|
17.6
|
14.8--20.8
|
|
New York
|
3.5
|
1.4--8.3
|
0.5
|
0.2--1.5
|
2.0
|
0.9--4.1
|
|
22.6
|
16.6--29.9
|
15.8
|
11.6--21.1
|
18.9
|
14.9--23.6
|
|
North Carolina
|
---
|
---
|
---
|
---
|
---
|
---
|
|
---
|
---
|
---
|
---
|
---
|
---
|
|
North Dakota
|
1.6
|
0.6--4.3
|
2.3
|
0.9--5.6
|
1.9
|
0.9--3.8
|
|
26.3
|
21.6--31.7
|
17.4
|
12.4--23.9
|
22.3
|
18.5--26.7
|
|
Oklahoma
|
8.0
|
4.3--14.3
|
2.6
|
1.0--6.7
|
5.3
|
3.2--8.9
|
|
30.1
|
23.8--37.2
|
26.0
|
18.4--35.4
|
28.1
|
23.6--33.0
|
|
Pennsylvania
|
6.1
|
4.1--9.2
|
2.3
|
1.1--4.9
|
4.3
|
2.9--6.3
|
|
31.5
|
26.6--36.8
|
22.9
|
17.6--29.2
|
27.3
|
23.7--31.3
|
|
Rhode Island
|
2.3
|
0.9--6.1
|
2.9
|
1.7--4.9
|
2.6
|
1.4--4.7
|
|
28.2
|
20.0--38.1
|
20.0
|
15.8--25.0
|
24.2
|
19.1--30.2
|
|
South Carolina
|
4.9
|
2.3--10.3
|
2.2
|
0.7--6.6
|
3.5
|
1.7--7.0
|
|
25.5
|
19.7--32.3
|
21.1
|
13.9--30.6
|
23.2
|
17.7--29.9
|
|
South Dakota
|
8.2
|
5.5--11.9
|
6.3
|
3.3--11.5
|
7.3
|
4.7--10.9
|
|
33.5
|
25.0--43.2
|
25.6
|
18.1--34.9
|
29.9
|
24.5--35.9
|
|
Tennessee
|
8.1
|
5.3--12.1
|
2.2
|
1.0--4.7
|
5.1
|
3.4--7.7
|
|
28.8
|
24.0--34.2
|
14.5
|
10.5--19.8
|
21.7
|
18.1--25.8
|
|
Texas
|
2.5
|
1.6--4.0
|
1.2
|
0.6--2.4
|
1.9
|
1.5--2.3
|
|
19.9
|
16.3--24.2
|
11.3
|
8.3--15.2
|
15.8
|
13.1--18.9
|
|
Utah
|
---
|
---
|
---
|
---
|
---
|
---
|
|
---
|
---
|
---
|
---
|
---
|
---
|
|
Vermont
|
---
|
---
|
---
|
---
|
---
|
---
|
|
---
|
---
|
---
|
---
|
---
|
---
|
|
West Virginia
|
2.3
|
1.1--4.7
|
3.4
|
1.3--8.2
|
2.8
|
1.5--5.1
|
|
28.5
|
23.9--33.7
|
22.9
|
14.8--33.7
|
25.9
|
20.2--32.6
|
|
Wisconsin
|
6.8
|
3.8--11.9
|
3.7
|
1.9--7.1
|
5.4
|
3.5--8.1
|
|
39.6
|
33.0--46.6
|
24.0
|
18.5--30.6
|
32.5
|
27.7--37.8
|
|
Wyoming
|
6.5
|
4.5--9.4
|
1.4
|
0.7--2.7
|
4.2
|
3.0--5.8
|
|
37.5
|
33.0--42.1
|
17.0
|
13.6--20.9
|
27.9
|
24.7--31.4
|
|
Median
|
5.7
|
2.2
|
3.9
|
|
28.9
|
20.8
|
25.7
|
|
Range
|
0.7--8.9
|
0.5--6.3
|
1.0--7.3
|
|
19.5--44.7
|
11.3--32.7
|
15.8--39.0
|
|
Local surveys
|
|
|
|
|
|
|
|
|
|
|
|
|
|
|
Boston, MA
|
7.0
|
3.5--13.6
|
3.8
|
1.7--8.5
|
5.3
|
3.1--9.0
|
|
20.2
|
14.3--27.7
|
17.3
|
12.5--23.3
|
18.5
|
14.5--23.3
|
|
Broward County, FL
|
2.2
|
0.9--5.3
|
1.7
|
0.5--5.3
|
2.0
|
0.8--4.7
|
|
15.3
|
10.9--21.0
|
8.6
|
5.5--13.2
|
11.9
|
9.0--15.6
|
|
Charlotte-Mecklenburg, NC
|
3.9
|
1.9--7.6
|
2.4
|
1.1--5.3
|
3.1
|
1.9--5.2
|
|
19.5
|
14.6--25.4
|
12.8
|
8.9--18.0
|
16.1
|
12.7--20.3
|
|
Chicago, IL
|
6.6
|
3.6--11.6
|
2.3
|
0.9--5.8
|
4.2
|
2.6--6.8
|
|
17.7
|
11.9--25.7
|
13.3
|
8.3--20.6
|
15.2
|
11.1--20.6
|
|
Clark County, NV
|
3.5
|
1.5--7.9
|
2.5
|
0.9--6.8
|
3.0
|
1.5--5.6
|
|
25.8
|
19.2--33.7
|
14.9
|
9.5--22.8
|
20.1
|
15.9--25.2
|
|
Dallas, TX
|
4.7
|
2.6--8.4
|
1.2
|
0.2--7.7
|
2.9
|
1.6--5.2
|
|
13.2
|
8.7--19.7
|
5.0
|
2.7--9.0
|
9.0
|
6.2--12.7
|
|
Detroit, MI
|
8.0
|
4.9--12.7
|
0.9
|
0.3--2.9
|
4.4
|
2.9--6.7
|
|
18.0
|
14.1--22.8
|
6.0
|
3.8--9.4
|
11.8
|
9.3--14.8
|
|
Duval County, FL
|
4.2
|
2.5--7.1
|
0.7
|
0.2--2.7
|
2.6
|
1.6--4.2
|
|
24.8
|
19.9--30.5
|
10.8
|
7.2--15.9
|
18.3
|
15.3--21.7
|
|
Los Angeles, CA
|
1.8
|
0.6--4.9
|
0.5
|
0.1--5.1
|
1.1
|
0.6--2.2
|
|
10.0
|
5.9--16.5
|
8.0
|
5.1--12.3
|
8.9
|
6.3--12.5
|
|
Memphis, TN
|
6.3
|
3.3--11.8
|
0.5
|
0.1--3.8
|
3.3
|
1.6--6.4
|
|
18.6
|
14.6--23.4
|
6.6
|
3.9--11.0
|
12.5
|
9.9--15.5
|
|
Miami-Dade County, FL
|
1.7
|
0.3--8.6
|
0.5
|
0.1--2.0
|
1.1
|
0.3--4.0
|
|
14.9
|
10.8--20.3
|
5.4
|
3.3--8.8
|
10.0
|
7.2--13.6
|
|
Milwaukee, WI
|
16.5
|
12.6--21.3
|
7.3
|
4.4--11.8
|
12.1
|
9.3--15.7
|
|
27.7
|
22.8--33.0
|
18.1
|
14.0--23.0
|
23.1
|
19.3--27.4
|
|
New York City, NY
|
1.5
|
1.0--2.3
|
0.7
|
0.3--1.5
|
1.1
|
0.8--1.6
|
|
8.3
|
6.7--10.3
|
7.4
|
5.8--9.4
|
7.9
|
6.7--9.3
|
|
Orange County, FL
|
3.2
|
1.1--8.9
|
0.7
|
0.2--3.1
|
1.8
|
0.7--4.3
|
|
14.7
|
9.6--21.8
|
8.6
|
5.4--13.4
|
11.4
|
8.3--15.3
|
|
Palm Beach County, FL
|
4.4
|
2.5--7.6
|
1.8
|
0.6--5.2
|
3.1
|
1.9--5.0
|
|
22.6
|
18.2--27.7
|
15.8
|
12.3--20.1
|
19.1
|
16.0--22.7
|
|
Philadelphia, PA
|
10.7
|
7.6--14.8
|
1.9
|
0.7--5.1
|
6.4
|
4.5--9.2
|
|
21.7
|
17.0--27.1
|
10.4
|
6.6--15.8
|
16.2
|
12.6--20.5
|
|
San Bernardino, CA
|
3.0
|
1.2--7.1
|
1.7
|
0.6--4.4
|
2.2
|
1.1--4.5
|
|
9.2
|
5.5--14.9
|
10.6
|
6.6--16.8
|
10.0
|
6.7--14.7
|
|
San Diego, CA
|
3.3
|
1.4--7.6
|
2.0
|
0.7--6.1
|
2.6
|
1.3--5.0
|
|
23.2
|
17.8--29.7
|
18.0
|
13.0--24.5
|
20.3
|
16.6--24.6
|
|
San Francisco, CA
|
4.0
|
1.9--8.0
|
1.6
|
0.5--5.0
|
2.7
|
1.4--5.1
|
|
15.6
|
10.6--22.3
|
18.6
|
13.3--25.5
|
17.1
|
13.2--21.9
|
|
Seattle, WA
|
---
|
---
|
---
|
---
|
---
|
---
|
|
---
|
---
|
---
|
---
|
---
|
---
|
|
Median
|
4.0
|
1.7
|
2.9
|
|
18.0
|
10.6
|
15.2
|
|
Range
|
1.5--16.5
|
0.5--7.3
|
1.1--12.1
|
|
8.3--27.7
|
5.0--18.6
|
7.9--23.1
|
|
|
Female
|
Male
|
Total
|
|
Category
|
%
|
CI§
|
%
|
CI
|
%
|
CI
|
|
Race/Ethnicity
|
|
|
|
|
|
|
|
White¶
|
13.1
|
10.1--16.8
|
10.7
|
8.3--13.6
|
12.0
|
10.0--14.4
|
|
Black¶
|
5.6
|
3.4--9.2
|
3.6
|
1.9--6.6
|
4.6
|
3.0--6.7
|
|
Hispanic
|
3.2
|
1.8--5.4
|
3.8
|
2.4--6.0
|
3.5
|
2.2--5.5
|
|
Grade
|
|
|
|
|
|
|
|
9
|
6.6
|
4.1--10.3
|
4.7
|
3.0--7.2
|
5.6
|
4.2--7.5
|
|
10
|
9.3
|
6.5--13.1
|
7.7
|
5.2--11.4
|
8.5
|
6.7--10.7
|
|
11
|
7.5
|
5.4--10.5
|
9.3
|
6.9--12.4
|
8.4
|
6.9--10.2
|
|
12
|
13.7
|
9.7--19.0
|
8.2
|
6.0--11.1
|
11.3
|
8.6--14.8
|
|
Total
|
9.8
|
7.9--12.1
|
7.8
|
6.4--9.5
|
8.9
|
7.6--10.3
|
|
|
Female
|
Male
|
Total
|
|
Site
|
%
|
CI§
|
%
|
CI
|
%
|
CI
|
|
State surveys
|
|
|
|
|
|
|
|
Alabama
|
14.3
|
10.8--18.7
|
8.8
|
5.3--14.0
|
11.6
|
8.6--15.5
|
|
Alaska
|
12.7
|
7.5--20.9
|
15.7
|
10.6--22.7
|
14.3
|
10.5--19.2
|
|
Arizona
|
3.4
|
1.5--7.5
|
9.1
|
5.2--15.5
|
6.2
|
4.0--9.6
|
|
Arkansas
|
11.5
|
7.2--17.7
|
8.5
|
4.9--14.3
|
10.1
|
7.2--14.1
|
|
Colorado
|
13.0
|
8.5--19.2
|
9.7
|
5.8--15.8
|
11.2
|
7.6--16.3
|
|
Connecticut
|
9.7
|
6.3--14.8
|
5.9
|
3.5--9.7
|
7.8
|
5.7--10.6
|
|
Delaware
|
9.5
|
6.8--13.0
|
7.2
|
5.3--9.7
|
8.3
|
6.6--10.4
|
|
Florida
|
10.5
|
8.1--13.5
|
7.0
|
5.1--9.6
|
8.7
|
7.2--10.6
|
|
Georgia
|
---¶
|
---
|
---
|
---
|
---
|
---
|
|
Hawaii
|
2.6
|
1.3--5.1
|
5.3
|
1.4--17.9
|
3.8
|
1.6--8.9
|
|
Idaho
|
---
|
---
|
---
|
---
|
---
|
---
|
|
Illinois
|
11.3
|
8.4--15.0
|
10.3
|
6.5--15.8
|
10.8
|
8.7--13.3
|
|
Indiana
|
15.2
|
10.7--21.1
|
10.1
|
6.6--15.3
|
12.9
|
10.0--16.6
|
|
Kansas
|
12.5
|
9.1--16.9
|
9.6
|
6.6--13.8
|
11.1
|
9.0--13.6
|
|
Kentucky
|
14.1
|
9.9--19.7
|
9.3
|
6.3--13.6
|
11.9
|
9.1--15.2
|
|
Louisiana
|
---
|
---
|
---
|
---
|
---
|
---
|
|
Maine
|
19.0
|
16.9--21.3
|
13.4
|
11.3--15.8
|
16.4
|
15.0--18.0
|
|
Maryland
|
---
|
---
|
---
|
---
|
---
|
---
|
|
Massachusetts
|
---
|
---
|
---
|
---
|
---
|
---
|
|
Michigan
|
7.9
|
5.9--10.6
|
9.4
|
6.6--13.1
|
8.6
|
6.8--10.8
|
|
Mississippi
|
8.4
|
5.2--13.1
|
5.7
|
3.2--10.1
|
7.2
|
5.2--9.8
|
|
Missouri
|
10.7
|
7.3--15.5
|
8.3
|
4.9--13.6
|
9.5
|
7.5--12.0
|
|
Montana
|
14.4
|
9.9--20.5
|
8.6
|
5.2--13.7
|
11.6
|
8.6--15.6
|
|
Nevada
|
9.6
|
6.4--14.1
|
4.4
|
2.4--8.1
|
7.0
|
4.9--9.8
|
|
New Hampshire
|
14.3
|
9.9--20.3
|
11.2
|
7.3--16.6
|
12.7
|
9.8--16.3
|
|
New Jersey
|
8.1
|
5.3--12.4
|
7.7
|
4.4--13.0
|
7.9
|
5.8--10.7
|
|
New Mexico
|
6.6
|
4.5--9.6
|
4.4
|
3.3--5.8
|
5.5
|
4.1--7.5
|
|
New York
|
9.0
|
5.8--13.8
|
5.9
|
3.2--10.6
|
7.4
|
4.8--11.2
|
|
North Carolina
|
---
|
---
|
---
|
---
|
---
|
---
|
|
North Dakota
|
---
|
---
|
---
|
---
|
---
|
---
|
|
Oklahoma
|
12.6
|
8.5--18.3
|
10.4
|
5.7--18.1
|
11.5
|
7.7--16.9
|
|
Pennsylvania
|
15.8
|
12.0--20.6
|
9.3
|
6.1--13.8
|
12.7
|
10.1--15.7
|
|
Rhode Island
|
10.1
|
6.4--15.7
|
8.2
|
5.0--13.1
|
9.1
|
6.0--13.7
|
|
South Carolina
|
10.5
|
7.0--15.6
|
7.5
|
4.4--12.4
|
9.0
|
6.1--13.0
|
|
South Dakota
|
14.3
|
8.9--22.1
|
9.0
|
5.3--14.8
|
11.8
|
8.2--16.6
|
|
Tennessee
|
10.6
|
7.5--14.7
|
6.6
|
4.0--10.6
|
8.6
|
6.4--11.6
|
|
Texas
|
8.4
|
5.7--12.2
|
3.5
|
2.1--5.5
|
6.0
|
4.2--8.5
|
|
Utah
|
---
|
---
|
---
|
---
|
---
|
---
|
|
Vermont
|
---
|
---
|
---
|
---
|
---
|
---
|
|
West Virginia
|
9.5
|
6.6--13.6
|
7.9
|
4.9--12.5
|
8.8
|
7.0--11.0
|
|
Wisconsin
|
17.5
|
12.9--23.4
|
11.4
|
8.0--16.1
|
14.7
|
12.2--17.6
|
|
Wyoming
|
15.4
|
12.4--19.0
|
6.8
|
4.4--10.3
|
11.4
|
9.3--14.0
|
|
Median
|
10.7
|
8.5
|
9.5
|
|
Range
|
2.6--19.0
|
3.5--15.7
|
3.8--16.4
|
|
Local surveys
|
|
|
|
|
|
|
|
Boston, MA
|
5.9
|
3.1--11.0
|
8.8
|
5.3--14.2
|
7.3
|
4.9--10.8
|
|
Broward County, FL
|
6.3
|
3.9--10.2
|
2.7
|
1.3--5.6
|
4.5
|
2.8--7.1
|
|
Charlotte-Mecklenburg, NC
|
6.0
|
3.6--9.9
|
4.5
|
2.5--8.1
|
5.3
|
3.6--7.7
|
|
Chicago, IL
|
7.1
|
3.9--12.4
|
4.9
|
2.4--9.9
|
5.9
|
3.5--9.8
|
|
Clark County, NV
|
11.4
|
7.1--17.8
|
5.2
|
2.8--9.6
|
8.2
|
5.6--11.8
|
|
Dallas, TX
|
3.6
|
2.0--6.4
|
1.9
|
0.7--4.8
|
2.7
|
1.6--4.5
|
|
Detroit, MI
|
5.2
|
3.2--8.4
|
2.8
|
1.2--6.4
|
4.2
|
2.7--6.3
|
|
Duval County, FL
|
8.8
|
5.9--12.8
|
4.6
|
2.3--8.9
|
6.9
|
4.9--9.6
|
|
Los Angeles, CA
|
2.5
|
0.8--7.9
|
3.5
|
1.6--7.5
|
3.0
|
1.6--5.7
|
|
Memphis, TN
|
11.5
|
8.0--16.2
|
3.8
|
1.9--7.6
|
7.7
|
5.5--10.6
|
|
Miami-Dade County, FL
|
2.9
|
1.5--5.5
|
2.9
|
1.4--5.7
|
2.9
|
1.6--5.0
|
|
Milwaukee, WI
|
11.5
|
8.4--15.6
|
8.6
|
5.6--13.0
|
10.1
|
7.5--13.5
|
|
New York City, NY
|
3.1
|
2.3--4.2
|
3.1
|
2.1--4.7
|
3.1
|
2.4--4.1
|
|
Orange County, FL
|
5.6
|
2.8--10.8
|
4.6
|
2.4--8.8
|
5.1
|
3.1--8.1
|
|
Palm Beach County, FL
|
8.5
|
5.8--12.4
|
7.6
|
5.2--10.8
|
8.0
|
6.1--10.4
|
|
Philadelphia, PA
|
8.9
|
5.7--13.8
|
3.4
|
1.6--7.1
|
6.2
|
4.3--8.9
|
|
San Bernardino, CA
|
2.8
|
1.3--6.1
|
2.7
|
1.1--6.4
|
2.8
|
1.4--5.2
|
|
San Diego, CA
|
6.1
|
3.6--10.0
|
6.7
|
3.7--11.6
|
6.4
|
4.4--9.2
|
|
San Francisco, CA
|
2.8
|
1.1--7.3
|
4.5
|
2.4--8.3
|
3.7
|
2.2--6.2
|
|
Seattle, WA
|
---
|
---
|
---
|
---
|
---
|
---
|
|
Median
|
6.0
|
4.5
|
5.3
|
|
Range
|
2.5--11.5
|
1.9--8.8
|
2.7--10.1
|
|
|
Drank alcohol or used drugs before last sexual intercourse
|
|
Were taught in school about AIDS or HIV infection
|
|
|
Female
|
Male
|
Total
|
|
Female
|
Male
|
Total
|
|
Category
|
%
|
CI†
|
%
|
CI
|
%
|
CI
|
|
%
|
CI
|
%
|
CI
|
%
|
CI
|
|
Race/Ethnicity
|
|
|
|
|
|
|
|
|
|
|
|
|
|
|
White§
|
18.2
|
15.8--20.7
|
28.0
|
25.2--31.0
|
22.9
|
20.8--25.1
|
|
89.6
|
87.5--91.4
|
87.8
|
85.0--90.1
|
88.6
|
86.5--90.4
|
|
Black§
|
15.2
|
10.7--21.1
|
20.8
|
15.9--26.6
|
18.2
|
14.0--23.2
|
|
86.9
|
83.5--89.7
|
85.2
|
82.0--87.9
|
86.1
|
83.2--88.5
|
|
Hispanic
|
15.0
|
12.1--18.5
|
22.6
|
18.8--27.0
|
18.9
|
16.5--21.5
|
|
83.2
|
80.2--85.9
|
83.2
|
80.8--85.4
|
83.2
|
80.8--85.4
|
|
Grade
|
|
|
|
|
|
|
|
|
|
|
|
|
|
|
9
|
23.5
|
19.6--28.0
|
25.9
|
20.5--32.1
|
24.7
|
21.3--28.5
|
|
84.6
|
81.7--87.1
|
81.8
|
78.1--84.9
|
83.1
|
80.5--85.4
|
|
10
|
18.1
|
14.2--22.8
|
26.5
|
21.9--31.6
|
22.4
|
19.1--26.2
|
|
87.7
|
85.0--89.9
|
86.9
|
83.5--89.7
|
87.3
|
84.6--89.5
|
|
11
|
14.7
|
11.4--18.8
|
25.9
|
21.9--30.5
|
20.3
|
17.4--23.5
|
|
89.9
|
88.0--91.5
|
88.8
|
86.1--91.0
|
89.3
|
87.4--90.9
|
|
12
|
15.2
|
12.7--18.1
|
25.8
|
22.3--29.5
|
20.2
|
17.7--22.8
|
|
89.4
|
86.7--91.7
|
89.1
|
87.1--90.8
|
89.3
|
87.3--91.0
|
|
Total
|
17.1
|
15.4--19.0
|
25.9
|
23.8--28.3
|
21.6
|
20.0--23.3
|
|
87.8
|
86.3--89.1
|
86.3
|
84.7--87.8
|
87.0
|
85.7--88.3
|
|
|
Drank alcohol or used drugs before last sexual intercourse
|
|
Were taught in school about AIDS or HIV infection
|
|
|
Female
|
Male
|
Total
|
|
Female
|
Male
|
Total
|
|
Site
|
%
|
CI†
|
%
|
CI
|
%
|
CI
|
|
%
|
CI
|
%
|
CI
|
%
|
CI
|
|
State surveys
|
|
|
|
|
|
|
|
|
|
|
|
|
|
|
Alabama
|
14.7
|
11.1--19.1
|
27.9
|
22.3--34.3
|
21.2
|
17.2--25.7
|
|
87.4
|
81.8--91.4
|
82.3
|
77.3--86.4
|
84.6
|
80.1--88.2
|
|
Alaska
|
15.2
|
10.1--22.2
|
18.6
|
12.2--27.4
|
17.1
|
13.1--22.0
|
|
84.0
|
80.2--87.2
|
84.0
|
80.3--87.1
|
83.9
|
80.9--86.5
|
|
Arizona
|
15.9
|
11.6--21.4
|
28.0
|
22.8--33.8
|
22.4
|
19.2--26.1
|
|
---§
|
---
|
---
|
---
|
---
|
---
|
|
Arkansas
|
19.5
|
14.2--26.1
|
20.9
|
13.6--30.9
|
20.1
|
15.6--25.6
|
|
85.2
|
81.7--88.1
|
79.6
|
75.3--83.4
|
82.4
|
79.4--85.0
|
|
Colorado
|
26.7
|
19.6--35.3
|
22.6
|
16.0--30.8
|
24.4
|
20.7--28.6
|
|
82.3
|
77.2--86.4
|
81.8
|
76.5--86.1
|
81.9
|
77.3--85.7
|
|
Connecticut
|
21.5
|
15.7--28.7
|
28.3
|
23.3--34.0
|
24.8
|
20.3--29.9
|
|
---
|
---
|
---
|
---
|
---
|
---
|
|
Delaware
|
16.0
|
11.9--21.1
|
28.3
|
23.8--33.2
|
22.1
|
18.6--26.0
|
|
90.3
|
88.0--92.2
|
87.0
|
84.3--89.2
|
88.5
|
86.5--90.2
|
|
Florida
|
15.2
|
12.9--17.8
|
23.8
|
21.2--26.6
|
19.7
|
17.7--21.9
|
|
89.5
|
87.5--91.3
|
87.0
|
85.0--88.7
|
88.2
|
86.4--89.7
|
|
Georgia
|
---
|
---
|
---
|
---
|
---
|
---
|
|
92.1
|
89.1--94.4
|
86.8
|
83.1--89.8
|
89.4
|
86.9--91.5
|
|
Hawaii
|
25.9
|
15.5--40.1
|
35.9
|
26.7--46.3
|
30.2
|
21.7--40.3
|
|
85.1
|
80.2--88.9
|
77.1
|
71.5--81.9
|
80.9
|
76.5--84.6
|
|
Idaho
|
---
|
---
|
---
|
---
|
---
|
---
|
|
85.4
|
82.0--88.2
|
86.0
|
83.1--88.4
|
85.6
|
83.1--87.9
|
|
Illinois
|
16.3
|
12.4--21.1
|
25.9
|
21.1--31.4
|
21.1
|
17.9--24.7
|
|
90.0
|
86.9--92.3
|
84.2
|
80.9--87.0
|
86.9
|
84.0--89.4
|
|
Indiana
|
16.3
|
11.7--22.3
|
27.4
|
21.3--34.5
|
21.0
|
17.9--24.6
|
|
91.3
|
87.4--94.0
|
88.1
|
83.8--91.3
|
89.6
|
87.2--91.7
|
|
Kansas
|
15.3
|
11.2--20.5
|
24.7
|
18.9--31.5
|
19.9
|
16.4--23.9
|
|
84.9
|
79.2--89.2
|
82.9
|
78.0--86.9
|
83.8
|
79.6--87.2
|
|
Kentucky
|
18.0
|
14.5--22.1
|
28.6
|
21.3--37.2
|
22.9
|
18.8--27.6
|
|
87.0
|
83.5--89.8
|
82.9
|
78.9--86.2
|
84.9
|
82.0--87.3
|
|
Louisiana
|
---
|
---
|
---
|
---
|
---
|
---
|
|
78.6
|
75.2--81.6
|
73.8
|
66.9--79.7
|
76.2
|
72.3--79.7
|
|
Maine
|
16.6
|
14.7--18.7
|
24.3
|
21.7--27.1
|
20.5
|
18.9--22.2
|
|
88.9
|
87.9--89.9
|
85.4
|
84.1--86.6
|
86.9
|
86.1--87.7
|
|
Maryland
|
---
|
---
|
---
|
---
|
---
|
---
|
|
89.8
|
87.0--92.1
|
81.6
|
78.6--84.3
|
85.7
|
83.6--87.6
|
|
Massachusetts
|
20.0
|
16.3--24.2
|
27.6
|
22.2--33.7
|
23.5
|
20.0--27.3
|
|
87.6
|
83.3--90.9
|
87.2
|
83.9--89.9
|
87.4
|
84.0--90.1
|
|
Michigan
|
20.9
|
17.6--24.5
|
29.2
|
23.3--35.9
|
24.7
|
20.7--29.2
|
|
91.0
|
89.1--92.7
|
87.2
|
84.2--89.6
|
88.9
|
86.9--90.6
|
|
Mississippi
|
12.9
|
10.3--16.1
|
25.0
|
22.1--28.3
|
19.0
|
16.8--21.3
|
|
83.9
|
81.4--86.2
|
81.3
|
77.1--84.9
|
82.5
|
79.7--85.1
|
|
Missouri
|
19.4
|
14.2--26.0
|
27.3
|
20.5--35.3
|
23.3
|
18.5--29.0
|
|
91.4
|
85.9--94.9
|
87.9
|
81.9--92.1
|
89.6
|
84.9--93.0
|
|
Montana
|
22.3
|
16.4--29.7
|
29.4
|
23.4--36.2
|
25.7
|
20.9--31.2
|
|
87.6
|
84.5--90.1
|
85.4
|
81.7--88.5
|
86.5
|
83.7--88.9
|
|
Nevada
|
15.5
|
11.7--20.3
|
25.4
|
20.2--31.4
|
20.7
|
17.6--24.2
|
|
84.4
|
81.2--87.1
|
81.5
|
77.6--84.8
|
82.9
|
79.9--85.6
|
|
New Hampshire
|
19.5
|
14.8--25.2
|
23.5
|
17.9--30.2
|
21.4
|
18.1--25.1
|
|
90.9
|
87.9--93.2
|
89.2
|
85.8--91.9
|
89.9
|
87.5--91.9
|
|
New Jersey
|
14.3
|
11.2--18.2
|
24.6
|
20.0--29.9
|
19.4
|
16.2--23.1
|
|
92.7
|
90.6--94.3
|
91.2
|
87.9--93.6
|
91.9
|
90.1--93.5
|
|
New Mexico
|
20.3
|
16.0--25.4
|
26.0
|
22.5--29.9
|
23.1
|
19.4--27.4
|
|
77.1
|
71.1--82.2
|
77.4
|
73.5--80.9
|
77.3
|
72.5--81.4
|
|
New York
|
17.7
|
14.0--22.2
|
26.8
|
21.6--32.7
|
22.3
|
18.6--26.6
|
|
---
|
---
|
---
|
---
|
---
|
---
|
|
North Carolina
|
14.6
|
11.1--19.0
|
24.1
|
18.8--30.3
|
19.3
|
15.3--24.0
|
|
---
|
---
|
---
|
---
|
---
|
---
|
|
North Dakota
|
23.7
|
19.1--29.0
|
25.6
|
19.7--32.4
|
24.6
|
21.0--28.6
|
|
88.4
|
85.1--91.1
|
88.1
|
84.9--90.6
|
88.1
|
85.7--90.2
|
|
Oklahoma
|
20.2
|
16.2--25.0
|
19.6
|
13.3--27.9
|
19.9
|
16.4--24.0
|
|
85.0
|
80.6--88.5
|
79.1
|
72.7--84.4
|
82.1
|
77.5--85.8
|
|
Pennsylvania
|
11.3
|
7.7--16.4
|
18.4
|
13.6--24.4
|
14.6
|
11.0--19.1
|
|
91.7
|
89.0--93.8
|
88.2
|
84.8--90.9
|
89.9
|
87.7--91.8
|
|
Rhode Island
|
14.6
|
11.9--17.9
|
20.5
|
16.7--24.9
|
17.5
|
15.4--19.8
|
|
88.0
|
85.2--90.4
|
85.5
|
82.6--88.0
|
86.7
|
84.1--89.0
|
|
South Carolina
|
20.0
|
14.7--26.5
|
18.1
|
12.7--25.1
|
19.0
|
14.6--24.4
|
|
91.2
|
87.9--93.6
|
89.2
|
86.7--91.3
|
90.1
|
87.9--91.9
|
|
South Dakota
|
23.4
|
15.2--34.1
|
24.1
|
17.9--31.6
|
23.7
|
18.5--29.7
|
|
78.4
|
71.8--83.7
|
78.1
|
71.9--83.3
|
78.3
|
72.5--83.1
|
|
Tennessee
|
14.8
|
12.5--17.6
|
21.4
|
16.0--27.9
|
18.2
|
15.5--21.3
|
|
86.4
|
83.1--89.2
|
82.1
|
78.4--85.3
|
84.2
|
81.3--86.7
|
|
Texas
|
18.1
|
15.0--21.7
|
25.4
|
22.4--28.7
|
21.7
|
19.3--24.3
|
|
82.9
|
78.9--86.2
|
83.0
|
79.5--86.0
|
82.9
|
79.7--85.8
|
|
Utah
|
---
|
---
|
---
|
---
|
---
|
---
|
|
84.5
|
81.8--86.9
|
83.2
|
78.8--86.8
|
83.8
|
81.2--86.1
|
|
Vermont
|
---
|
---
|
---
|
---
|
---
|
---
|
|
---
|
---
|
---
|
---
|
---
|
---
|
|
West Virginia
|
20.1
|
15.6--25.6
|
24.8
|
18.3--32.7
|
22.3
|
18.5--26.7
|
|
90.4
|
88.1--92.2
|
82.8
|
79.7--85.5
|
86.3
|
84.2--88.1
|
|
Wisconsin
|
14.2
|
10.7--18.6
|
18.9
|
14.9--23.8
|
16.5
|
13.3--20.3
|
|
89.7
|
86.9--92.0
|
90.0
|
87.8--91.8
|
89.8
|
87.9--91.4
|
|
Wyoming
|
19.3
|
16.2--22.8
|
30.4
|
26.0--35.2
|
24.5
|
21.7--27.4
|
|
86.1
|
83.7--88.2
|
83.2
|
81.0--85.3
|
84.6
|
82.9--86.2
|
|
Median
|
17.8
|
25.2
|
21.3
|
|
87.6
|
84.0
|
85.7
|
|
Range
|
11.3--26.7
|
18.1--35.9
|
14.6--30.2
|
|
77.1--92.7
|
73.8--91.2
|
76.2--91.9
|
|
Local surveys
|
|
|
|
|
|
|
|
|
|
|
|
|
|
|
Boston, MA
|
18.6
|
12.7--26.4
|
24.9
|
17.4--34.4
|
22.0
|
17.0--28.0
|
|
74.5
|
70.8--77.9
|
79.3
|
75.0--83.0
|
77.0
|
74.0--79.7
|
|
Broward County, FL
|
21.8
|
16.1--28.7
|
25.3
|
19.8--31.8
|
23.7
|
19.6--28.3
|
|
87.1
|
83.1--90.3
|
87.3
|
84.2--89.8
|
87.2
|
84.4--89.5
|
|
Charlotte-Mecklenburg, NC
|
15.5
|
11.4--20.7
|
21.7
|
16.3--28.2
|
18.7
|
15.5--22.5
|
|
---
|
---
|
---
|
---
|
---
|
---
|
|
Chicago, IL
|
12.3
|
8.0--18.6
|
23.1
|
15.9--32.3
|
18.1
|
12.7--25.1
|
|
85.8
|
82.9--88.3
|
81.9
|
75.7--86.8
|
83.6
|
79.8--86.8
|
|
Clark County, NV
|
17.1
|
12.6--22.8
|
26.1
|
20.0--33.2
|
21.7
|
18.0--25.8
|
|
83.7
|
80.1--86.8
|
78.5
|
74.0--82.5
|
81.1
|
77.6--84.2
|
|
Dallas, TX
|
12.0
|
8.1--17.4
|
24.0
|
17.9--31.5
|
18.2
|
14.2--23.0
|
|
83.5
|
78.6--87.4
|
76.0
|
70.4--80.8
|
79.5
|
74.9--83.5
|
|
Detroit, MI
|
10.1
|
6.6--15.2
|
17.3
|
11.4--25.4
|
14.0
|
9.7--19.7
|
|
83.5
|
80.5--86.1
|
78.3
|
74.4--81.8
|
80.9
|
78.6--83.0
|
|
Duval County, FL
|
17.1
|
13.0--22.1
|
26.8
|
22.0--32.2
|
21.5
|
18.0--25.5
|
|
87.1
|
84.5--89.3
|
81.8
|
79.1--84.3
|
84.3
|
82.2--86.2
|
|
Los Angeles, CA
|
12.7
|
8.3--19.0
|
23.9
|
18.3--30.5
|
18.7
|
15.1--23.0
|
|
87.5
|
83.8--90.5
|
82.9
|
77.7--87.1
|
85.0
|
81.2--88.1
|
|
Memphis, TN
|
8.4
|
5.4--12.7
|
21.4
|
15.4--29.0
|
15.3
|
11.5--19.9
|
|
82.2
|
77.5--86.1
|
76.4
|
71.2--81.0
|
79.4
|
75.7--82.6
|
|
Miami-Dade County, FL
|
10.8
|
7.7--15.1
|
25.8
|
20.0--32.7
|
18.7
|
15.1--23.1
|
|
87.7
|
85.2--89.9
|
81.8
|
78.1--84.9
|
84.7
|
82.2--86.9
|
|
Milwaukee, WI
|
13.3
|
9.4--18.5
|
22.1
|
17.0--28.2
|
17.5
|
14.3--21.3
|
|
86.6
|
83.9--88.9
|
83.8
|
80.5--86.5
|
85.1
|
82.8--87.2
|
|
New York City, NY
|
15.1
|
12.1--18.8
|
22.7
|
20.2--25.4
|
18.9
|
17.1--20.7
|
|
---
|
---
|
---
|
---
|
---
|
---
|
|
Orange County, FL
|
16.8
|
12.3--22.5
|
25.6
|
19.6--32.8
|
21.6
|
17.4--26.6
|
|
89.9
|
86.0--92.8
|
83.8
|
80.0--87.1
|
86.8
|
83.9--89.3
|
|
Palm Beach County, FL
|
16.7
|
12.8--21.4
|
24.9
|
20.0--30.7
|
21.1
|
17.6--25.0
|
|
88.3
|
85.7--90.5
|
83.5
|
80.0--86.6
|
85.9
|
83.7--87.8
|
|
Philadelphia, PA
|
9.1
|
5.9--13.6
|
13.4
|
8.6--20.3
|
11.1
|
8.2--14.9
|
|
85.9
|
83.2--88.3
|
81.3
|
74.7--86.5
|
83.7
|
80.1--86.7
|
|
San Bernardino, CA
|
15.5
|
11.2--21.0
|
27.6
|
20.8--35.6
|
22.4
|
18.0--27.5
|
|
79.7
|
76.1--82.9
|
82.8
|
79.1--86.0
|
81.2
|
78.3--83.8
|
|
San Diego, CA
|
18.9
|
14.3--24.5
|
23.7
|
17.8--30.9
|
21.4
|
17.8--25.6
|
|
87.2
|
83.8--89.9
|
89.0
|
86.4--91.1
|
88.1
|
86.0--89.9
|
|
San Francisco, CA
|
15.4
|
10.4--22.2
|
27.4
|
20.4--35.8
|
22.0
|
17.4--27.5
|
|
88.3
|
85.0--90.9
|
82.9
|
79.0--86.2
|
85.4
|
82.3--88.1
|
|
Seattle, WA
|
---
|
---
|
---
|
---
|
---
|
---
|
|
89.2
|
87.0--91.1
|
85.3
|
81.8--88.2
|
87.0
|
84.7--88.9
|
|
Median
|
15.4
|
24.0
|
18.9
|
|
86.8
|
82.3
|
84.5
|
|
Range
|
8.4--21.8
|
13.4--27.6
|
11.1--23.7
|
|
74.5--89.9
|
76.0--89.0
|
77.0--88.1
|
|
|
Female
|
Male
|
Total
|
|
Category
|
%
|
CI†
|
%
|
CI
|
%
|
CI
|
|
Race/Ethnicity
|
|
|
|
|
|
|
|
White§
|
13.2
|
11.1--15.7
|
9.1
|
7.7--10.7
|
11.0
|
9.6--12.6
|
|
Black§
|
25.1
|
21.1--29.5
|
17.6
|
14.3--21.6
|
21.4
|
18.1--25.2
|
|
Hispanic
|
12.4
|
11.0--14.0
|
12.4
|
10.1--15.0
|
12.4
|
10.9--14.0
|
|
Grade
|
|
|
|
|
|
|
|
9
|
8.2
|
6.6--10.1
|
8.9
|
7.1--11.1
|
8.6
|
7.4--10.1
|
|
10
|
12.0
|
10.3--13.9
|
9.2
|
7.0--11.9
|
10.5
|
9.1--12.1
|
|
11
|
16.4
|
14.6--18.5
|
12.5
|
10.4--15.0
|
14.4
|
12.8--16.2
|
|
12
|
23.5
|
20.1--27.4
|
13.7
|
11.7--16.0
|
18.5
|
16.3--20.9
|
|
Total
|
14.7
|
13.3--16.2
|
10.9
|
9.4--12.5
|
12.7
|
11.6--14.0
|
|
|
Ate fruit or drank 100% fruit juices two or more times/day
|
|
Ate vegetables three or more times/day
|
|
|
Female
|
Male
|
Total
|
|
Female
|
Male
|
Total
|
|
Category
|
%
|
CI§
|
%
|
CI
|
%
|
CI
|
|
%
|
CI
|
%
|
CI
|
%
|
CI
|
|
Race/Ethnicity
|
|
|
|
|
|
|
|
|
|
|
|
|
|
|
White¶
|
31.2
|
28.1--34.5
|
33.1
|
29.6--36.8
|
32.2
|
29.7--34.9
|
|
12.8
|
11.2--14.6
|
12.8
|
11.4--14.4
|
12.8
|
11.5--14.3
|
|
Black¶
|
35.0
|
32.1--38.0
|
39.6
|
36.0--43.4
|
37.3
|
34.5--40.2
|
|
13.1
|
11.5--14.8
|
15.4
|
13.1--17.9
|
14.3
|
12.9--15.8
|
|
Hispanic
|
32.4
|
29.9--35.0
|
35.9
|
32.5--39.5
|
34.1
|
31.6--36.8
|
|
11.5
|
10.0--13.1
|
15.9
|
13.8--18.3
|
13.7
|
12.4--15.2
|
|
Grade
|
|
|
|
|
|
|
|
|
|
|
|
|
|
|
9
|
33.9
|
30.6--37.3
|
36.5
|
33.3--39.8
|
35.3
|
32.6--38.0
|
|
13.3
|
11.3--15.5
|
15.7
|
13.8--17.9
|
14.6
|
13.2--16.2
|
|
10
|
30.3
|
26.8--34.0
|
37.6
|
34.3--41.1
|
34.1
|
31.6--36.7
|
|
12.9
|
11.2--15.0
|
14.5
|
12.8--16.4
|
13.8
|
12.5--15.3
|
|
11
|
32.8
|
30.0--35.8
|
33.9
|
31.0--37.0
|
33.4
|
31.1--35.8
|
|
13.6
|
11.4--16.2
|
13.0
|
11.0--15.3
|
13.3
|
11.6--15.1
|
|
12
|
31.4
|
27.4--35.7
|
32.5
|
29.0--36.2
|
32.0
|
30.1--33.9
|
|
12.2
|
10.5--14.2
|
14.0
|
11.5--17.1
|
13.2
|
11.4--15.2
|
|
Total
|
32.2
|
30.0--34.5
|
35.3
|
33.1--37.7
|
33.9
|
32.2--35.6
|
|
13.0
|
11.9--14.3
|
14.5
|
13.3--15.7
|
13.8
|
12.9--14.8
|
|
|
Ate fruit or drank 100% fruit juices two or more times/day
|
|
Ate vegetables three or more times/day
|
|
|
Female
|
Male
|
Total
|
|
Female
|
Male
|
Total
|
|
Site
|
%
|
CI§
|
%
|
CI
|
%
|
CI
|
|
%
|
CI
|
%
|
CI
|
%
|
CI
|
|
State surveys
|
|
|
|
|
|
|
|
|
|
|
|
|
|
|
Alabama
|
22.6
|
19.0--26.6
|
22.2
|
18.2--26.8
|
22.5
|
19.4--25.9
|
|
11.5
|
9.0--14.4
|
14.0
|
11.7--16.8
|
12.9
|
10.6--15.5
|
|
Alaska
|
28.0
|
25.1--31.1
|
27.4
|
23.8--31.2
|
27.5
|
25.2--30.0
|
|
12.5
|
10.1--15.5
|
13.9
|
11.0--17.4
|
13.2
|
11.6--15.0
|
|
Arizona
|
---¶
|
---
|
---
|
---
|
---
|
---
|
|
---
|
---
|
---
|
---
|
---
|
---
|
|
Arkansas
|
25.1
|
19.9--31.2
|
26.5
|
23.5--29.7
|
25.7
|
22.3--29.5
|
|
10.3
|
7.8--13.5
|
13.0
|
10.8--15.6
|
11.7
|
9.5--14.2
|
|
Colorado
|
31.7
|
27.4--36.4
|
34.8
|
30.4--39.5
|
33.2
|
30.0--36.5
|
|
13.1
|
10.8--15.8
|
19.1
|
15.8--22.8
|
16.2
|
14.5--18.1
|
|
Connecticut
|
33.7
|
30.4--37.2
|
37.3
|
34.8--39.9
|
35.6
|
33.3--38.0
|
|
11.9
|
9.6--14.7
|
13.7
|
12.0--15.7
|
12.9
|
11.5--14.4
|
|
Delaware
|
25.5
|
23.5--27.7
|
31.0
|
28.2--34.0
|
28.4
|
26.7--30.1
|
|
---
|
---
|
---
|
---
|
---
|
---
|
|
Florida
|
29.4
|
27.9--31.0
|
36.3
|
34.2--38.4
|
32.8
|
31.5--34.2
|
|
10.9
|
9.9--11.9
|
15.1
|
13.8--16.5
|
12.9
|
12.0--13.9
|
|
Georgia
|
28.5
|
24.6--32.8
|
30.2
|
27.4--33.3
|
29.4
|
26.5--32.4
|
|
8.1
|
6.4--10.1
|
13.6
|
10.9--16.9
|
10.8
|
8.9--13.1
|
|
Hawaii
|
21.8
|
18.3--25.8
|
27.1
|
23.4--31.1
|
24.4
|
22.3--26.7
|
|
13.0
|
9.9--17.0
|
16.0
|
12.7--20.1
|
14.7
|
12.3--17.5
|
|
Idaho
|
27.7
|
25.0--30.6
|
30.0
|
27.6--32.5
|
28.9
|
27.1--30.8
|
|
10.2
|
8.3--12.3
|
11.9
|
9.7--14.5
|
11.1
|
9.7--12.7
|
|
Illinois
|
28.9
|
25.0--33.1
|
30.7
|
27.3--34.4
|
29.9
|
27.4--32.4
|
|
10.8
|
9.1--12.9
|
12.9
|
10.5--15.7
|
12.0
|
10.4--13.7
|
|
Indiana
|
25.3
|
21.2--29.9
|
29.6
|
25.5--34.1
|
27.4
|
24.1--31.0
|
|
9.0
|
7.1--11.4
|
12.4
|
10.4--14.7
|
10.7
|
9.1--12.5
|
|
Kansas
|
29.7
|
26.4--33.2
|
31.4
|
27.4--35.7
|
30.6
|
27.8--33.6
|
|
13.7
|
11.7--16.1
|
17.6
|
15.4--20.1
|
15.7
|
14.2--17.4
|
|
Kentucky
|
24.5
|
21.9--27.3
|
24.1
|
20.4--28.2
|
24.2
|
21.7--26.9
|
|
11.2
|
9.4--13.2
|
10.7
|
8.3--13.6
|
10.9
|
9.4--12.7
|
|
Louisiana
|
21.6
|
17.4--26.4
|
20.9
|
16.2--26.6
|
21.3
|
18.1--24.9
|
|
7.7
|
5.2--11.2
|
11.8
|
8.5--16.2
|
9.7
|
8.0--11.8
|
|
Maine
|
30.1
|
28.6--31.6
|
28.0
|
26.6--29.5
|
29.1
|
28.0--30.1
|
|
---
|
---
|
---
|
---
|
---
|
---
|
|
Maryland
|
35.9
|
31.1--41.0
|
36.3
|
33.0--39.7
|
36.0
|
32.8--39.3
|
|
11.7
|
9.6--14.2
|
13.3
|
11.0--16.1
|
12.6
|
10.8--14.6
|
|
Massachusetts
|
---
|
---
|
---
|
---
|
---
|
---
|
|
---
|
---
|
---
|
---
|
---
|
---
|
|
Michigan
|
30.9
|
26.7--35.5
|
32.3
|
28.4--36.5
|
31.6
|
28.0--35.4
|
|
11.6
|
9.6--14.0
|
11.4
|
9.5--13.7
|
11.6
|
10.6--12.7
|
|
Mississippi
|
27.1
|
23.6--30.9
|
31.4
|
28.2--34.9
|
29.2
|
26.4--32.1
|
|
12.5
|
10.1--15.3
|
16.6
|
14.0--19.7
|
14.7
|
12.4--17.2
|
|
Missouri
|
29.0
|
24.9--33.4
|
26.7
|
23.6--29.9
|
27.8
|
25.5--30.3
|
|
12.2
|
9.6--15.3
|
16.3
|
13.6--19.3
|
14.3
|
12.4--16.5
|
|
Montana
|
27.1
|
23.5--31.0
|
27.6
|
23.9--31.6
|
27.4
|
24.6--30.3
|
|
12.0
|
9.5--15.0
|
14.0
|
11.0--17.6
|
13.1
|
10.8--15.8
|
|
Nevada
|
26.3
|
23.3--29.6
|
29.8
|
26.7--33.0
|
28.0
|
25.9--30.3
|
|
7.5
|
6.1--9.3
|
12.0
|
9.5--14.9
|
9.8
|
8.3--11.4
|
|
New Hampshire
|
---
|
---
|
---
|
---
|
---
|
---
|
|
---
|
---
|
---
|
---
|
---
|
---
|
|
New Jersey
|
33.2
|
28.3--38.5
|
34.2
|
29.8--39.0
|
33.7
|
30.5--37.1
|
|
12.1
|
10.1--14.4
|
12.3
|
9.2--16.3
|
12.2
|
9.8--15.0
|
|
New Mexico
|
23.2
|
20.1--26.7
|
30.5
|
27.4--33.7
|
26.9
|
23.9--30.1
|
|
13.1
|
10.6--16.1
|
20.1
|
16.4--24.4
|
16.7
|
13.8--20.0
|
|
New York
|
31.5
|
29.5--33.6
|
36.1
|
32.6--39.7
|
33.9
|
31.6--36.3
|
|
---
|
---
|
---
|
---
|
---
|
---
|
|
North Carolina
|
28.3
|
25.7--30.9
|
27.0
|
23.0--31.5
|
27.6
|
24.9--30.6
|
|
9.3
|
7.7--11.2
|
8.9
|
7.2--11.1
|
9.1
|
7.8--10.7
|
|
North Dakota
|
21.2
|
18.4--24.3
|
25.8
|
23.0--28.9
|
23.5
|
21.6--25.5
|
|
6.5
|
4.8--8.7
|
9.4
|
7.6--11.5
|
8.0
|
6.7--9.6
|
|
Oklahoma
|
20.7
|
16.8--25.1
|
27.0
|
21.7--33.1
|
24.0
|
19.9--28.7
|
|
6.5
|
4.3--9.6
|
13.5
|
10.4--17.2
|
10.1
|
8.2--12.3
|
|
Pennsylvania
|
29.5
|
26.2--33.0
|
32.8
|
28.4--37.6
|
31.2
|
28.2--34.3
|
|
14.4
|
11.2--18.2
|
13.0
|
10.7--15.7
|
13.7
|
11.7--15.9
|
|
Rhode Island
|
33.5
|
29.5--37.8
|
36.3
|
33.0--39.6
|
34.9
|
31.7--38.3
|
|
12.1
|
9.7--15.1
|
13.6
|
11.2--16.5
|
12.9
|
10.8--15.3
|
|
South Carolina
|
27.1
|
23.0--31.6
|
23.4
|
18.2--29.5
|
25.2
|
21.6--29.3
|
|
7.8
|
5.2--11.4
|
9.7
|
7.6--12.2
|
8.8
|
7.5--10.3
|
|
South Dakota
|
24.1
|
19.0--30.2
|
28.0
|
23.3--33.1
|
26.0
|
21.5--31.1
|
|
9.6
|
6.6--13.9
|
12.9
|
10.6--15.6
|
11.3
|
9.1--14.0
|
|
Tennessee
|
26.2
|
23.7--28.8
|
28.5
|
24.9--32.5
|
27.4
|
24.9--30.1
|
|
9.6
|
7.6--12.0
|
14.3
|
12.3--16.6
|
12.1
|
10.9--13.4
|
|
Texas
|
28.8
|
26.3--31.3
|
36.0
|
32.6--39.6
|
32.5
|
29.7--35.3
|
|
13.6
|
11.5--16.0
|
14.9
|
13.1--16.9
|
14.3
|
12.9--15.8
|
|
Utah
|
30.8
|
25.9--36.1
|
31.1
|
27.6--34.8
|
31.0
|
27.6--34.6
|
|
10.6
|
7.6--14.7
|
12.4
|
10.5--14.5
|
11.6
|
9.6--13.8
|
|
Vermont
|
33.6
|
31.1--36.2
|
33.8
|
31.6--36.1
|
33.8
|
31.7--35.9
|
|
14.7
|
12.6--17.2
|
15.5
|
13.7--17.5
|
15.1
|
13.4--17.1
|
|
West Virginia
|
28.7
|
25.5--32.1
|
27.5
|
24.3--31.0
|
28.1
|
25.5--30.9
|
|
13.9
|
11.5--16.8
|
14.9
|
12.5--17.7
|
14.5
|
12.8--16.4
|
|
Wisconsin
|
32.2
|
29.6--34.8
|
31.4
|
28.4--34.6
|
31.8
|
29.6--34.1
|
|
10.8
|
8.4--13.7
|
12.3
|
10.4--14.4
|
11.6
|
9.9--13.6
|
|
Wyoming
|
26.4
|
24.0--28.9
|
27.2
|
25.0--29.5
|
26.8
|
25.2--28.5
|
|
14.5
|
12.8--16.4
|
17.3
|
15.3--19.4
|
16.0
|
14.7--17.3
|
|
Median
|
28.3
|
30.0
|
28.4
|
|
11.5
|
13.5
|
12.4
|
|
Range
|
20.7--35.9
|
20.9--37.3
|
21.3--36.0
|
|
6.5--14.7
|
8.9--20.1
|
8.0--16.7
|
|
Local surveys
|
|
|
|
|
|
|
|
|
|
|
|
|
|
|
Boston, MA
|
32.1
|
28.6--35.9
|
32.8
|
29.0--36.8
|
32.3
|
29.6--35.1
|
|
12.0
|
9.8--14.5
|
9.5
|
7.0--12.7
|
10.7
|
8.9--12.7
|
|
Broward County, FL
|
35.3
|
31.4--39.5
|
38.3
|
34.6--42.2
|
36.7
|
33.8--39.7
|
|
14.7
|
11.9--17.9
|
14.8
|
11.9--18.3
|
14.8
|
12.7--17.1
|
|
Charlotte-Mecklenburg, NC
|
---
|
---
|
---
|
---
|
---
|
---
|
|
---
|
---
|
---
|
---
|
---
|
---
|
|
Chicago, IL
|
29.3
|
24.8--34.2
|
36.8
|
32.7--41.2
|
33.2
|
30.2--36.3
|
|
11.1
|
8.2--14.9
|
15.0
|
11.9--18.7
|
13.4
|
11.0--16.1
|
|
Clark County, NV
|
25.1
|
21.5--29.2
|
31.0
|
27.3--34.9
|
28.1
|
25.5--30.8
|
|
6.5
|
5.0--8.5
|
12.3
|
9.5--15.8
|
9.5
|
7.7--11.6
|
|
Dallas, TX
|
28.4
|
24.1--33.0
|
32.9
|
27.0--39.4
|
30.5
|
26.3--35.0
|
|
9.2
|
6.8--12.2
|
9.5
|
6.8--13.2
|
9.3
|
7.4--11.8
|
|
Detroit, MI
|
30.9
|
26.6--35.5
|
34.6
|
28.7--41.1
|
32.9
|
28.5--37.6
|
|
9.9
|
8.1--12.1
|
10.9
|
8.0--14.6
|
10.4
|
8.4--12.8
|
|
Duval County, FL
|
27.6
|
24.7--30.7
|
26.3
|
23.4--29.5
|
26.9
|
24.8--29.2
|
|
9.5
|
7.8--11.5
|
14.1
|
12.1--16.5
|
12.0
|
10.5--13.6
|
|
Los Angeles, CA
|
34.8
|
30.9--38.9
|
35.0
|
29.4--41.1
|
34.8
|
31.1--38.8
|
|
9.6
|
6.2--14.7
|
12.5
|
10.3--15.0
|
11.1
|
8.9--13.6
|
|
Memphis, TN
|
33.9
|
29.8--38.2
|
38.7
|
34.5--43.1
|
36.4
|
33.5--39.4
|
|
12.3
|
9.8--15.3
|
17.5
|
14.0--21.6
|
14.9
|
12.8--17.2
|
|
Miami-Dade County, FL
|
31.8
|
29.1--34.7
|
37.5
|
34.5--40.7
|
34.5
|
32.3--36.8
|
|
13.6
|
11.0--16.6
|
17.7
|
15.2--20.6
|
15.6
|
13.6--17.8
|
|
Milwaukee, WI
|
30.0
|
27.2--32.9
|
35.8
|
32.3--39.4
|
32.9
|
30.7--35.2
|
|
---
|
---
|
---
|
---
|
---
|
---
|
|
New York City, NY
|
32.0
|
30.6--33.5
|
37.7
|
36.0--39.5
|
34.6
|
33.3--35.9
|
|
---
|
---
|
---
|
---
|
---
|
---
|
|
Orange County, FL
|
31.5
|
27.0--36.4
|
38.6
|
35.0--42.3
|
35.1
|
32.0--38.3
|
|
12.7
|
9.9--16.3
|
17.0
|
14.0--20.6
|
14.9
|
12.7--17.3
|
|
Palm Beach County, FL
|
33.1
|
29.9--36.5
|
36.8
|
33.4--40.4
|
34.9
|
32.6--37.3
|
|
14.1
|
11.9--16.7
|
17.5
|
15.0--20.3
|
15.8
|
14.0--17.7
|
|
Philadelphia, PA
|
22.9
|
19.6--26.7
|
26.4
|
22.8--30.3
|
24.7
|
22.0--27.6
|
|
10.6
|
8.3--13.3
|
12.0
|
9.3--15.3
|
11.2
|
9.1--13.8
|
|
San Bernardino, CA
|
38.1
|
34.2--42.1
|
40.5
|
35.5--45.7
|
39.3
|
35.8--42.8
|
|
14.5
|
11.9--17.7
|
18.8
|
15.3--23.0
|
16.7
|
14.3--19.4
|
|
San Diego, CA
|
35.0
|
31.1--39.2
|
34.4
|
31.0--38.1
|
34.7
|
31.9--37.6
|
|
13.1
|
11.1--15.3
|
14.2
|
11.7--17.1
|
13.6
|
12.1--15.2
|
|
San Francisco, CA
|
32.6
|
29.6--35.8
|
31.3
|
28.3--34.5
|
32.1
|
29.8--34.6
|
|
15.4
|
12.9--18.2
|
18.3
|
15.8--21.0
|
16.9
|
15.1--18.9
|
|
Seattle, WA
|
32.7
|
29.2--36.4
|
34.2
|
30.6--38.0
|
33.5
|
31.0--36.0
|
|
15.9
|
13.3--18.9
|
15.6
|
12.8--18.9
|
15.9
|
14.1--17.8
|
|
Median
|
32.0
|
35.0
|
33.5
|
|
12.3
|
14.8
|
13.6
|
|
Range
|
22.9--38.1
|
26.3--40.5
|
24.7--39.3
|
|
6.5--15.9
|
9.5--18.8
|
9.3--16.9
|
|
|
Ate fruits and vegetables five or more times/day
|
|
Drank three or more glasses/day of milk
|
|
|
Female
|
Male
|
Total
|
|
Female
|
Male
|
Total
|
|
Category
|
%
|
CI§
|
%
|
CI
|
%
|
CI
|
|
%
|
CI
|
%
|
CI
|
%
|
CI
|
|
Race/Ethnicity
|
|
|
|
|
|
|
|
|
|
|
|
|
|
|
White¶
|
19.6
|
17.1--22.2
|
21.3
|
19.0--23.9
|
20.5
|
18.6--22.6
|
|
10.4
|
8.4--12.8
|
22.7
|
18.8--27.0
|
17.0
|
14.1--20.4
|
|
Black¶
|
25.2
|
22.2--28.5
|
28.0
|
24.9--31.3
|
26.6
|
24.3--29.1
|
|
4.4
|
3.4--5.7
|
13.9
|
11.3--16.9
|
9.1
|
7.7--10.8
|
|
Hispanic
|
18.6
|
16.4--21.1
|
25.3
|
22.3--28.5
|
22.0
|
19.9--24.2
|
|
7.2
|
5.9--8.8
|
15.9
|
14.2--17.8
|
11.6
|
10.6--12.8
|
|
Grade
|
|
|
|
|
|
|
|
|
|
|
|
|
|
|
9
|
21.1
|
18.8--23.7
|
24.6
|
22.1--27.2
|
23.0
|
21.4--24.8
|
|
10.3
|
8.1--13.0
|
20.1
|
17.5--23.1
|
15.6
|
13.4--18.1
|
|
10
|
19.7
|
17.3--22.4
|
25.2
|
23.2--27.3
|
22.6
|
21.1--24.2
|
|
9.7
|
7.8--12.1
|
23.3
|
18.8--28.4
|
16.9
|
13.9--20.3
|
|
11
|
21.4
|
18.4--24.8
|
23.1
|
20.6--25.9
|
22.3
|
20.2--24.6
|
|
6.7
|
5.4--8.2
|
17.5
|
13.9--21.8
|
12.2
|
10.0--14.8
|
|
12
|
19.6
|
17.0--22.4
|
21.9
|
19.0--25.1
|
20.8
|
19.1--22.6
|
|
7.9
|
6.0--10.2
|
17.9
|
15.3--20.9
|
13.0
|
11.0--15.2
|
|
Total
|
20.5
|
18.8--22.2
|
23.9
|
22.4--25.4
|
22.3
|
21.1--23.7
|
|
8.7
|
7.4--10.3
|
19.8
|
16.9--23.1
|
14.5
|
12.4--16.9
|
|
|
Ate fruits and vegetables five or more times/day
|
|
Drank three or more glasses/day of milk
|
|
|
Female
|
Male
|
Total
|
|
Female
|
Male
|
Total
|
|
Site
|
%
|
CI§
|
%
|
CI
|
%
|
CI
|
|
%
|
CI
|
%
|
CI
|
%
|
CI
|
|
State surveys
|
|
|
|
|
|
|
|
|
|
|
|
|
|
|
Alabama
|
15.9
|
12.8--19.6
|
16.6
|
12.9--21.1
|
16.3
|
13.5--19.7
|
|
5.4
|
4.0--7.2
|
9.6
|
7.4--12.5
|
7.5
|
6.0--9.3
|
|
Alaska
|
15.9
|
13.3--18.8
|
18.5
|
14.9--22.8
|
17.2
|
15.1--19.5
|
|
7.4
|
5.8--9.5
|
15.8
|
12.8--19.3
|
11.7
|
9.8--13.9
|
|
Arizona
|
---¶
|
---
|
---
|
---
|
---
|
---
|
|
8.4
|
6.3--11.2
|
18.9
|
15.8--22.5
|
13.7
|
11.5--16.2
|
|
Arkansas
|
13.3
|
10.3--17.0
|
16.6
|
14.0--19.5
|
14.9
|
12.5--17.7
|
|
5.7
|
3.7--8.6
|
11.4
|
9.1--14.3
|
8.5
|
6.9--10.4
|
|
Colorado
|
21.9
|
19.2--24.8
|
26.9
|
23.0--31.3
|
24.4
|
22.4--26.6
|
|
9.9
|
8.0--12.2
|
25.1
|
21.1--29.7
|
17.6
|
15.2--20.3
|
|
Connecticut
|
19.3
|
16.0--23.0
|
22.5
|
19.7--25.6
|
21.0
|
18.6--23.5
|
|
---
|
---
|
---
|
---
|
---
|
---
|
|
Delaware
|
---
|
---
|
---
|
---
|
---
|
---
|
|
5.9
|
4.7--7.5
|
14.8
|
12.8--17.0
|
10.3
|
9.1--11.7
|
|
Florida
|
17.9
|
16.5--19.5
|
25.3
|
23.5--27.2
|
21.6
|
20.3--22.9
|
|
7.0
|
5.9--8.3
|
15.6
|
14.2--17.2
|
11.2
|
10.3--12.2
|
|
Georgia
|
14.1
|
11.3--17.5
|
20.2
|
17.6--23.2
|
17.1
|
15.0--19.5
|
|
4.2
|
2.7--6.5
|
12.1
|
9.7--15.1
|
8.2
|
6.3--10.5
|
|
Hawaii
|
13.2
|
10.0--17.3
|
20.8
|
17.2--24.9
|
17.2
|
15.5--19.0
|
|
3.3
|
2.2--4.9
|
10.7
|
7.8--14.4
|
7.2
|
5.5--9.3
|
|
Idaho
|
16.8
|
14.5--19.2
|
20.1
|
17.5--23.1
|
18.5
|
16.6--20.5
|
|
13.8
|
11.5--16.5
|
25.7
|
23.2--28.5
|
20.0
|
18.3--21.8
|
|
Illinois
|
18.8
|
16.7--21.0
|
17.8
|
14.7--21.5
|
18.3
|
16.3--20.6
|
|
8.9
|
7.2--11.1
|
17.1
|
14.5--20.0
|
13.1
|
11.3--15.2
|
|
Indiana
|
14.8
|
11.8--18.3
|
17.5
|
14.5--20.9
|
16.1
|
14.0--18.5
|
|
10.2
|
8.2--12.7
|
18.2
|
14.9--22.1
|
14.2
|
12.1--16.7
|
|
Kansas
|
17.8
|
15.2--20.6
|
23.0
|
19.6--26.9
|
20.5
|
18.3--22.9
|
|
10.2
|
8.6--12.0
|
21.2
|
18.5--24.2
|
15.8
|
14.2--17.5
|
|
Kentucky
|
14.0
|
11.8--16.4
|
14.5
|
12.1--17.2
|
14.2
|
12.6--16.0
|
|
8.4
|
6.0--11.5
|
14.7
|
12.3--17.5
|
11.6
|
9.7--13.8
|
|
Louisiana
|
13.8
|
9.6--19.5
|
13.9
|
11.8--16.3
|
13.9
|
11.2--17.1
|
|
6.0
|
4.4--8.3
|
12.7
|
9.2--17.3
|
9.2
|
7.0--12.0
|
|
Maine
|
---
|
---
|
---
|
---
|
---
|
---
|
|
12.5
|
11.5--13.6
|
19.8
|
18.6--21.2
|
16.2
|
15.3--17.1
|
|
Maryland
|
21.8
|
18.0--26.2
|
23.2
|
19.4--27.5
|
22.5
|
19.2--26.2
|
|
6.9
|
5.2--9.1
|
12.3
|
9.4--16.1
|
9.7
|
7.7--12.1
|
|
Massachusetts
|
---
|
---
|
---
|
---
|
---
|
---
|
|
9.0
|
7.5--10.7
|
17.7
|
15.0--20.7
|
13.4
|
11.7--15.2
|
|
Michigan
|
18.9
|
14.9--23.8
|
20.0
|
17.0--23.5
|
19.6
|
16.3--23.3
|
|
10.7
|
8.6--13.1
|
15.9
|
12.8--19.5
|
13.3
|
11.0--15.9
|
|
Mississippi
|
18.4
|
15.8--21.4
|
23.9
|
20.8--27.3
|
21.2
|
18.6--24.1
|
|
4.9
|
3.5--6.8
|
13.3
|
10.7--16.5
|
9.1
|
7.5--11.1
|
|
Missouri
|
19.0
|
16.0--22.4
|
21.6
|
18.2--25.5
|
20.4
|
18.0--22.9
|
|
11.3
|
9.1--13.8
|
20.2
|
16.9--24.0
|
15.8
|
13.7--18.2
|
|
Montana
|
17.5
|
13.7--22.1
|
19.0
|
15.5--23.1
|
18.4
|
15.7--21.4
|
|
12.7
|
10.3--15.6
|
24.5
|
21.0--28.3
|
18.8
|
16.4--21.4
|
|
Nevada
|
13.0
|
10.8--15.7
|
21.0
|
17.8--24.6
|
17.0
|
15.0--19.4
|
|
7.0
|
5.5--8.9
|
17.9
|
14.7--21.6
|
12.6
|
10.9--14.4
|
|
New Hampshire
|
---
|
---
|
---
|
---
|
---
|
---
|
|
14.2
|
11.4--17.5
|
27.9
|
23.7--32.6
|
21.3
|
18.7--24.1
|
|
New Jersey
|
20.8
|
17.2--24.9
|
19.3
|
15.3--24.1
|
20.1
|
17.4--23.1
|
|
5.9
|
4.3--8.0
|
12.5
|
10.0--15.4
|
9.2
|
7.8--10.9
|
|
New Mexico
|
16.2
|
13.0--20.1
|
25.3
|
22.5--28.4
|
20.9
|
18.0--24.1
|
|
8.5
|
7.4--9.8
|
17.1
|
15.5--18.7
|
12.8
|
12.1--13.5
|
|
New York
|
---
|
---
|
---
|
---
|
---
|
---
|
|
---
|
---
|
---
|
---
|
---
|
---
|
|
North Carolina
|
15.5
|
13.4--17.9
|
18.3
|
16.0--20.9
|
16.9
|
15.2--18.7
|
|
---
|
---
|
---
|
---
|
---
|
---
|
|
North Dakota
|
11.7
|
9.3--14.5
|
15.5
|
13.4--17.9
|
13.7
|
12.0--15.5
|
|
18.6
|
16.0--21.5
|
25.9
|
23.1--28.9
|
22.4
|
20.2--24.7
|
|
Oklahoma
|
11.9
|
9.5--14.8
|
17.5
|
14.0--21.7
|
14.8
|
12.8--17.0
|
|
6.4
|
4.2--9.7
|
15.0
|
11.6--19.2
|
10.7
|
8.5--13.5
|
|
Pennsylvania
|
19.9
|
17.2--22.9
|
20.9
|
17.6--24.7
|
20.4
|
18.2--22.9
|
|
8.9
|
7.4--10.7
|
17.0
|
13.8--20.6
|
13.0
|
10.9--15.4
|
|
Rhode Island
|
21.3
|
17.8--25.3
|
24.0
|
20.9--27.4
|
22.6
|
19.7--25.8
|
|
8.6
|
6.7--11.1
|
16.9
|
14.3--19.9
|
13.1
|
11.2--15.1
|
|
South Carolina
|
14.0
|
10.6--18.3
|
15.4
|
10.9--21.4
|
14.7
|
12.2--17.7
|
|
5.9
|
3.6--9.5
|
10.1
|
6.4--15.4
|
8.0
|
5.8--11.0
|
|
South Dakota
|
12.2
|
8.8--16.6
|
17.2
|
13.8--21.1
|
14.7
|
12.0--17.9
|
|
15.9
|
13.5--18.6
|
32.1
|
27.2--37.3
|
24.1
|
21.0--27.4
|
|
Tennessee
|
16.1
|
13.6--18.9
|
19.9
|
17.1--23.0
|
18.1
|
16.1--20.2
|
|
6.2
|
5.1--7.6
|
15.9
|
14.2--17.8
|
11.2
|
10.1--12.4
|
|
Texas
|
18.8
|
17.2--20.5
|
23.7
|
21.3--26.3
|
21.3
|
19.7--23.0
|
|
7.1
|
6.0--8.4
|
18.9
|
17.0--20.8
|
13.1
|
12.0--14.3
|
|
Utah
|
18.0
|
13.5--23.6
|
19.0
|
16.4--21.8
|
18.4
|
15.5--21.7
|
|
11.6
|
9.2--14.6
|
22.1
|
18.0--26.8
|
17.0
|
14.4--20.0
|
|
Vermont
|
22.2
|
20.1--24.4
|
22.7
|
20.6--25.0
|
22.6
|
20.6--24.7
|
|
15.9
|
14.3--17.6
|
28.7
|
27.1--30.4
|
22.6
|
21.4--23.8
|
|
West Virginia
|
18.5
|
14.9--22.9
|
17.9
|
15.5--20.6
|
18.2
|
15.6--21.2
|
|
10.8
|
8.3--13.9
|
16.8
|
14.1--19.8
|
13.9
|
11.8--16.3
|
|
Wisconsin
|
18.6
|
15.7--21.9
|
19.5
|
17.3--21.9
|
19.1
|
17.2--21.2
|
|
16.0
|
13.9--18.4
|
25.8
|
23.3--28.4
|
21.0
|
19.3--22.7
|
|
Wyoming
|
18.2
|
16.3--20.3
|
19.8
|
17.6--22.2
|
19.1
|
17.6--20.7
|
|
12.0
|
10.4--13.8
|
20.0
|
17.5--22.7
|
16.1
|
14.7--17.7
|
|
Median
|
17.6
|
19.8
|
18.4
|
|
8.6
|
17.1
|
13.1
|
|
Range
|
11.7--22.2
|
13.9--26.9
|
13.7--24.4
|
|
3.3--18.6
|
9.6--32.1
|
7.2--24.1
|
|
Local surveys
|
|
|
|
|
|
|
|
|
|
|
|
|
|
|
Boston, MA
|
17.1
|
14.2--20.6
|
19.6
|
16.6--23.1
|
18.3
|
16.1--20.7
|
|
7.1
|
5.3--9.4
|
14.2
|
11.1--18.1
|
10.7
|
8.8--12.9
|
|
Broward County, FL
|
23.3
|
19.7--27.3
|
22.4
|
19.0--26.1
|
22.8
|
20.1--25.7
|
|
6.2
|
4.5--8.4
|
13.7
|
11.1--16.8
|
9.9
|
8.2--11.9
|
|
Charlotte-Mecklenburg, NC
|
---
|
---
|
---
|
---
|
---
|
---
|
|
---
|
---
|
---
|
---
|
---
|
---
|
|
Chicago, IL
|
20.0
|
15.9--25.0
|
24.7
|
20.8--29.0
|
22.6
|
19.2--26.3
|
|
7.0
|
5.3--9.1
|
11.5
|
9.0--14.6
|
9.4
|
7.9--11.2
|
|
Clark County, NV
|
11.8
|
9.3--14.8
|
23.1
|
19.1--27.6
|
17.5
|
15.1--20.2
|
|
5.9
|
4.3--8.0
|
18.2
|
15.0--21.9
|
12.2
|
10.4--14.2
|
|
Dallas, TX
|
16.0
|
12.5--20.1
|
20.3
|
15.1--26.6
|
18.0
|
14.3--22.5
|
|
4.4
|
2.9--6.7
|
12.7
|
9.3--17.0
|
8.5
|
6.6--10.8
|
|
Detroit, MI
|
20.6
|
17.4--24.2
|
25.8
|
19.8--32.9
|
23.4
|
19.2--28.1
|
|
6.5
|
4.6--9.1
|
8.3
|
6.0--11.3
|
7.4
|
5.9--9.1
|
|
Duval County, FL
|
17.1
|
14.6--20.0
|
19.2
|
16.6--22.0
|
18.2
|
16.3--20.3
|
|
4.3
|
3.2--5.7
|
8.7
|
7.0--10.9
|
6.7
|
5.7--7.7
|
|
Los Angeles, CA
|
17.2
|
13.1--22.2
|
21.8
|
18.9--25.1
|
19.5
|
16.6--22.9
|
|
6.7
|
4.8--9.2
|
12.0
|
10.0--14.3
|
9.4
|
8.0--10.9
|
|
Memphis, TN
|
21.0
|
18.2--24.1
|
26.8
|
22.6--31.6
|
23.9
|
21.1--27.0
|
|
4.7
|
3.1--7.0
|
13.8
|
10.2--18.4
|
9.2
|
7.3--11.6
|
|
Miami-Dade County, FL
|
21.6
|
18.9--24.6
|
28.5
|
25.4--31.8
|
24.9
|
22.7--27.3
|
|
7.2
|
5.5--9.5
|
17.1
|
14.7--19.7
|
12.2
|
10.6--14.0
|
|
Milwaukee, WI
|
---
|
---
|
---
|
---
|
---
|
---
|
|
8.3
|
6.9--9.8
|
15.3
|
12.4--18.8
|
11.8
|
10.2--13.5
|
|
New York City, NY
|
---
|
---
|
---
|
---
|
---
|
---
|
|
---
|
---
|
---
|
---
|
---
|
---
|
|
Orange County, FL
|
21.1
|
17.8--24.8
|
25.9
|
22.5--29.5
|
23.5
|
21.1--26.1
|
|
8.1
|
5.8--11.1
|
15.6
|
12.5--19.3
|
11.8
|
9.7--14.3
|
|
Palm Beach County, FL
|
21.9
|
19.3--24.6
|
26.4
|
23.2--30.0
|
24.1
|
22.2--26.3
|
|
6.0
|
4.5--7.8
|
14.2
|
11.9--16.8
|
10.1
|
8.7--11.8
|
|
Philadelphia, PA
|
15.9
|
12.9--19.3
|
19.6
|
15.5--24.3
|
17.7
|
14.6--21.3
|
|
4.0
|
2.8--5.7
|
11.1
|
8.7--14.0
|
7.4
|
6.2--8.9
|
|
San Bernardino, CA
|
23.6
|
19.9--27.8
|
28.5
|
24.4--33.0
|
26.1
|
23.0--29.4
|
|
8.6
|
6.7--11.0
|
18.0
|
15.1--21.5
|
13.4
|
11.5--15.4
|
|
San Diego, CA
|
22.5
|
19.0--26.5
|
24.6
|
21.3--28.2
|
23.6
|
21.3--25.9
|
|
7.6
|
5.8--9.9
|
13.2
|
10.8--16.0
|
10.4
|
9.0--12.0
|
|
San Francisco, CA
|
21.3
|
18.6--24.4
|
21.8
|
19.3--24.6
|
21.6
|
19.6--23.8
|
|
3.3
|
2.2--4.8
|
9.8
|
8.1--12.0
|
6.6
|
5.4--8.0
|
|
Seattle, WA
|
20.0
|
17.2--23.1
|
24.7
|
21.1--28.7
|
22.4
|
20.2--24.8
|
|
9.5
|
7.7--11.5
|
17.1
|
13.9--20.8
|
13.3
|
11.5--15.4
|
|
Median
|
20.6
|
24.6
|
22.6
|
|
6.6
|
13.7
|
10.0
|
|
Range
|
11.8--23.6
|
19.2--28.5
|
17.5--26.1
|
|
3.3--9.5
|
8.3--18.2
|
6.6--13.4
|
|
|
Female
|
Male
|
Total
|
|
Category
|
%
|
CI§
|
%
|
CI
|
%
|
CI
|
|
Race/Ethnicity
|
|
|
|
|
|
|
|
White¶
|
21.5
|
18.4--25.1
|
35.6
|
31.2--40.2
|
29.0
|
26.3--32.0
|
|
Black¶
|
32.3
|
27.1--38.1
|
35.0
|
30.9--39.3
|
33.7
|
30.1--37.6
|
|
Hispanic
|
24.0
|
21.9--26.2
|
32.2
|
29.3--35.4
|
28.1
|
26.1--30.2
|
|
Grade
|
|
|
|
|
|
|
|
9
|
24.6
|
21.7--27.7
|
35.6
|
32.7--38.7
|
30.5
|
28.4--32.7
|
|
10
|
23.2
|
20.4--26.3
|
34.6
|
29.6--40.1
|
29.2
|
26.3--32.2
|
|
11
|
21.3
|
18.8--24.1
|
35.2
|
32.2--38.4
|
28.5
|
26.1--30.9
|
|
12
|
23.8
|
20.4--27.6
|
32.7
|
29.3--36.3
|
28.3
|
25.5--31.4
|
|
Total
|
23.3
|
21.0--25.8
|
34.6
|
31.7--37.5
|
29.2
|
27.2--31.2
|
|
|
Female
|
Male
|
Total
|
|
Site
|
%
|
CI§
|
%
|
CI
|
%
|
CI
|
|
State surveys
|
|
|
|
|
|
|
|
Alabama
|
35.7
|
30.9--40.8
|
41.9
|
37.2--46.7
|
38.8
|
36.2--41.5
|
|
Alaska
|
19.8
|
16.3--23.8
|
20.4
|
17.3--23.9
|
20.1
|
17.7--22.8
|
|
Arizona
|
22.6
|
18.8--26.8
|
33.5
|
31.0--36.2
|
28.1
|
26.1--30.2
|
|
Arkansas
|
32.9
|
27.9--38.4
|
34.1
|
28.4--40.2
|
33.5
|
29.2--38.1
|
|
Colorado
|
20.2
|
16.2--24.9
|
29.0
|
24.0--34.5
|
24.6
|
20.6--29.2
|
|
Connecticut
|
---¶
|
---
|
---
|
---
|
---
|
---
|
|
Delaware
|
25.6
|
23.1--28.2
|
32.1
|
28.8--35.7
|
28.8
|
26.8--30.9
|
|
Florida
|
24.1
|
21.9--26.5
|
32.9
|
30.9--35.0
|
28.6
|
26.9--30.4
|
|
Georgia
|
27.1
|
23.9--30.5
|
32.3
|
28.2--36.7
|
29.7
|
27.0--32.5
|
|
Hawaii
|
14.9
|
11.7--18.9
|
26.2
|
22.1--30.8
|
20.8
|
17.8--24.1
|
|
Idaho
|
13.9
|
11.5--16.6
|
22.3
|
20.0--24.9
|
18.3
|
16.7--20.1
|
|
Illinois
|
26.8
|
22.2--31.9
|
35.3
|
31.3--39.5
|
31.1
|
27.4--35.2
|
|
Indiana
|
26.4
|
23.5--29.4
|
32.9
|
29.4--36.8
|
29.7
|
27.8--31.6
|
|
Kansas
|
24.9
|
21.8--28.3
|
36.4
|
32.0--41.0
|
30.7
|
27.7--33.9
|
|
Kentucky
|
31.6
|
28.1--35.3
|
39.7
|
35.0--44.5
|
35.7
|
32.3--39.3
|
|
Louisiana
|
35.8
|
29.5--42.7
|
37.4
|
31.8--43.4
|
36.6
|
31.5--42.0
|
|
Maine
|
---
|
---
|
---
|
---
|
---
|
---
|
|
Maryland
|
18.8
|
16.0--21.9
|
23.8
|
20.8--27.2
|
21.3
|
19.7--23.0
|
|
Massachusetts
|
15.8
|
13.3--18.5
|
25.9
|
23.2--28.8
|
21.0
|
18.7--23.4
|
|
Michigan
|
22.6
|
19.3--26.2
|
32.4
|
29.9--35.1
|
27.6
|
25.0--30.4
|
|
Mississippi
|
38.1
|
33.9--42.5
|
42.2
|
38.2--46.3
|
40.2
|
36.8--43.7
|
|
Missouri
|
23.9
|
20.0--28.4
|
38.8
|
33.1--44.8
|
31.5
|
27.7--35.6
|
|
Montana
|
17.2
|
14.8--19.8
|
33.5
|
29.8--37.5
|
25.7
|
23.1--28.4
|
|
Nevada
|
17.6
|
15.1--20.5
|
26.4
|
23.3--29.7
|
22.1
|
19.8--24.5
|
|
New Hampshire
|
14.5
|
11.1--18.6
|
29.6
|
26.2--33.3
|
22.1
|
19.8--24.7
|
|
New Jersey
|
15.6
|
12.2--19.7
|
24.2
|
20.2--28.8
|
19.9
|
16.6--23.6
|
|
New Mexico
|
25.3
|
22.5--28.3
|
35.5
|
31.9--39.2
|
30.4
|
27.7--33.1
|
|
New York
|
19.1
|
16.4--22.0
|
30.1
|
27.5--32.8
|
24.5
|
22.7--26.4
|
|
North Carolina
|
28.8
|
25.8--32.0
|
36.4
|
32.7--40.3
|
32.5
|
29.7--35.5
|
|
North Dakota
|
19.5
|
16.3--23.2
|
32.9
|
29.2--36.9
|
26.3
|
23.6--29.3
|
|
Oklahoma
|
34.9
|
29.6--40.6
|
41.2
|
37.2--45.2
|
38.1
|
34.7--41.6
|
|
Pennsylvania
|
18.8
|
15.5--22.6
|
32.2
|
29.0--35.5
|
25.7
|
23.1--28.4
|
|
Rhode Island
|
16.9
|
13.5--20.9
|
25.1
|
22.1--28.4
|
21.2
|
19.1--23.4
|
|
South Carolina
|
31.2
|
25.9--37.1
|
35.4
|
30.2--41.0
|
33.2
|
29.5--37.2
|
|
South Dakota
|
21.0
|
17.7--24.6
|
36.5
|
31.7--41.5
|
28.8
|
25.5--32.5
|
|
Tennessee
|
39.5
|
36.0--43.1
|
42.8
|
39.0--46.7
|
41.3
|
38.6--44.1
|
|
Texas
|
28.3
|
25.4--31.3
|
37.2
|
33.9--40.6
|
32.8
|
30.5--35.1
|
|
Utah
|
9.2
|
7.4--11.4
|
19.3
|
15.6--23.8
|
14.5
|
12.3--17.0
|
|
Vermont
|
15.0
|
13.6--16.5
|
29.6
|
27.5--31.9
|
22.9
|
21.1--24.7
|
|
West Virginia
|
33.3
|
28.2--38.8
|
35.7
|
31.6--40.1
|
34.5
|
30.5--38.7
|
|
Wisconsin
|
17.1
|
14.7--19.8
|
28.9
|
25.5--32.4
|
23.1
|
20.6--25.8
|
|
Wyoming
|
20.3
|
18.2--22.5
|
33.3
|
30.9--35.8
|
27.0
|
25.3--28.8
|
|
Median
|
22.6
|
32.9
|
28.3
|
|
Range
|
9.2--39.5
|
19.3--42.8
|
14.5--41.3
|
|
Local surveys
|
|
|
|
|
|
|
|
Boston, MA
|
26.9
|
23.6--30.5
|
29.4
|
25.7--33.3
|
28.1
|
25.4--31.0
|
|
Broward County, FL
|
23.2
|
19.8--27.0
|
30.0
|
26.9--33.3
|
26.6
|
23.9--29.3
|
|
Charlotte-Mecklenburg, NC
|
---
|
---
|
---
|
---
|
---
|
---
|
|
Chicago, IL
|
27.8
|
22.8--33.4
|
28.0
|
21.5--35.7
|
27.9
|
23.0--33.4
|
|
Clark County, NV
|
17.4
|
14.3--21.1
|
26.3
|
22.5--30.5
|
22.0
|
19.1--25.1
|
|
Dallas, TX
|
28.4
|
24.2--33.1
|
32.8
|
29.0--36.9
|
30.5
|
27.3--33.9
|
|
Detroit, MI
|
27.1
|
23.5--31.0
|
30.5
|
26.1--35.3
|
29.0
|
25.6--32.5
|
|
Duval County, FL
|
28.8
|
25.9--31.9
|
30.5
|
27.7--33.5
|
29.6
|
27.4--31.9
|
|
Los Angeles, CA
|
20.8
|
17.1--25.0
|
22.8
|
18.5--27.7
|
21.7
|
18.3--25.6
|
|
Memphis, TN
|
36.8
|
33.0--40.8
|
41.2
|
36.3--46.2
|
39.2
|
35.8--42.6
|
|
Miami-Dade County, FL
|
23.9
|
20.8--27.4
|
29.7
|
26.4--33.3
|
26.8
|
24.2--29.5
|
|
Milwaukee, WI
|
25.7
|
22.8--28.9
|
30.0
|
26.9--33.4
|
27.8
|
25.6--30.2
|
|
New York City, NY
|
21.2
|
18.9--23.6
|
23.3
|
21.6--25.1
|
22.2
|
20.4--24.0
|
|
Orange County, FL
|
23.7
|
19.8--28.2
|
34.1
|
30.6--37.9
|
28.9
|
25.8--32.1
|
|
Palm Beach County, FL
|
21.9
|
19.1--24.9
|
32.7
|
28.9--36.7
|
27.3
|
24.8--30.0
|
|
Philadelphia, PA
|
26.8
|
23.1--30.8
|
29.1
|
23.7--35.1
|
28.0
|
24.3--31.9
|
|
San Bernardino, CA
|
25.1
|
21.1--29.6
|
33.1
|
28.8--37.7
|
29.2
|
25.9--32.7
|
|
San Diego, CA
|
13.7
|
11.1--16.9
|
22.3
|
19.0--26.0
|
18.2
|
15.8--20.8
|
|
San Francisco, CA
|
11.7
|
9.2--14.6
|
19.1
|
16.6--21.8
|
15.5
|
13.7--17.5
|
|
Seattle, WA
|
10.5
|
8.4--13.2
|
20.3
|
17.2--23.8
|
15.6
|
13.5--18.0
|
|
Median
|
23.9
|
29.7
|
27.8
|
|
Range
|
10.5--36.8
|
19.1--41.2
|
15.5--39.2
|
|
|
Physically active at least 60 minutes/day on all 7 days†
|
|
Physically active at least 60 minutes/day on 5 or more days†
|
|
|
Female
|
Male
|
Total
|
|
Female
|
Male
|
Total
|
|
Category
|
%
|
CI§
|
%
|
CI
|
%
|
CI
|
|
%
|
CI
|
%
|
CI
|
%
|
CI
|
|
Race/Ethnicity
|
|
|
|
|
|
|
|
|
|
|
|
|
|
|
White¶
|
12.4
|
10.6--14.5
|
26.2
|
24.1--28.3
|
19.7
|
18.4--21.2
|
|
31.3
|
28.6--34.0
|
47.3
|
44.4--50.2
|
39.9
|
37.6--42.1
|
|
Black¶
|
10.0
|
7.6--13.0
|
24.4
|
21.5--27.6
|
17.2
|
15.3--19.4
|
|
21.9
|
18.9--25.1
|
43.3
|
38.8--48.0
|
32.6
|
29.6--35.7
|
|
Hispanic
|
10.5
|
8.7--12.6
|
20.7
|
18.5--23.1
|
15.6
|
14.2--17.0
|
|
24.9
|
22.0--28.1
|
41.3
|
37.9--44.9
|
33.1
|
30.6--35.7
|
|
Grade
|
|
|
|
|
|
|
|
|
|
|
|
|
|
|
9
|
13.6
|
11.8--15.8
|
28.0
|
25.5--30.6
|
21.3
|
19.6--23.2
|
|
30.8
|
28.1--33.7
|
47.5
|
44.7--50.3
|
39.7
|
37.4--42.1
|
|
10
|
12.7
|
10.4--15.3
|
25.3
|
21.5--29.5
|
19.3
|
17.2--21.5
|
|
30.5
|
26.9--34.3
|
47.4
|
44.1--50.7
|
39.3
|
36.8--41.9
|
|
11
|
10.3
|
8.4--12.7
|
23.3
|
21.0--25.8
|
17.0
|
15.4--18.6
|
|
26.0
|
22.8--29.5
|
46.2
|
42.7--49.8
|
36.4
|
33.5--39.3
|
|
12
|
8.6
|
7.0--10.4
|
21.9
|
19.3--24.7
|
15.3
|
13.6--17.1
|
|
22.4
|
19.3--25.8
|
40.4
|
37.1--43.8
|
31.6
|
29.0--34.2
|
|
Total
|
11.4
|
10.1--12.9
|
24.8
|
23.4--26.3
|
18.4
|
17.3--19.5
|
|
27.7
|
25.6--29.9
|
45.6
|
43.6--47.6
|
37.0
|
35.2--38.8
|
|
|
Physically active at least 60 minutes/day on all 7 days†
|
|
Physically active at least 60 minutes/day on 5 or more days†
|
|
|
Female
|
Male
|
Total
|
|
Female
|
Male
|
Total
|
|
Site
|
%
|
CI§
|
%
|
CI
|
%
|
CI
|
|
%
|
CI
|
%
|
CI
|
%
|
CI
|
|
State surveys
|
|
|
|
|
|
|
|
|
|
|
|
|
|
|
Alabama
|
13.4
|
11.0--16.2
|
25.1
|
20.9--29.8
|
19.4
|
16.9--22.1
|
|
28.7
|
23.6--34.5
|
45.7
|
39.5--52.0
|
37.3
|
32.5--42.3
|
|
Alaska
|
14.0
|
11.1--17.5
|
26.0
|
22.2--30.3
|
20.2
|
17.4--23.3
|
|
35.2
|
31.4--39.2
|
49.2
|
44.3--54.1
|
42.4
|
38.9--46.0
|
|
Arizona
|
18.1
|
15.2--21.3
|
33.1
|
29.0--37.5
|
25.7
|
23.0--28.5
|
|
38.1
|
34.8--41.5
|
55.5
|
51.5--59.5
|
46.8
|
44.1--49.5
|
|
Arkansas
|
18.2
|
15.4--21.3
|
30.6
|
26.7--34.8
|
24.3
|
22.0--26.8
|
|
33.7
|
28.2--39.8
|
50.4
|
44.4--56.3
|
42.0
|
37.6--46.4
|
|
Colorado
|
19.4
|
15.4--24.2
|
34.1
|
29.7--38.8
|
26.9
|
23.9--30.2
|
|
38.4
|
32.3--44.9
|
55.1
|
50.5--59.7
|
47.0
|
42.6--51.4
|
|
Connecticut
|
14.6
|
12.7--16.9
|
34.6
|
31.4--37.9
|
24.6
|
22.3--27.1
|
|
34.2
|
31.3--37.3
|
56.1
|
52.0--60.2
|
45.2
|
42.4--48.0
|
|
Delaware
|
13.9
|
11.6--16.5
|
33.7
|
30.6--36.9
|
23.8
|
21.9--25.8
|
|
29.1
|
26.0--32.5
|
51.7
|
48.8--54.6
|
40.4
|
38.1--42.7
|
|
Florida
|
13.8
|
12.7--15.1
|
35.7
|
33.7--37.7
|
24.7
|
23.5--26.0
|
|
28.0
|
26.2--29.9
|
53.8
|
51.2--56.3
|
40.8
|
39.1--42.4
|
|
Georgia
|
14.3
|
11.0--18.3
|
33.0
|
27.8--38.7
|
23.7
|
21.0--26.6
|
|
31.5
|
27.2--36.1
|
54.1
|
47.9--60.2
|
42.8
|
39.1--46.5
|
|
Hawaii
|
11.0
|
6.5--18.2
|
24.7
|
19.2--31.2
|
18.1
|
14.1--22.8
|
|
24.9
|
20.2--30.3
|
43.2
|
37.1--49.6
|
34.4
|
29.8--39.3
|
|
Idaho
|
16.5
|
14.6--18.7
|
38.0
|
34.3--41.8
|
27.6
|
25.3--30.1
|
|
43.0
|
39.6--46.5
|
63.6
|
60.3--66.9
|
53.6
|
50.9--56.3
|
|
Illinois
|
16.2
|
14.0--18.7
|
31.8
|
27.6--36.3
|
24.1
|
21.1--27.4
|
|
37.4
|
33.8--41.1
|
52.0
|
46.1--57.7
|
44.7
|
40.6--48.9
|
|
Indiana
|
14.3
|
12.4--16.5
|
32.3
|
28.4--36.4
|
23.4
|
21.0--26.0
|
|
28.5
|
25.2--32.1
|
52.4
|
48.1--56.6
|
40.6
|
37.7--43.6
|
|
Kansas
|
17.7
|
15.1--20.7
|
37.4
|
34.1--40.8
|
27.8
|
25.5--30.2
|
|
39.0
|
36.0--42.1
|
58.4
|
54.9--61.9
|
48.9
|
46.4--51.4
|
|
Kentucky
|
12.1
|
10.3--14.2
|
30.4
|
26.7--34.4
|
21.4
|
19.2--23.8
|
|
28.2
|
24.5--32.4
|
49.2
|
45.7--52.7
|
38.9
|
36.0--41.8
|
|
Louisiana
|
17.4
|
13.6--22.1
|
28.8
|
22.7--35.8
|
23.0
|
19.4--27.1
|
|
31.1
|
27.6--34.8
|
48.6
|
41.7--55.5
|
39.5
|
35.7--43.5
|
|
Maine
|
12.6
|
11.6--13.8
|
22.9
|
21.6--24.4
|
17.9
|
17.0--18.8
|
|
32.5
|
30.8--34.2
|
41.0
|
39.3--42.7
|
36.8
|
35.5--38.0
|
|
Maryland
|
14.4
|
10.8--19.0
|
27.0
|
23.3--31.0
|
20.8
|
17.9--24.0
|
|
31.6
|
24.5--39.6
|
46.0
|
39.6--52.5
|
38.8
|
33.6--44.2
|
|
Massachusetts
|
10.2
|
8.2--12.7
|
23.5
|
21.4--25.8
|
17.0
|
15.5--18.7
|
|
25.7
|
22.3--29.5
|
41.0
|
37.7--44.3
|
33.5
|
30.9--36.3
|
|
Michigan
|
18.4
|
16.1--21.0
|
32.3
|
29.5--35.1
|
25.3
|
23.2--27.5
|
|
40.1
|
36.0--44.3
|
53.7
|
49.3--58.1
|
46.8
|
43.0--50.6
|
|
Mississippi
|
16.0
|
14.0--18.2
|
30.2
|
26.9--33.6
|
23.0
|
20.9--25.1
|
|
30.5
|
26.5--34.8
|
49.4
|
44.9--53.9
|
39.7
|
36.6--43.0
|
|
Missouri
|
16.5
|
13.9--19.3
|
36.6
|
32.9--40.4
|
26.7
|
24.3--29.3
|
|
38.2
|
33.8--42.9
|
58.0
|
54.1--61.8
|
48.3
|
45.1--51.5
|
|
Montana
|
14.4
|
11.8--17.6
|
27.5
|
23.7--31.5
|
21.1
|
18.4--24.1
|
|
39.4
|
33.8--45.2
|
52.4
|
47.2--57.6
|
46.0
|
42.2--49.9
|
|
Nevada
|
16.5
|
13.8--19.6
|
33.0
|
30.0--36.1
|
24.9
|
22.6--27.3
|
|
35.2
|
31.3--39.3
|
52.8
|
48.7--56.9
|
44.1
|
41.0--47.3
|
|
New Hampshire
|
14.9
|
12.3--17.8
|
31.4
|
27.5--35.6
|
23.3
|
20.7--26.2
|
|
37.1
|
31.9--42.7
|
52.9
|
48.3--57.5
|
45.3
|
41.1--49.5
|
|
New Jersey
|
15.3
|
12.2--19.0
|
27.4
|
23.9--31.2
|
21.3
|
19.0--23.9
|
|
36.2
|
32.7--39.7
|
46.9
|
43.0--50.8
|
41.5
|
38.8--44.2
|
|
New Mexico
|
17.5
|
14.6--20.8
|
29.4
|
26.6--32.2
|
23.4
|
21.0--26.1
|
|
38.7
|
33.7--43.9
|
53.0
|
49.7--56.3
|
45.8
|
42.0--49.7
|
|
New York
|
14.7
|
12.7--17.0
|
31.6
|
28.2--35.2
|
23.1
|
20.9--25.4
|
|
34.3
|
30.9--38.0
|
50.5
|
46.8--54.2
|
42.3
|
39.4--45.3
|
|
North Carolina
|
15.2
|
12.9--17.9
|
33.6
|
29.9--37.4
|
24.1
|
22.3--26.1
|
|
36.0
|
33.1--39.1
|
56.7
|
54.0--59.4
|
46.0
|
43.9--48.2
|
|
North Dakota
|
15.7
|
13.4--18.2
|
28.6
|
25.2--32.3
|
22.3
|
20.2--24.6
|
|
34.6
|
31.0--38.3
|
52.5
|
49.0--56.0
|
43.7
|
40.9--46.5
|
|
Oklahoma
|
16.7
|
13.7--20.0
|
37.9
|
33.4--42.6
|
27.5
|
24.3--30.8
|
|
34.4
|
30.2--38.9
|
59.7
|
55.8--63.4
|
47.4
|
43.8--51.0
|
|
Pennsylvania
|
20.0
|
17.2--23.3
|
34.9
|
31.7--38.2
|
27.7
|
25.2--30.4
|
|
36.4
|
31.6--41.6
|
54.9
|
51.2--58.6
|
45.9
|
42.1--49.9
|
|
Rhode Island
|
16.0
|
13.7--18.7
|
31.3
|
27.2--35.8
|
23.8
|
21.1--26.6
|
|
34.9
|
30.2--39.8
|
52.8
|
47.5--57.9
|
44.0
|
39.9--48.3
|
|
South Carolina
|
11.9
|
8.4--16.6
|
22.5
|
17.9--27.9
|
17.1
|
14.7--19.9
|
|
25.7
|
21.7--30.2
|
41.0
|
36.0--46.3
|
33.3
|
30.0--36.7
|
|
South Dakota
|
16.6
|
13.2--20.6
|
36.0
|
33.2--38.9
|
26.4
|
23.9--29.1
|
|
36.1
|
30.9--41.7
|
56.9
|
54.5--59.3
|
46.7
|
43.6--49.8
|
|
Tennessee
|
13.1
|
11.0--15.6
|
34.8
|
31.3--38.6
|
24.2
|
22.1--26.4
|
|
28.8
|
26.5--31.1
|
50.4
|
45.8--54.9
|
39.7
|
37.1--42.5
|
|
Texas
|
16.6
|
13.6--20.2
|
37.5
|
33.8--41.2
|
27.2
|
24.6--30.1
|
|
35.6
|
30.7--40.8
|
57.2
|
53.7--60.6
|
46.6
|
43.1--50.1
|
|
Utah
|
11.6
|
9.2--14.6
|
22.8
|
19.6--26.3
|
17.3
|
15.1--19.7
|
|
39.2
|
34.2--44.5
|
55.2
|
51.3--59.1
|
47.3
|
43.3--51.4
|
|
Vermont
|
16.4
|
13.8--19.4
|
30.5
|
28.0--33.1
|
23.7
|
21.3--26.3
|
|
38.1
|
33.7--42.7
|
51.5
|
49.0--53.9
|
44.9
|
41.7--48.2
|
|
West Virginia
|
17.0
|
14.4--20.1
|
27.9
|
24.5--31.7
|
22.6
|
20.2--25.0
|
|
35.0
|
31.5--38.7
|
48.3
|
44.5--52.2
|
41.8
|
38.8--44.8
|
|
Wisconsin
|
17.8
|
15.6--20.4
|
29.6
|
25.9--33.6
|
23.8
|
21.5--26.3
|
|
41.7
|
38.2--45.3
|
55.0
|
50.9--59.1
|
48.5
|
45.3--51.7
|
|
Wyoming
|
17.2
|
15.0--19.7
|
33.6
|
30.7--36.7
|
25.6
|
23.7--27.7
|
|
41.0
|
37.6--44.5
|
56.3
|
52.9--59.6
|
48.9
|
46.4--51.3
|
|
Median
|
15.8
|
31.5
|
23.7
|
|
35.1
|
52.6
|
44.0
|
|
Range
|
10.2--20.0
|
22.5--38.0
|
17.0--27.8
|
|
24.9--43.0
|
41.0--63.6
|
33.3--53.6
|
|
Local surveys
|
|
|
|
|
|
|
|
|
|
|
|
|
|
|
Boston, MA
|
10.0
|
7.8--12.9
|
20.1
|
16.8--23.9
|
15.0
|
13.1--17.2
|
|
20.1
|
16.1--24.8
|
33.4
|
29.4--37.7
|
26.6
|
23.5--30.0
|
|
Broward County, FL
|
13.0
|
10.8--15.6
|
28.1
|
24.3--32.3
|
20.4
|
18.1--22.9
|
|
25.7
|
22.8--28.9
|
47.9
|
43.6--52.3
|
36.7
|
34.0--39.4
|
|
Charlotte-Mecklenburg, NC
|
14.5
|
12.1--17.3
|
34.0
|
30.2--38.0
|
24.3
|
21.8--26.9
|
|
32.8
|
28.6--37.3
|
54.1
|
49.4--58.8
|
43.4
|
39.6--47.3
|
|
Chicago, IL
|
13.6
|
10.9--16.7
|
21.3
|
15.1--29.1
|
17.5
|
13.6--22.3
|
|
26.9
|
22.5--31.8
|
37.6
|
29.1--47.0
|
32.3
|
26.9--38.2
|
|
Clark County, NV
|
16.5
|
13.2--20.4
|
33.3
|
29.4--37.4
|
25.1
|
22.1--28.2
|
|
33.5
|
28.5--38.8
|
50.9
|
45.5--56.3
|
42.4
|
38.2--46.7
|
|
Dallas, TX
|
9.7
|
7.6--12.3
|
20.2
|
16.6--24.2
|
14.8
|
12.6--17.3
|
|
23.0
|
19.4--27.0
|
38.1
|
32.9--43.7
|
30.4
|
26.6--34.4
|
|
Detroit, MI
|
12.9
|
10.7--15.4
|
18.4
|
14.7--22.9
|
15.6
|
13.3--18.2
|
|
22.1
|
19.0--25.6
|
29.7
|
24.7--35.3
|
25.9
|
22.6--29.5
|
|
Duval County, FL
|
11.0
|
9.3--12.9
|
22.7
|
20.1--25.5
|
16.6
|
15.1--18.3
|
|
23.6
|
21.2--26.2
|
37.1
|
34.0--40.4
|
30.1
|
28.0--32.3
|
|
Los Angeles, CA
|
13.6
|
10.9--16.7
|
27.1
|
21.5--33.5
|
20.5
|
16.4--25.2
|
|
31.9
|
26.6--37.7
|
46.8
|
40.8--52.8
|
39.5
|
34.1--45.2
|
|
Memphis, TN
|
12.1
|
9.6--15.1
|
26.1
|
22.1--30.5
|
18.9
|
16.5--21.5
|
|
23.5
|
19.9--27.5
|
41.3
|
36.5--46.2
|
32.1
|
29.2--35.2
|
|
Miami-Dade County, FL
|
12.4
|
10.3--14.8
|
30.3
|
27.5--33.2
|
21.4
|
19.5--23.5
|
|
25.1
|
22.2--28.3
|
46.8
|
44.1--49.6
|
36.0
|
33.7--38.3
|
|
Milwaukee, WI
|
13.7
|
11.3--16.7
|
21.8
|
18.8--25.1
|
17.7
|
15.6--20.1
|
|
23.5
|
20.5--26.8
|
35.5
|
31.3--39.8
|
29.4
|
26.8--32.2
|
|
New York City, NY
|
13.4
|
12.2--14.7
|
24.2
|
22.5--25.9
|
18.3
|
17.2--19.4
|
|
29.1
|
26.8--31.5
|
42.2
|
39.8--44.5
|
35.0
|
32.9--37.1
|
|
Orange County, FL
|
11.4
|
8.3--15.3
|
29.9
|
26.4--33.6
|
20.5
|
17.9--23.4
|
|
21.2
|
17.4--25.5
|
48.1
|
43.7--52.5
|
34.5
|
31.1--38.1
|
|
Palm Beach County, FL
|
13.4
|
11.2--15.9
|
31.2
|
28.1--34.4
|
22.3
|
20.3--24.4
|
|
26.1
|
23.1--29.4
|
48.0
|
44.2--51.7
|
37.0
|
34.5--39.6
|
|
Philadelphia, PA
|
12.1
|
9.5--15.3
|
25.0
|
21.2--29.2
|
18.2
|
15.6--21.1
|
|
23.9
|
20.5--27.7
|
41.3
|
36.4--46.4
|
32.0
|
28.8--35.4
|
|
San Bernardino, CA
|
15.5
|
12.2--19.5
|
36.7
|
31.9--41.6
|
26.3
|
23.1--29.8
|
|
32.2
|
27.6--37.1
|
52.4
|
47.1--57.7
|
42.5
|
38.5--46.5
|
|
San Diego, CA
|
18.4
|
15.3--22.1
|
34.1
|
30.5--37.9
|
26.3
|
23.7--29.2
|
|
38.8
|
34.6--43.1
|
55.1
|
50.6--59.6
|
47.0
|
43.7--50.5
|
|
San Francisco, CA
|
12.1
|
10.1--14.6
|
19.3
|
16.9--22.0
|
15.7
|
14.0--17.5
|
|
29.1
|
25.4--33.0
|
39.8
|
36.1--43.7
|
34.4
|
31.5--37.4
|
|
Seattle, WA
|
14.0
|
11.8--16.4
|
20.7
|
17.8--24.0
|
17.3
|
15.5--19.2
|
|
36.2
|
32.5--40.0
|
44.2
|
41.1--47.3
|
40.1
|
37.7--42.5
|
|
Median
|
13.2
|
25.5
|
18.6
|
|
25.9
|
43.2
|
34.8
|
|
Range
|
9.7--18.4
|
18.4--36.7
|
14.8--26.3
|
|
20.1--38.8
|
29.7--55.1
|
25.9--47.0
|
|
|
Female
|
Male
|
Total
|
|
Category
|
%
|
CI†
|
%
|
CI
|
%
|
CI
|
|
Race/Ethnicity
|
|
|
|
|
|
|
|
White§
|
25.4
|
23.3--27.6
|
15.9
|
13.3--18.8
|
20.3
|
18.4--22.3
|
|
Black§
|
43.6
|
40.2--47.1
|
20.6
|
17.8--23.7
|
32.1
|
29.7--34.5
|
|
Hispanic
|
30.5
|
28.0--33.2
|
17.4
|
15.5--19.6
|
23.9
|
22.1--25.8
|
|
Grade
|
|
|
|
|
|
|
|
9
|
26.9
|
24.4--29.5
|
17.4
|
14.9--20.3
|
21.8
|
19.7--24.1
|
|
10
|
30.3
|
27.1--33.7
|
15.7
|
12.9--19.0
|
22.6
|
19.9--25.6
|
|
11
|
29.8
|
26.7--33.1
|
16.4
|
14.2--18.8
|
22.9
|
20.9--25.0
|
|
12
|
33.0
|
29.8--36.4
|
18.5
|
16.3--20.8
|
25.6
|
23.4--27.9
|
|
Total
|
29.9
|
28.1--31.7
|
17.0
|
15.1--19.1
|
23.1
|
21.5--24.8
|
|
|
Female
|
Male
|
Total
|
|
Site
|
%
|
CI†
|
%
|
CI
|
%
|
CI
|
|
State surveys
|
|
|
|
|
|
|
|
Alabama
|
25.5
|
21.6--29.9
|
19.3
|
15.9--23.2
|
22.4
|
19.6--25.4
|
|
Alaska
|
17.1
|
13.6--21.1
|
15.1
|
12.5--18.2
|
16.2
|
13.9--18.9
|
|
Arizona
|
18.8
|
16.0--22.0
|
12.5
|
10.0--15.5
|
15.6
|
13.5--18.1
|
|
Arkansas
|
22.0
|
17.5--27.2
|
16.8
|
13.7--20.4
|
19.5
|
16.7--22.6
|
|
Colorado
|
13.7
|
10.1--18.2
|
8.8
|
5.9--13.0
|
11.3
|
8.9--14.1
|
|
Connecticut
|
17.0
|
14.3--20.0
|
11.0
|
8.7--13.9
|
14.0
|
11.7--16.6
|
|
Delaware
|
25.4
|
22.9--28.0
|
13.8
|
11.7--16.1
|
19.7
|
18.0--21.6
|
|
Florida
|
25.2
|
23.2--27.4
|
13.4
|
11.8--15.1
|
19.4
|
17.9--20.9
|
|
Georgia
|
22.8
|
19.2--26.9
|
12.4
|
10.2--15.1
|
17.6
|
15.6--19.8
|
|
Hawaii
|
22.5
|
19.2--26.2
|
14.4
|
11.5--17.9
|
18.3
|
15.6--21.4
|
|
Idaho
|
12.8
|
10.8--15.0
|
8.9
|
7.3--10.8
|
10.8
|
9.5--12.3
|
|
Illinois
|
18.3
|
15.6--21.5
|
14.7
|
11.4--18.8
|
16.5
|
13.7--19.8
|
|
Indiana
|
26.5
|
23.0--30.4
|
12.9
|
9.4--17.5
|
19.5
|
16.7--22.7
|
|
Kansas
|
17.4
|
14.5--20.6
|
11.5
|
9.4--14.1
|
14.4
|
12.3--16.6
|
|
Kentucky
|
19.4
|
16.4--22.8
|
14.6
|
12.2--17.4
|
17.0
|
15.0--19.3
|
|
Louisiana
|
21.9
|
16.7--28.2
|
15.0
|
11.3--19.7
|
18.5
|
15.2--22.3
|
|
Maine
|
19.0
|
17.8--20.3
|
16.8
|
15.6--18.1
|
18.0
|
17.1--18.9
|
|
Maryland
|
21.2
|
16.5--26.7
|
15.9
|
12.8--19.6
|
18.5
|
15.1--22.5
|
|
Massachusetts
|
29.8
|
25.4--34.6
|
16.9
|
14.4--19.7
|
23.3
|
20.3--26.4
|
|
Michigan
|
16.7
|
14.0--19.7
|
11.6
|
9.1--14.6
|
14.2
|
11.9--16.7
|
|
Mississippi
|
25.7
|
22.1--29.8
|
16.6
|
13.1--20.7
|
21.2
|
18.2--24.6
|
|
Missouri
|
17.6
|
15.2--20.3
|
11.9
|
10.0--14.2
|
14.7
|
12.9--16.6
|
|
Montana
|
16.7
|
12.8--21.5
|
10.2
|
7.9--13.0
|
13.4
|
11.2--15.9
|
|
Nevada
|
18.2
|
15.5--21.2
|
10.4
|
8.4--12.7
|
14.2
|
12.4--16.3
|
|
New Hampshire
|
16.2
|
12.3--21.0
|
10.1
|
7.8--13.0
|
13.2
|
10.8--16.1
|
|
New Jersey
|
23.6
|
20.1--27.4
|
13.0
|
10.1--16.7
|
18.3
|
15.7--21.3
|
|
New Mexico
|
19.2
|
16.4--22.3
|
11.9
|
10.6--13.3
|
15.5
|
14.0--17.1
|
|
New York
|
20.8
|
17.7--24.3
|
13.2
|
11.4--15.3
|
17.0
|
15.1--19.1
|
|
North Carolina
|
20.1
|
16.8--23.9
|
10.4
|
8.2--13.0
|
15.4
|
13.7--17.4
|
|
North Dakota
|
15.6
|
12.9--18.7
|
11.7
|
9.7--14.0
|
13.7
|
12.0--15.5
|
|
Oklahoma
|
18.5
|
15.5--21.9
|
14.3
|
11.5--17.6
|
16.3
|
14.0--18.9
|
|
Pennsylvania
|
15.3
|
12.4--18.6
|
10.8
|
8.2--14.3
|
13.1
|
10.6--15.9
|
|
Rhode Island
|
16.0
|
13.9--18.4
|
10.8
|
8.5--13.7
|
13.3
|
11.5--15.4
|
|
South Carolina
|
26.7
|
23.6--29.9
|
15.7
|
12.3--19.8
|
21.3
|
18.4--24.4
|
|
South Dakota
|
16.0
|
12.7--19.9
|
12.2
|
10.1--14.7
|
14.0
|
12.0--16.3
|
|
Tennessee
|
20.7
|
17.4--24.4
|
14.8
|
11.7--18.6
|
17.7
|
15.3--20.5
|
|
Texas
|
20.0
|
17.0--23.3
|
12.2
|
10.5--14.2
|
16.0
|
14.6--17.6
|
|
Utah
|
11.2
|
8.6--14.4
|
9.7
|
7.3--12.9
|
10.5
|
8.5--12.8
|
|
Vermont
|
15.2
|
13.0--17.8
|
11.0
|
9.3--13.0
|
13.2
|
11.5--15.1
|
|
West Virginia
|
19.9
|
16.9--23.4
|
14.7
|
11.8--18.2
|
17.3
|
15.0--19.9
|
|
Wisconsin
|
15.6
|
13.3--18.3
|
10.3
|
8.4--12.6
|
12.9
|
11.2--14.9
|
|
Wyoming
|
15.0
|
13.1--17.2
|
12.2
|
10.3--14.4
|
13.6
|
12.2--15.2
|
|
Median
|
18.9
|
12.4
|
16.1
|
|
Range
|
11.2--29.8
|
8.8--19.3
|
10.5--23.3
|
|
Local surveys
|
|
|
|
|
|
|
|
Boston, MA
|
35.1
|
31.3--39.0
|
21.4
|
18.1--25.1
|
28.2
|
25.2--31.5
|
|
Broward County, FL
|
27.3
|
24.3--30.5
|
17.2
|
14.4--20.4
|
22.1
|
20.0--24.5
|
|
Charlotte-Mecklenburg, NC
|
22.3
|
18.6--26.5
|
13.6
|
10.9--16.7
|
18.0
|
15.5--20.7
|
|
Chicago, IL
|
27.3
|
23.3--31.7
|
19.5
|
14.2--26.2
|
23.2
|
19.8--26.9
|
|
Clark County, NV
|
18.4
|
14.9--22.6
|
11.1
|
8.7--14.1
|
14.7
|
12.3--17.5
|
|
Dallas, TX
|
21.7
|
17.3--26.7
|
16.0
|
11.3--22.1
|
18.9
|
15.5--23.0
|
|
Detroit, MI
|
29.6
|
25.9--33.6
|
23.7
|
19.1--29.1
|
26.6
|
23.4--30.0
|
|
Duval County, FL
|
25.6
|
23.1--28.2
|
17.3
|
15.2--19.6
|
21.4
|
19.7--23.2
|
|
Los Angeles, CA
|
22.3
|
19.4--25.5
|
12.9
|
9.5--17.4
|
17.5
|
14.8--20.6
|
|
Memphis, TN
|
33.6
|
28.9--38.7
|
23.2
|
19.8--27.1
|
28.5
|
25.6--31.5
|
|
Miami-Dade County, FL
|
27.9
|
24.8--31.1
|
15.8
|
13.7--18.2
|
21.9
|
20.0--24.0
|
|
Milwaukee, WI
|
29.9
|
26.6--33.4
|
20.7
|
17.5--24.3
|
25.4
|
23.0--28.0
|
|
New York City, NY
|
25.5
|
23.3--27.8
|
16.0
|
14.3--17.9
|
21.2
|
19.5--23.0
|
|
Orange County, FL
|
24.7
|
21.1--28.7
|
14.0
|
11.0--17.7
|
19.5
|
17.1--22.2
|
|
Palm Beach County, FL
|
23.8
|
21.4--26.5
|
12.8
|
10.7--15.4
|
18.4
|
16.7--20.1
|
|
Philadelphia, PA
|
32.3
|
27.7--37.1
|
14.8
|
11.2--19.2
|
23.9
|
20.7--27.3
|
|
San Bernardino, CA
|
18.5
|
14.8--22.8
|
11.0
|
8.6--14.0
|
14.7
|
12.4--17.4
|
|
San Diego, CA
|
17.6
|
15.0--20.6
|
12.1
|
10.0--14.6
|
14.9
|
13.2--16.8
|
|
San Francisco, CA
|
26.8
|
23.3--30.5
|
19.7
|
16.8--22.9
|
23.3
|
20.7--26.0
|
|
Seattle, WA
|
18.0
|
15.2--21.2
|
14.0
|
11.5--16.9
|
16.0
|
14.2--18.0
|
|
Median
|
25.5
|
15.9
|
21.3
|
|
Range
|
17.6--35.1
|
11.0--23.7
|
14.7--28.5
|
|
|
Used computers 3 or more hours/day
|
|
Watched television 3 or more hours/day
|
|
|
Female
|
Male
|
Total
|
|
Female
|
Male
|
Total
|
|
Category
|
%
|
CI§
|
%
|
CI
|
%
|
CI
|
|
%
|
CI
|
%
|
CI
|
%
|
CI
|
|
Race/Ethnicity
|
|
|
|
|
|
|
|
|
|
|
|
|
|
|
White¶
|
17.8
|
15.7--20.1
|
25.9
|
21.5--30.9
|
22.1
|
19.6--24.9
|
|
22.7
|
20.4--25.1
|
26.6
|
23.3--30.3
|
24.8
|
22.8--26.9
|
|
Black¶
|
27.5
|
24.2--31.2
|
33.2
|
30.2--36.3
|
30.4
|
28.1--32.9
|
|
57.4
|
54.8--59.9
|
53.7
|
49.8--57.6
|
55.5
|
53.3--57.7
|
|
Hispanic
|
23.0
|
19.8--26.5
|
28.4
|
25.2--31.8
|
25.7
|
23.5--28.1
|
|
41.5
|
38.5--44.6
|
42.4
|
38.4--46.5
|
41.9
|
39.0--44.9
|
|
Grade
|
|
|
|
|
|
|
|
|
|
|
|
|
|
|
9
|
24.6
|
21.9--27.5
|
32.2
|
27.0--37.9
|
28.7
|
25.4--32.3
|
|
33.9
|
30.5--37.5
|
36.3
|
31.7--41.2
|
35.2
|
31.8--38.7
|
|
10
|
22.5
|
19.7--25.5
|
28.2
|
23.2--33.8
|
25.5
|
22.4--28.8
|
|
33.6
|
30.2--37.2
|
35.7
|
30.7--40.9
|
34.7
|
31.5--38.0
|
|
11
|
19.3
|
16.8--22.0
|
27.2
|
23.9--30.8
|
23.4
|
21.2--25.7
|
|
29.6
|
27.3--31.9
|
31.8
|
28.7--35.2
|
30.8
|
28.6--33.0
|
|
12
|
17.7
|
14.3--21.6
|
24.5
|
21.3--28.1
|
21.2
|
18.7--23.9
|
|
31.0
|
27.6--34.6
|
28.4
|
24.4--32.9
|
29.7
|
27.0--32.5
|
|
Total
|
21.2
|
19.4--23.1
|
28.3
|
25.1--31.8
|
24.9
|
22.9--27.0
|
|
32.1
|
29.9--34.4
|
33.5
|
29.9--37.2
|
32.8
|
30.4--35.3
|
|
|
Used computers 3 or more hours/day
|
|
Watched television 3 or more hours/day
|
|
|
Female
|
Male
|
Total
|
|
Female
|
Male
|
Total
|
|
Site
|
%
|
CI§
|
%
|
CI
|
%
|
CI
|
|
%
|
CI
|
%
|
CI
|
%
|
CI
|
|
State surveys
|
|
|
|
|
|
|
|
|
|
|
|
|
|
|
Alabama
|
20.9
|
17.7--24.4
|
26.9
|
23.0--31.3
|
24.1
|
21.5--26.9
|
|
36.8
|
31.7--42.3
|
39.1
|
33.2--45.3
|
37.8
|
33.4--42.4
|
|
Alaska
|
18.3
|
14.8--22.3
|
28.8
|
24.8--33.2
|
23.6
|
20.6--26.9
|
|
25.4
|
22.2--28.8
|
24.1
|
21.7--26.6
|
24.8
|
22.8--26.9
|
|
Arizona
|
17.0
|
14.1--20.4
|
27.0
|
22.9--31.5
|
22.1
|
19.3--25.1
|
|
34.0
|
29.2--39.1
|
32.7
|
29.4--36.1
|
33.3
|
30.1--36.7
|
|
Arkansas
|
14.8
|
11.6--18.6
|
27.4
|
23.2--31.9
|
21.0
|
18.2--24.2
|
|
34.7
|
29.5--40.3
|
38.0
|
32.4--44.0
|
36.4
|
31.9--41.0
|
|
Colorado
|
13.2
|
10.8--16.0
|
23.3
|
18.8--28.6
|
18.4
|
15.6--21.4
|
|
20.5
|
17.3--24.2
|
29.7
|
25.5--34.4
|
25.1
|
21.8--28.7
|
|
Connecticut
|
26.2
|
22.7--30.2
|
29.6
|
27.3--32.1
|
27.9
|
25.8--30.0
|
|
29.4
|
24.7--34.5
|
30.8
|
27.1--34.8
|
30.2
|
26.5--34.2
|
|
Delaware
|
22.1
|
19.5--24.8
|
32.6
|
29.8--35.6
|
27.4
|
25.4--29.3
|
|
36.5
|
33.5--39.7
|
39.1
|
36.0--42.3
|
37.7
|
35.3--40.1
|
|
Florida
|
26.3
|
24.6--28.1
|
35.7
|
33.2--38.3
|
31.0
|
29.2--32.7
|
|
36.8
|
34.4--39.2
|
39.8
|
37.6--42.1
|
38.2
|
36.3--40.1
|
|
Georgia
|
19.3
|
16.1--22.8
|
26.3
|
23.7--29.2
|
22.9
|
21.1--24.8
|
|
39.9
|
36.3--43.7
|
38.4
|
34.2--42.8
|
39.2
|
36.0--42.5
|
|
Hawaii
|
26.3
|
23.0--29.9
|
28.7
|
24.4--33.4
|
27.4
|
24.3--30.7
|
|
29.1
|
24.3--34.4
|
31.2
|
26.9--35.9
|
30.1
|
27.1--33.2
|
|
Idaho
|
12.5
|
10.8--14.4
|
21.6
|
18.7--24.7
|
17.2
|
15.3--19.2
|
|
20.2
|
17.5--23.2
|
23.4
|
20.7--26.2
|
21.9
|
19.9--24.1
|
|
Illinois
|
21.4
|
18.9--24.0
|
27.5
|
23.1--32.4
|
24.5
|
21.9--27.3
|
|
34.6
|
29.7--39.7
|
36.9
|
32.7--41.4
|
35.7
|
32.1--39.5
|
|
Indiana
|
18.6
|
15.2--22.5
|
28.7
|
24.2--33.6
|
23.7
|
20.5--27.2
|
|
30.3
|
25.0--36.2
|
27.7
|
24.0--31.8
|
29.0
|
25.2--33.1
|
|
Kansas
|
14.3
|
11.8--17.3
|
24.9
|
21.3--28.9
|
19.8
|
17.4--22.4
|
|
26.7
|
23.0--30.8
|
29.8
|
25.5--34.5
|
28.3
|
25.3--31.5
|
|
Kentucky
|
19.2
|
15.2--24.1
|
26.7
|
22.9--30.8
|
23.0
|
20.1--26.1
|
|
29.2
|
25.4--33.2
|
28.6
|
24.5--33.0
|
28.8
|
25.6--32.2
|
|
Louisiana
|
19.4
|
14.1--25.9
|
29.5
|
23.2--36.7
|
24.4
|
19.0--30.6
|
|
43.1
|
36.8--49.6
|
37.7
|
31.8--44.0
|
40.3
|
35.7--45.1
|
|
Maine
|
17.2
|
15.9--18.4
|
28.3
|
26.9--29.8
|
22.9
|
22.0--23.9
|
|
21.8
|
20.4--23.2
|
28.9
|
27.5--30.5
|
25.4
|
24.4--26.5
|
|
Maryland
|
25.9
|
21.2--31.3
|
32.0
|
28.0--36.2
|
28.9
|
25.1--33.0
|
|
37.3
|
31.0--44.0
|
41.2
|
35.5--47.0
|
39.1
|
34.0--44.5
|
|
Massachusetts
|
27.1
|
23.7--30.8
|
32.6
|
29.7--35.7
|
29.9
|
27.3--32.7
|
|
29.1
|
25.5--33.0
|
31.6
|
28.1--35.3
|
30.4
|
27.3--33.6
|
|
Michigan
|
18.8
|
16.0--21.8
|
27.8
|
25.3--30.4
|
23.3
|
21.1--25.7
|
|
25.2
|
21.1--29.9
|
34.2
|
31.1--37.5
|
29.6
|
26.2--33.3
|
|
Mississippi
|
17.6
|
14.1--21.7
|
27.3
|
24.5--30.2
|
22.3
|
19.8--25.0
|
|
45.2
|
38.7--51.9
|
44.7
|
39.8--49.7
|
44.9
|
39.7--50.4
|
|
Missouri
|
16.5
|
13.7--19.7
|
29.1
|
25.4--33.0
|
22.9
|
20.6--25.3
|
|
29.8
|
25.3--34.8
|
35.0
|
29.4--40.9
|
32.4
|
27.6--37.6
|
|
Montana
|
10.5
|
8.1--13.5
|
24.9
|
21.6--28.4
|
17.9
|
15.8--20.2
|
|
20.2
|
17.0--23.8
|
27.1
|
24.0--30.5
|
23.7
|
21.5--26.1
|
|
Nevada
|
20.9
|
18.2--23.9
|
31.2
|
28.0--34.6
|
26.2
|
24.1--28.4
|
|
36.4
|
32.7--40.4
|
33.9
|
30.3--37.8
|
35.1
|
32.2--38.2
|
|
New Hampshire
|
16.6
|
13.9--19.6
|
30.9
|
27.5--34.6
|
23.9
|
21.8--26.3
|
|
18.6
|
15.2--22.7
|
27.1
|
24.0--30.3
|
23.0
|
20.5--25.7
|
|
New Jersey
|
25.8
|
22.2--29.8
|
31.9
|
27.4--36.8
|
28.9
|
25.8--32.2
|
|
31.6
|
25.3--38.8
|
33.5
|
27.3--40.4
|
32.6
|
26.7--39.0
|
|
New Mexico
|
14.8
|
12.2--17.9
|
27.3
|
24.8--30.0
|
21.0
|
19.0--23.3
|
|
29.9
|
27.0--32.9
|
35.3
|
32.3--38.5
|
32.6
|
29.8--35.5
|
|
New York
|
26.2
|
23.5--29.1
|
32.4
|
29.0--36.0
|
29.2
|
26.5--32.1
|
|
29.9
|
26.6--33.3
|
35.5
|
31.8--39.5
|
32.7
|
29.8--35.6
|
|
North Carolina
|
19.1
|
16.7--21.6
|
28.2
|
25.8--30.7
|
23.5
|
21.9--25.2
|
|
35.4
|
29.4--42.0
|
37.1
|
33.5--40.9
|
36.2
|
31.7--41.0
|
|
North Dakota
|
13.7
|
11.4--16.4
|
23.0
|
19.7--26.6
|
18.4
|
16.3--20.8
|
|
19.7
|
16.8--23.1
|
31.2
|
27.6--35.1
|
25.6
|
23.3--28.0
|
|
Oklahoma
|
16.6
|
13.4--20.3
|
28.2
|
23.8--33.1
|
22.5
|
19.3--25.9
|
|
26.3
|
22.2--30.9
|
31.4
|
27.1--36.0
|
29.0
|
25.6--32.6
|
|
Pennsylvania
|
20.7
|
16.2--26.0
|
32.7
|
29.0--36.6
|
26.7
|
23.4--30.3
|
|
28.8
|
24.3--33.6
|
32.8
|
29.6--36.1
|
30.8
|
27.4--34.5
|
|
Rhode Island
|
24.0
|
20.5--27.8
|
31.3
|
27.8--35.0
|
27.8
|
25.5--30.3
|
|
27.1
|
22.7--32.0
|
30.9
|
26.1--36.3
|
29.1
|
24.8--33.7
|
|
South Carolina
|
17.7
|
13.2--23.4
|
27.9
|
24.2--31.9
|
22.7
|
19.5--26.4
|
|
41.0
|
32.8--49.8
|
38.6
|
32.9--44.6
|
39.7
|
34.3--45.5
|
|
South Dakota
|
14.7
|
12.0--17.9
|
24.6
|
21.0--28.5
|
19.8
|
17.2--22.7
|
|
18.2
|
15.6--21.1
|
26.6
|
22.1--31.6
|
22.6
|
19.4--26.2
|
|
Tennessee
|
21.0
|
18.2--24.0
|
30.6
|
26.7--34.9
|
26.0
|
23.7--28.4
|
|
37.9
|
33.1--42.8
|
37.8
|
32.9--42.9
|
37.7
|
33.3--42.3
|
|
Texas
|
20.6
|
18.2--23.2
|
29.4
|
26.6--32.4
|
25.1
|
22.8--27.5
|
|
35.9
|
30.6--41.6
|
36.6
|
33.6--39.8
|
36.3
|
32.5--40.2
|
|
Utah
|
7.1
|
5.2--9.7
|
16.5
|
13.2--20.5
|
12.1
|
10.0--14.5
|
|
16.1
|
12.5--20.5
|
16.4
|
13.4--19.9
|
16.3
|
13.5--19.6
|
|
Vermont
|
---¶
|
---
|
---
|
---
|
---
|
---
|
|
---
|
---
|
---
|
---
|
---
|
---
|
|
West Virginia
|
21.2
|
17.6--25.4
|
26.9
|
22.9--31.4
|
24.1
|
22.2--26.2
|
|
30.9
|
26.4--35.9
|
31.9
|
28.6--35.3
|
31.5
|
28.2--34.9
|
|
Wisconsin
|
13.9
|
11.8--16.3
|
24.2
|
21.3--27.3
|
19.2
|
17.2--21.5
|
|
19.4
|
16.4--22.8
|
26.8
|
22.7--31.5
|
23.1
|
20.1--26.5
|
|
Wyoming
|
10.6
|
9.0--12.3
|
21.7
|
19.5--24.1
|
16.3
|
14.9--17.9
|
|
19.8
|
17.8--21.9
|
23.9
|
21.6--26.4
|
22.0
|
20.3--23.7
|
|
Median
|
18.8
|
28.2
|
23.5
|
|
29.8
|
32.7
|
30.8
|
|
Range
|
7.1--27.1
|
16.5--35.7
|
12.1--31.0
|
|
16.1--45.2
|
16.4--44.7
|
16.3--44.9
|
|
Local surveys
|
|
|
|
|
|
|
|
|
|
|
|
|
|
|
Boston, MA
|
29.8
|
25.7--34.2
|
36.8
|
32.4--41.4
|
33.2
|
29.7--37.0
|
|
41.9
|
37.7--46.3
|
47.6
|
42.3--52.9
|
44.6
|
41.2--48.0
|
|
Broward County, FL
|
26.8
|
23.2--30.8
|
33.9
|
31.1--36.8
|
30.4
|
28.0--32.9
|
|
45.3
|
40.8--49.9
|
44.4
|
39.9--49.1
|
44.8
|
41.4--48.3
|
|
Charlotte-Mecklenburg, NC
|
22.8
|
19.7--26.2
|
29.6
|
26.2--33.2
|
26.1
|
24.0--28.4
|
|
42.5
|
38.4--46.6
|
42.5
|
38.4--46.8
|
42.4
|
39.5--45.4
|
|
Chicago, IL
|
27.2
|
22.7--32.2
|
29.5
|
23.6--36.2
|
28.3
|
24.5--32.4
|
|
46.6
|
39.4--54.0
|
44.0
|
37.5--50.7
|
44.9
|
38.8--51.3
|
|
Clark County, NV
|
21.3
|
18.1--24.9
|
35.8
|
32.5--39.3
|
28.8
|
26.6--31.1
|
|
40.2
|
35.7--44.8
|
37.0
|
32.4--41.8
|
38.6
|
35.2--42.1
|
|
Dallas, TX
|
20.3
|
16.6--24.5
|
30.1
|
24.6--36.2
|
25.0
|
22.1--28.3
|
|
45.4
|
40.5--50.5
|
40.2
|
36.0--44.5
|
42.8
|
39.4--46.4
|
|
Detroit, MI
|
24.4
|
20.9--28.3
|
32.5
|
28.2--37.1
|
28.4
|
25.6--31.4
|
|
46.2
|
42.7--49.8
|
49.9
|
45.2--54.6
|
48.0
|
44.5--51.5
|
|
Duval County, FL
|
24.6
|
22.1--27.3
|
32.7
|
29.7--35.8
|
28.4
|
26.5--30.3
|
|
42.9
|
39.5--46.2
|
39.6
|
35.7--43.7
|
41.0
|
38.3--43.8
|
|
Los Angeles, CA
|
25.5
|
22.0--29.4
|
28.1
|
24.9--31.6
|
26.8
|
24.1--29.8
|
|
38.7
|
33.6--44.1
|
40.4
|
35.1--45.9
|
39.5
|
34.9--44.3
|
|
Memphis, TN
|
26.6
|
23.1--30.3
|
35.0
|
31.4--38.8
|
30.8
|
27.9--33.9
|
|
60.3
|
56.0--64.5
|
59.0
|
53.1--64.7
|
59.6
|
55.5--63.5
|
|
Miami-Dade County, FL
|
30.8
|
27.7--34.0
|
35.5
|
32.7--38.5
|
33.2
|
30.8--35.7
|
|
40.3
|
37.7--43.0
|
47.1
|
44.1--50.0
|
43.7
|
41.7--45.7
|
|
Milwaukee, WI
|
21.5
|
19.1--24.2
|
33.2
|
29.6--36.9
|
27.2
|
24.7--29.7
|
|
43.4
|
39.7--47.1
|
42.2
|
38.3--46.1
|
42.6
|
39.6--45.7
|
|
New York City, NY
|
41.8
|
39.9--43.7
|
43.3
|
41.4--45.2
|
42.5
|
40.9--44.1
|
|
42.4
|
39.2--45.7
|
44.4
|
41.1--47.7
|
43.3
|
40.5--46.2
|
|
Orange County, FL
|
27.1
|
23.3--31.4
|
39.3
|
35.6--43.1
|
33.2
|
30.2--36.3
|
|
42.9
|
38.0--47.9
|
44.3
|
39.3--49.3
|
43.5
|
40.0--47.1
|
|
Palm Beach County, FL
|
23.6
|
20.7--26.8
|
32.6
|
29.2--36.1
|
28.2
|
25.6--30.8
|
|
38.1
|
34.9--41.4
|
41.5
|
38.0--45.0
|
39.9
|
37.5--42.3
|
|
Philadelphia, PA
|
29.2
|
26.0--32.6
|
41.6
|
36.4--46.9
|
35.1
|
31.7--38.7
|
|
55.0
|
50.8--59.2
|
50.8
|
46.2--55.3
|
52.9
|
49.4--56.4
|
|
San Bernardino, CA
|
24.3
|
20.9--28.1
|
32.5
|
29.1--36.1
|
28.5
|
25.9--31.2
|
|
44.4
|
39.9--49.0
|
38.0
|
33.7--42.5
|
41.1
|
37.5--44.7
|
|
San Diego, CA
|
25.2
|
22.5--28.0
|
32.2
|
28.4--36.1
|
28.7
|
26.2--31.2
|
|
28.2
|
24.7--31.9
|
33.3
|
29.7--37.0
|
30.7
|
27.9--33.8
|
|
San Francisco, CA
|
34.1
|
31.0--37.4
|
37.9
|
34.8--41.1
|
35.9
|
33.7--38.2
|
|
28.9
|
25.5--32.5
|
30.3
|
27.1--33.7
|
29.5
|
26.7--32.5
|
|
Seattle, WA
|
20.6
|
17.8--23.6
|
27.6
|
24.1--31.4
|
24.2
|
21.6--27.0
|
|
26.5
|
22.9--30.5
|
28.6
|
25.1--32.4
|
27.7
|
24.8--30.8
|
|
Median
|
25.3
|
32.9
|
28.6
|
|
42.7
|
42.3
|
42.7
|
|
Range
|
20.3--41.8
|
27.6--43.3
|
24.2--42.5
|
|
26.5--60.3
|
28.6--59.0
|
27.7--59.6
|
|
|
Attended PE classes*
|
|
Attended PE classes daily†
|
|
|
Female
|
Male
|
Total
|
|
Female
|
Male
|
Total
|
|
Category
|
%
|
CI§
|
%
|
CI
|
%
|
CI
|
|
%
|
CI
|
%
|
CI
|
%
|
CI
|
|
Race/Ethnicity
|
|
|
|
|
|
|
|
|
|
|
|
|
|
|
White¶
|
56.8
|
46.2--66.8
|
56.1
|
43.8--67.6
|
56.4
|
46.0--66.3
|
|
29.7
|
23.0--37.4
|
31.4
|
23.9--40.0
|
30.6
|
24.0--38.1
|
|
Black¶
|
49.8
|
41.9--57.7
|
58.9
|
53.6--64.1
|
54.4
|
48.2--60.5
|
|
34.0
|
27.6--41.1
|
40.1
|
34.7--45.8
|
37.0
|
31.5--42.8
|
|
Hispanic
|
57.9
|
51.3--64.2
|
63.1
|
57.2--68.6
|
60.5
|
54.7--66.1
|
|
39.5
|
32.1--47.4
|
41.5
|
33.3--50.3
|
40.5
|
32.8--48.7
|
|
Grade
|
|
|
|
|
|
|
|
|
|
|
|
|
|
|
9
|
74.3
|
67.7--80.0
|
70.7
|
62.7--77.5
|
72.4
|
66.1--77.9
|
|
48.2
|
40.6--55.9
|
45.5
|
37.8--53.4
|
46.7
|
39.4--54.1
|
|
10
|
56.4
|
46.9--65.5
|
58.6
|
47.0--69.3
|
57.6
|
48.5--66.2
|
|
32.3
|
25.9--39.5
|
34.9
|
27.7--42.9
|
33.7
|
27.7--40.2
|
|
11
|
45.3
|
36.0--54.9
|
50.9
|
41.8--60.0
|
48.2
|
39.5--57.0
|
|
25.5
|
20.0--31.8
|
29.7
|
23.9--36.3
|
27.6
|
22.4--33.5
|
|
12
|
40.7
|
30.6--51.6
|
46.9
|
37.4--56.6
|
43.8
|
34.5--53.7
|
|
19.6
|
14.7--25.6
|
25.2
|
18.6--33.2
|
22.4
|
17.0--29.0
|
|
Total
|
55.0
|
47.0--62.7
|
57.7
|
49.1--65.8
|
56.4
|
48.9--63.6
|
|
31.9
|
26.5--37.9
|
34.6
|
28.3--41.4
|
33.3
|
27.7--39.3
|
|
|
Attended PE classes*
|
|
Attended PE classes daily†
|
|
|
Female
|
Male
|
Total
|
|
Female
|
Male
|
Total
|
|
Site
|
%
|
CI§
|
%
|
CI
|
%
|
CI
|
|
%
|
CI
|
%
|
CI
|
%
|
CI
|
|
State surveys
|
|
|
|
|
|
|
|
|
|
|
|
|
|
|
Alabama
|
42.3
|
36.1--48.7
|
49.2
|
42.2--56.3
|
45.7
|
39.7--51.9
|
|
29.6
|
24.2--35.7
|
34.4
|
28.6--40.7
|
31.8
|
26.7--37.4
|
|
Alaska
|
37.7
|
31.5--44.4
|
53.2
|
48.4--57.9
|
45.8
|
40.9--50.7
|
|
13.3
|
9.8--17.8
|
21.8
|
17.5--26.9
|
17.7
|
14.4--21.6
|
|
Arizona
|
33.1
|
25.9--41.2
|
52.5
|
46.7--58.2
|
42.9
|
36.9--49.1
|
|
24.3
|
18.3--31.7
|
40.8
|
35.7--46.2
|
32.6
|
27.3--38.3
|
|
Arkansas
|
33.7
|
26.4--41.9
|
45.1
|
38.6--51.8
|
39.4
|
34.0--45.1
|
|
21.3
|
15.2--29.0
|
24.2
|
19.7--29.4
|
22.7
|
18.5--27.5
|
|
Colorado
|
39.5
|
32.0--47.5
|
50.0
|
44.3--55.6
|
45.0
|
39.6--50.5
|
|
15.6
|
10.0--23.7
|
25.3
|
16.1--37.4
|
20.7
|
13.6--30.3
|
|
Connecticut
|
---¶
|
---
|
---
|
---
|
---
|
---
|
|
---
|
---
|
---
|
---
|
---
|
---
|
|
Delaware
|
34.6
|
29.6--39.9
|
44.8
|
39.1--50.6
|
39.7
|
35.2--44.5
|
|
22.7
|
18.5--27.6
|
28.1
|
23.0--33.7
|
25.4
|
21.3--29.9
|
|
Florida
|
34.6
|
31.3--38.0
|
52.6
|
49.8--55.4
|
43.8
|
41.1--46.5
|
|
19.7
|
16.9--22.7
|
33.5
|
30.3--36.9
|
26.7
|
24.0--29.7
|
|
Georgia
|
36.1
|
28.7--44.3
|
51.2
|
42.3--60.0
|
43.6
|
36.1--51.4
|
|
26.8
|
20.3--34.6
|
32.9
|
25.7--41.0
|
29.8
|
23.7--36.7
|
|
Hawaii
|
36.3
|
29.5--43.7
|
50.6
|
44.9--56.3
|
43.8
|
39.0--48.7
|
|
9.0
|
6.4--12.7
|
13.3
|
8.2--20.7
|
11.4
|
7.6--16.7
|
|
Idaho
|
39.3
|
34.3--44.4
|
57.0
|
51.8--62.0
|
48.3
|
43.9--52.8
|
|
15.9
|
12.5--19.9
|
31.2
|
25.1--37.9
|
23.7
|
19.4--28.7
|
|
Illinois
|
80.5
|
73.0--86.2
|
83.0
|
78.3--86.8
|
81.7
|
76.0--86.3
|
|
67.8
|
59.0--75.4
|
67.7
|
60.6--74.2
|
67.5
|
60.5--73.9
|
|
Indiana
|
25.1
|
18.9--32.5
|
44.3
|
36.6--52.2
|
34.8
|
28.9--41.1
|
|
14.7
|
8.8--23.5
|
31.2
|
22.7--41.2
|
23.0
|
16.6--31.1
|
|
Kansas
|
43.5
|
34.3--53.1
|
61.6
|
54.1--68.5
|
52.9
|
45.1--60.5
|
|
15.9
|
9.3--25.9
|
24.1
|
16.9--33.3
|
20.1
|
13.8--28.3
|
|
Kentucky
|
23.7
|
18.3--30.2
|
41.8
|
34.2--49.8
|
32.9
|
27.1--39.3
|
|
16.1
|
10.8--23.4
|
29.8
|
23.0--37.8
|
23.1
|
17.6--29.8
|
|
Louisiana
|
48.2
|
27.0--70.1
|
53.8
|
41.9--65.3
|
51.0
|
35.4--66.4
|
|
36.7
|
18.5--59.7
|
36.1
|
26.3--47.2
|
36.4
|
22.6--52.9
|
|
Maine
|
38.2
|
35.9--40.6
|
44.6
|
42.3--46.9
|
41.5
|
39.5--43.6
|
|
4.5
|
3.8--5.3
|
6.1
|
5.2--7.1
|
5.4
|
4.7--6.1
|
|
Maryland
|
30.6
|
23.1--39.2
|
48.1
|
40.5--55.7
|
39.3
|
33.1--45.8
|
|
15.9
|
9.2--26.1
|
24.2
|
16.6--34.0
|
20.0
|
13.7--28.2
|
|
Massachusetts
|
55.5
|
47.1--63.6
|
61.0
|
53.3--68.1
|
58.3
|
50.6--65.5
|
|
16.8
|
10.4--25.8
|
19.1
|
13.2--26.9
|
17.9
|
12.0--25.9
|
|
Michigan
|
35.9
|
30.2--42.0
|
48.2
|
43.5--53.0
|
42.3
|
37.8--46.9
|
|
26.1
|
21.1--31.8
|
36.0
|
30.7--41.6
|
31.0
|
26.5--36.0
|
|
Mississippi
|
27.8
|
22.4--33.9
|
47.7
|
42.7--52.8
|
37.6
|
33.2--42.3
|
|
18.5
|
14.1--23.8
|
34.0
|
28.9--39.4
|
26.1
|
22.1--30.6
|
|
Missouri
|
33.4
|
28.6--38.6
|
54.8
|
46.5--62.9
|
44.4
|
38.0--50.9
|
|
25.4
|
20.4--31.2
|
40.4
|
30.3--51.5
|
33.1
|
25.7--41.5
|
|
Montana
|
53.5
|
46.3--60.5
|
61.8
|
57.0--66.3
|
57.7
|
52.3--62.9
|
|
29.1
|
24.9--33.6
|
35.4
|
29.7--41.5
|
32.2
|
28.1--36.7
|
|
Nevada
|
---
|
---
|
---
|
---
|
---
|
---
|
|
---
|
---
|
---
|
---
|
---
|
---
|
|
New Hampshire
|
38.5
|
31.5--46.1
|
43.6
|
36.2--51.3
|
41.1
|
34.7--47.9
|
|
22.4
|
17.1--28.7
|
25.6
|
20.3--31.7
|
24.0
|
19.2--29.5
|
|
New Jersey
|
---
|
---
|
---
|
---
|
---
|
---
|
|
---
|
---
|
---
|
---
|
---
|
---
|
|
New Mexico
|
44.0
|
37.7--50.6
|
56.8
|
51.5--62.0
|
50.4
|
45.0--55.8
|
|
26.5
|
19.2--35.5
|
33.9
|
23.9--45.5
|
30.2
|
21.7--40.2
|
|
New York
|
92.6
|
90.5--94.3
|
91.2
|
88.9--93.1
|
92.0
|
90.0--93.5
|
|
15.8
|
12.7--19.6
|
15.2
|
12.4--18.5
|
15.4
|
12.9--18.4
|
|
North Carolina
|
---
|
---
|
---
|
---
|
---
|
---
|
|
---
|
---
|
---
|
---
|
---
|
---
|
|
North Dakota
|
---
|
---
|
---
|
---
|
---
|
---
|
|
---
|
---
|
---
|
---
|
---
|
---
|
|
Oklahoma
|
29.5
|
23.6--36.1
|
42.6
|
32.7--53.1
|
36.4
|
28.6--44.8
|
|
24.8
|
20.1--30.1
|
37.3
|
28.7--46.9
|
31.4
|
24.9--38.7
|
|
Pennsylvania
|
71.5
|
62.4--79.1
|
73.5
|
65.0--80.6
|
72.5
|
64.4--79.3
|
|
19.2
|
12.9--27.4
|
22.8
|
16.9--29.9
|
20.9
|
15.1--28.3
|
|
Rhode Island
|
82.2
|
75.6--87.4
|
82.5
|
76.4--87.3
|
82.3
|
76.1--87.2
|
|
22.0
|
11.5--38.0
|
22.6
|
12.1--38.1
|
22.2
|
11.8--37.9
|
|
South Carolina
|
26.1
|
19.4--34.1
|
42.7
|
32.8--53.3
|
34.5
|
26.9--43.0
|
|
13.2
|
8.8--19.3
|
20.2
|
14.2--28.0
|
16.8
|
12.1--22.8
|
|
South Dakota
|
23.6
|
17.1--31.7
|
34.4
|
27.9--41.6
|
29.1
|
22.9--36.2
|
|
15.3
|
10.3--22.0
|
22.6
|
17.1--29.2
|
19.0
|
14.0--25.3
|
|
Tennessee
|
28.2
|
21.6--35.8
|
38.7
|
32.4--45.4
|
33.4
|
27.6--39.7
|
|
18.3
|
13.5--24.4
|
27.4
|
22.5--33.0
|
22.9
|
18.7--27.7
|
|
Texas
|
46.4
|
41.8--51.0
|
56.1
|
51.2--60.9
|
51.3
|
47.2--55.4
|
|
30.7
|
24.6--37.6
|
43.8
|
38.2--49.4
|
37.4
|
32.2--42.8
|
|
Utah
|
53.4
|
49.0--57.6
|
60.2
|
53.8--66.3
|
57.0
|
52.1--61.8
|
|
19.3
|
14.0--25.9
|
24.2
|
15.9--35.1
|
21.8
|
15.5--29.8
|
|
Vermont
|
39.2
|
35.3--43.2
|
44.7
|
39.9--49.6
|
42.1
|
38.1--46.2
|
|
18.0
|
11.3--27.4
|
20.8
|
14.1--29.5
|
19.4
|
12.9--28.3
|
|
West Virginia
|
25.0
|
19.8--30.9
|
39.5
|
31.8--47.9
|
32.6
|
26.2--39.7
|
|
20.3
|
15.6--26.0
|
27.4
|
20.8--35.1
|
24.0
|
18.7--30.3
|
|
Wisconsin
|
51.5
|
46.0--57.0
|
58.7
|
53.5--63.8
|
55.2
|
50.6--59.7
|
|
41.6
|
36.3--47.1
|
44.9
|
39.3--50.6
|
43.2
|
38.3--48.2
|
|
Wyoming
|
50.9
|
47.0--54.9
|
63.4
|
59.5--67.2
|
57.4
|
53.9--60.9
|
|
19.3
|
16.2--22.8
|
26.1
|
22.7--29.9
|
22.7
|
20.0--25.8
|
|
Median
|
38.2
|
51.2
|
43.8
|
|
19.3
|
27.4
|
23.1
|
|
Range
|
23.6--92.6
|
34.4--91.2
|
29.1--92.0
|
|
4.5--67.8
|
6.1--67.7
|
5.4--67.5
|
|
Local surveys
|
|
|
|
|
|
|
|
|
|
|
|
|
|
|
Boston, MA
|
34.5
|
26.0--44.1
|
41.9
|
34.7--49.4
|
38.2
|
30.9--46.0
|
|
8.0
|
5.1--12.4
|
10.8
|
7.6--15.2
|
9.3
|
6.6--13.1
|
|
Broward County, FL
|
32.5
|
27.5--38.0
|
46.1
|
40.4--52.0
|
39.1
|
34.6--43.9
|
|
20.0
|
15.7--25.1
|
28.6
|
24.1--33.5
|
24.2
|
20.5--28.3
|
|
Charlotte-Mecklenburg, NC
|
36.6
|
30.7--42.9
|
55.2
|
48.2--62.0
|
45.8
|
39.7--52.0
|
|
19.9
|
14.5--26.6
|
33.2
|
26.7--40.3
|
26.4
|
20.8--32.9
|
|
Chicago, IL
|
57.0
|
44.0--69.2
|
63.0
|
54.0--71.2
|
60.1
|
49.9--69.6
|
|
39.3
|
28.8--50.8
|
40.5
|
31.9--49.8
|
39.6
|
30.8--49.1
|
|
Clark County, NV
|
---
|
---
|
---
|
---
|
---
|
---
|
|
---
|
---
|
---
|
---
|
---
|
---
|
|
Dallas, TX
|
42.6
|
36.9--48.4
|
51.9
|
46.0--57.7
|
47.2
|
42.2--52.3
|
|
15.2
|
11.5--19.8
|
17.7
|
14.0--22.1
|
16.4
|
13.4--19.9
|
|
Detroit, MI
|
40.4
|
35.0--45.9
|
48.6
|
42.6--54.7
|
44.6
|
39.5--49.9
|
|
23.3
|
18.7--28.6
|
29.0
|
23.5--35.3
|
26.3
|
21.6--31.6
|
|
Duval County, FL
|
43.6
|
39.3--48.0
|
55.9
|
51.6--60.1
|
49.8
|
46.2--53.5
|
|
6.0
|
4.6--7.8
|
11.1
|
9.2--13.4
|
8.4
|
7.1--9.9
|
|
Los Angeles, CA
|
58.4
|
52.0--64.5
|
63.4
|
56.6--69.6
|
60.9
|
54.9--66.6
|
|
41.1
|
30.4--52.8
|
43.1
|
32.5--54.4
|
42.1
|
31.8--53.0
|
|
Memphis, TN
|
35.4
|
26.9--45.0
|
47.7
|
39.6--56.0
|
41.3
|
33.5--49.6
|
|
25.9
|
18.8--34.4
|
34.4
|
26.3--43.5
|
30.0
|
23.0--38.0
|
|
Miami-Dade County, FL
|
38.1
|
31.9--44.7
|
51.4
|
46.2--56.6
|
44.6
|
39.3--50.0
|
|
9.3
|
6.6--12.8
|
15.6
|
12.3--19.5
|
12.4
|
9.7--15.7
|
|
Milwaukee, WI
|
40.2
|
35.9--44.7
|
55.3
|
50.8--59.7
|
47.6
|
43.9--51.3
|
|
24.2
|
20.3--28.6
|
29.7
|
25.1--34.8
|
26.8
|
23.4--30.6
|
|
New York City, NY
|
81.2
|
76.5--85.1
|
81.1
|
77.5--84.3
|
81.1
|
77.3--84.5
|
|
39.2
|
32.5--46.4
|
39.8
|
33.5--46.4
|
39.5
|
33.3--46.0
|
|
Orange County, FL
|
37.2
|
30.1--45.0
|
54.8
|
46.6--62.7
|
45.9
|
39.2--52.8
|
|
18.6
|
13.8--24.7
|
34.3
|
27.6--41.6
|
26.4
|
21.3--32.3
|
|
Palm Beach County, FL
|
41.6
|
34.9--48.7
|
57.3
|
52.5--62.0
|
49.4
|
44.4--54.4
|
|
15.7
|
11.7--20.8
|
26.8
|
23.3--30.6
|
21.3
|
18.4--24.6
|
|
Philadelphia, PA
|
39.8
|
32.0--48.1
|
46.2
|
37.7--54.9
|
43.0
|
35.7--50.6
|
|
22.6
|
17.3--28.9
|
27.1
|
21.0--34.1
|
24.8
|
19.6--30.8
|
|
San Bernardino, CA
|
61.7
|
51.6--70.9
|
67.1
|
58.9--74.5
|
64.4
|
55.9--72.0
|
|
42.6
|
34.5--51.1
|
50.3
|
43.0--57.6
|
46.4
|
39.4--53.5
|
|
San Diego, CA
|
50.8
|
43.1--58.4
|
60.2
|
53.8--66.3
|
55.6
|
49.4--61.6
|
|
33.9
|
28.2--40.1
|
41.6
|
36.6--46.9
|
37.8
|
33.6--42.3
|
|
San Francisco, CA
|
53.0
|
44.3--61.6
|
58.2
|
50.4--65.7
|
55.6
|
47.6--63.3
|
|
27.6
|
21.8--34.3
|
30.9
|
25.9--36.2
|
29.1
|
24.2--34.5
|
|
Seattle, WA
|
30.0
|
26.2--34.1
|
40.4
|
35.3--45.7
|
35.5
|
31.8--39.5
|
|
16.2
|
13.6--19.2
|
23.7
|
19.1--28.9
|
20.2
|
17.3--23.4
|
|
Median
|
40.4
|
55.2
|
47.2
|
|
22.6
|
29.7
|
26.4
|
|
Range
|
30.0--81.2
|
40.4--81.1
|
35.5--81.1
|
|
6.0--42.6
|
10.8--50.3
|
8.4--46.4
|
|
|
Female
|
Male
|
Total
|
|
Category
|
%
|
CI†
|
%
|
CI
|
%
|
CI
|
|
Race/Ethnicity
|
|
|
|
|
|
|
|
White§
|
57.7
|
54.2--61.0
|
64.0
|
57.2--70.3
|
61.1
|
56.7--65.3
|
|
Black§
|
46.7
|
42.9--50.7
|
67.6
|
64.0--71.0
|
57.3
|
54.6--59.9
|
|
Hispanic
|
44.5
|
41.8--47.3
|
62.0
|
58.7--65.2
|
53.2
|
50.8--55.6
|
|
Grade
|
|
|
|
|
|
|
|
9
|
56.6
|
53.6--59.5
|
65.9
|
61.5--70.0
|
61.6
|
59.0--64.1
|
|
10
|
56.4
|
53.0--59.6
|
66.8
|
61.5--71.8
|
61.8
|
58.5--65.1
|
|
11
|
51.3
|
47.5--55.1
|
63.4
|
58.6--68.0
|
57.6
|
53.9--61.2
|
|
12
|
44.1
|
41.0--47.3
|
57.9
|
52.5--63.1
|
51.1
|
47.7--54.6
|
|
Total
|
52.3
|
49.9--54.7
|
63.8
|
59.5--67.9
|
58.3
|
55.5--61.1
|
|
|
Female
|
Male
|
Total
|
|
Site
|
%
|
CI†
|
%
|
CI
|
%
|
CI
|
|
State surveys
|
|
|
|
|
|
|
|
Alabama
|
47.0
|
43.4--50.6
|
54.6
|
50.7--58.4
|
50.8
|
48.4--53.2
|
|
Alaska
|
57.6
|
53.3--61.8
|
65.9
|
61.9--69.7
|
61.9
|
58.8--64.8
|
|
Arizona
|
48.0
|
43.5--52.5
|
55.7
|
50.7--60.7
|
51.9
|
48.0--55.8
|
|
Arkansas
|
44.0
|
38.6--49.5
|
60.5
|
57.2--63.8
|
52.2
|
48.4--56.0
|
|
Colorado
|
63.5
|
57.9--68.8
|
64.5
|
57.6--71.0
|
63.9
|
58.1--69.4
|
|
Connecticut
|
---§
|
---
|
---
|
---
|
---
|
---
|
|
Delaware
|
44.1
|
40.7--47.5
|
62.5
|
59.3--65.6
|
53.2
|
50.6--55.7
|
|
Florida
|
44.4
|
42.1--46.7
|
56.1
|
53.8--58.4
|
50.0
|
48.2--51.8
|
|
Georgia
|
46.8
|
43.2--50.4
|
61.9
|
57.6--66.2
|
54.3
|
51.0--57.6
|
|
Hawaii
|
---
|
---
|
---
|
---
|
---
|
---
|
|
Idaho
|
56.8
|
53.5--60.1
|
65.3
|
62.3--68.2
|
61.2
|
58.9--63.4
|
|
Illinois
|
54.1
|
47.5--60.5
|
63.2
|
58.0--68.1
|
58.7
|
53.5--63.7
|
|
Indiana
|
50.8
|
45.8--55.7
|
58.0
|
53.6--62.2
|
54.5
|
50.5--58.4
|
|
Kansas
|
53.8
|
48.7--58.9
|
66.1
|
61.4--70.5
|
60.1
|
56.6--63.6
|
|
Kentucky
|
44.6
|
39.9--49.3
|
51.9
|
48.3--55.5
|
48.2
|
44.6--51.8
|
|
Louisiana
|
45.3
|
40.6--50.0
|
56.5
|
50.5--62.4
|
50.6
|
46.9--54.3
|
|
Maine
|
---
|
---
|
---
|
---
|
---
|
---
|
|
Maryland
|
51.2
|
46.2--56.2
|
63.5
|
57.3--69.2
|
57.5
|
53.1--61.7
|
|
Massachusetts
|
56.5
|
51.7--61.1
|
61.3
|
57.0--65.3
|
58.9
|
55.1--62.6
|
|
Michigan
|
---
|
---
|
---
|
---
|
---
|
---
|
|
Mississippi
|
47.8
|
42.9--52.7
|
60.1
|
55.1--65.0
|
53.8
|
50.7--57.0
|
|
Missouri
|
55.4
|
48.3--62.2
|
63.8
|
59.4--67.9
|
59.6
|
54.2--64.7
|
|
Montana
|
54.8
|
49.3--60.0
|
60.7
|
55.7--65.5
|
57.7
|
53.2--62.1
|
|
Nevada
|
---
|
---
|
---
|
---
|
---
|
---
|
|
New Hampshire
|
---
|
---
|
---
|
---
|
---
|
---
|
|
New Jersey
|
60.8
|
54.0--67.2
|
63.6
|
58.5--68.3
|
62.2
|
56.9--67.1
|
|
New Mexico
|
---
|
---
|
---
|
---
|
---
|
---
|
|
New York
|
53.3
|
50.3--56.2
|
66.2
|
63.4--68.9
|
59.6
|
57.4--61.7
|
|
North Carolina
|
---
|
---
|
---
|
---
|
---
|
---
|
|
North Dakota
|
---
|
---
|
---
|
---
|
---
|
---
|
|
Oklahoma
|
46.9
|
42.4--51.5
|
57.5
|
52.7--62.2
|
52.4
|
48.5--56.2
|
|
Pennsylvania
|
52.2
|
46.9--57.4
|
62.5
|
58.4--66.5
|
57.4
|
53.6--61.2
|
|
Rhode Island
|
---
|
---
|
---
|
---
|
---
|
---
|
|
South Carolina
|
46.4
|
39.7--53.2
|
56.2
|
50.9--61.4
|
51.3
|
46.4--56.2
|
|
South Dakota
|
62.5
|
57.4--67.2
|
66.4
|
61.4--71.0
|
64.4
|
60.2--68.3
|
|
Tennessee
|
43.5
|
38.6--48.5
|
56.6
|
52.7--60.4
|
50.1
|
46.6--53.7
|
|
Texas
|
49.7
|
45.0--54.4
|
67.5
|
64.6--70.3
|
58.8
|
56.4--61.2
|
|
Utah
|
61.5
|
56.4--66.4
|
65.7
|
61.1--70.1
|
63.6
|
59.4--67.6
|
|
Vermont
|
---
|
---
|
---
|
---
|
---
|
---
|
|
West Virginia
|
50.3
|
45.8--54.8
|
53.9
|
49.5--58.3
|
52.2
|
48.7--55.7
|
|
Wisconsin
|
---
|
---
|
---
|
---
|
---
|
---
|
|
Wyoming
|
56.5
|
53.0--60.0
|
63.7
|
60.6--66.6
|
60.3
|
57.9--62.6
|
|
Median
|
51.0
|
62.2
|
57.4
|
|
Range
|
43.5--63.5
|
51.9--67.5
|
48.2--64.4
|
|
Local surveys
|
|
|
|
|
|
|
|
Boston, MA
|
36.9
|
32.1--41.9
|
54.0
|
49.9--58.1
|
45.3
|
41.9--48.9
|
|
Broward County, FL
|
40.4
|
35.5--45.4
|
52.6
|
48.6--56.5
|
46.2
|
42.8--49.7
|
|
Charlotte-Mecklenburg, NC
|
---
|
---
|
---
|
---
|
---
|
---
|
|
Chicago, IL
|
40.4
|
35.0--46.0
|
63.1
|
55.9--69.7
|
52.2
|
47.7--56.6
|
|
Clark County, NV
|
---
|
---
|
---
|
---
|
---
|
---
|
|
Dallas, TX
|
47.5
|
42.4--52.6
|
55.5
|
49.9--60.9
|
51.4
|
47.2--55.5
|
|
Detroit, MI
|
---
|
---
|
---
|
---
|
---
|
---
|
|
Duval County, FL
|
42.8
|
39.6--46.1
|
55.7
|
52.2--59.2
|
49.2
|
46.6--51.8
|
|
Los Angeles, CA
|
43.1
|
39.4--46.9
|
61.8
|
59.2--64.4
|
52.7
|
50.5--54.9
|
|
Memphis, TN
|
40.5
|
35.1--46.2
|
63.6
|
59.4--67.6
|
51.8
|
48.2--55.3
|
|
Miami-Dade County, FL
|
37.3
|
34.1--40.7
|
56.9
|
53.4--60.3
|
47.0
|
44.8--49.3
|
|
Milwaukee, WI
|
---
|
---
|
---
|
---
|
---
|
---
|
|
New York City, NY
|
36.7
|
34.2--39.4
|
50.8
|
48.4--53.2
|
43.0
|
41.1--45.0
|
|
Orange County, FL
|
38.8
|
34.0--43.7
|
56.5
|
51.6--61.3
|
47.5
|
43.9--51.1
|
|
Palm Beach County, FL
|
42.8
|
38.8--46.9
|
58.0
|
54.5--61.5
|
50.4
|
47.4--53.4
|
|
Philadelphia, PA
|
35.8
|
30.5--41.6
|
53.2
|
47.8--58.5
|
43.9
|
40.3--47.6
|
|
San Bernardino, CA
|
46.0
|
40.8--51.2
|
56.9
|
51.5--62.1
|
51.4
|
47.3--55.5
|
|
San Diego, CA
|
52.3
|
47.8--56.8
|
61.1
|
57.1--65.0
|
56.8
|
53.5--60.0
|
|
San Francisco, CA
|
37.1
|
33.2--41.1
|
48.6
|
44.9--52.2
|
42.8
|
39.8--45.9
|
|
Seattle, WA
|
51.1
|
46.9--55.2
|
58.6
|
54.6--62.6
|
55.0
|
51.6--58.3
|
|
Median
|
40.4
|
56.7
|
49.8
|
|
Range
|
35.8--52.3
|
48.6--63.6
|
42.8--56.8
|
|
|
Obese
|
|
Overweight
|
|
|
Female
|
Male
|
Total
|
|
Female
|
Male
|
Total
|
|
Category
|
%
|
CI§
|
%
|
CI
|
%
|
CI
|
|
%
|
CI
|
%
|
CI
|
%
|
CI
|
|
Race/Ethnicity
|
|
|
|
|
|
|
|
|
|
|
|
|
|
|
White¶
|
6.2
|
5.2--7.4
|
13.8
|
11.1--17.0
|
10.3
|
8.8--12.0
|
|
13.2
|
11.5--15.1
|
13.9
|
12.1--16.0
|
13.6
|
12.0--15.4
|
|
Black¶
|
12.6
|
10.0--15.9
|
17.5
|
14.5--21.0
|
15.1
|
13.4--17.0
|
|
23.3
|
19.9--27.1
|
18.7
|
15.8--22.0
|
21.0
|
18.6--23.6
|
|
Hispanic
|
11.1
|
9.8--12.6
|
18.9
|
16.4--21.7
|
15.1
|
13.5--16.8
|
|
19.5
|
17.5--21.5
|
19.7
|
17.6--21.9
|
19.6
|
17.9--21.3
|
|
Grade
|
|
|
|
|
|
|
|
|
|
|
|
|
|
|
9
|
7.6
|
6.4--8.9
|
15.3
|
12.7--18.3
|
11.8
|
10.2--13.6
|
|
17.9
|
16.1--19.8
|
16.7
|
14.9--18.6
|
17.2
|
15.8--18.7
|
|
10
|
7.7
|
6.1--9.6
|
13.8
|
11.4--16.6
|
11.0
|
9.7--12.3
|
|
16.9
|
14.7--19.3
|
16.9
|
14.3--20.0
|
16.9
|
14.9--19.1
|
|
11
|
8.9
|
6.9--11.3
|
14.5
|
12.4--16.9
|
11.8
|
10.2--13.6
|
|
13.5
|
12.1--15.1
|
14.4
|
12.7--16.3
|
14.0
|
12.8--15.3
|
|
12
|
9.1
|
7.5--11.0
|
17.7
|
13.6--22.8
|
13.5
|
11.3--16.0
|
|
15.1
|
13.0--17.5
|
14.4
|
11.8--17.4
|
14.7
|
12.9--16.8
|
|
Total
|
8.3
|
7.5--9.1
|
15.3
|
13.3--17.5
|
12.0
|
10.9--13.1
|
|
15.9
|
14.8--17.0
|
15.7
|
14.4--17.2
|
15.8
|
14.7--17.0
|
|
|
Obese
|
|
Overweight
|
|
|
Female
|
Male
|
Total
|
|
Female
|
Male
|
Total
|
|
Site
|
%
|
CI§
|
%
|
CI
|
%
|
CI
|
|
%
|
CI
|
%
|
CI
|
%
|
CI
|
|
State surveys
|
|
|
|
|
|
|
|
|
|
|
|
|
|
|
Alabama
|
9.9
|
8.1--12.1
|
17.0
|
14.0--20.4
|
13.5
|
11.3--16.1
|
|
19.9
|
16.6--23.7
|
15.1
|
11.9--19.0
|
17.5
|
15.2--20.0
|
|
Alaska
|
10.0
|
7.9--12.6
|
13.5
|
10.8--16.6
|
11.8
|
9.9--13.9
|
|
14.9
|
12.2--18.1
|
13.9
|
11.2--17.1
|
14.4
|
12.3--16.7
|
|
Arizona
|
8.9
|
6.7--11.8
|
16.9
|
14.4--19.6
|
13.1
|
11.3--15.1
|
|
15.2
|
12.4--18.5
|
14.0
|
12.1--16.1
|
14.6
|
13.1--16.2
|
|
Arkansas
|
10.1
|
7.2--14.0
|
18.5
|
15.0--22.7
|
14.4
|
12.1--17.2
|
|
15.4
|
12.0--19.5
|
16.1
|
13.3--19.3
|
15.7
|
13.3--18.6
|
|
Colorado
|
5.4
|
3.3--8.8
|
8.6
|
6.0--12.0
|
7.1
|
5.2--9.5
|
|
10.4
|
8.0--13.5
|
11.7
|
9.1--14.9
|
11.1
|
9.6--12.8
|
|
Connecticut
|
6.7
|
4.7--9.4
|
13.8
|
11.3--16.7
|
10.4
|
8.4--12.7
|
|
12.2
|
10.3--14.4
|
16.6
|
14.3--19.3
|
14.5
|
13.0--16.2
|
|
Delaware
|
11.8
|
9.9--14.0
|
15.3
|
13.2--17.7
|
13.7
|
12.2--15.2
|
|
16.8
|
14.4--19.5
|
14.8
|
12.7--17.2
|
15.8
|
14.2--17.5
|
|
Florida
|
7.3
|
6.3--8.5
|
13.2
|
11.8--14.8
|
10.3
|
9.3--11.4
|
|
13.3
|
11.9--14.7
|
16.1
|
14.7--17.6
|
14.7
|
13.7--15.7
|
|
Georgia
|
10.5
|
8.1--13.5
|
14.3
|
11.8--17.2
|
12.4
|
10.4--14.8
|
|
16.0
|
12.7--19.9
|
13.8
|
10.9--17.3
|
14.8
|
12.4--17.7
|
|
Hawaii
|
11.7
|
7.8--17.1
|
17.0
|
13.4--21.2
|
14.5
|
11.3--18.3
|
|
14.8
|
11.4--19.1
|
13.2
|
10.1--17.0
|
14.0
|
11.5--16.9
|
|
Idaho
|
4.9
|
3.8--6.4
|
12.3
|
10.2--14.7
|
8.8
|
7.4--10.3
|
|
11.5
|
9.5--13.9
|
12.4
|
10.4--14.7
|
12.0
|
10.4--13.7
|
|
Illinois
|
9.0
|
6.4--12.4
|
14.7
|
12.1--17.9
|
11.9
|
9.9--14.3
|
|
14.1
|
11.9--16.8
|
16.8
|
14.7--19.0
|
15.5
|
13.6--17.5
|
|
Indiana
|
9.7
|
7.7--12.2
|
15.7
|
12.5--19.4
|
12.8
|
10.5--15.4
|
|
17.9
|
15.0--21.3
|
14.0
|
11.6--16.8
|
15.9
|
14.2--17.8
|
|
Kansas
|
9.5
|
7.6--11.9
|
15.0
|
12.1--18.3
|
12.4
|
10.4--14.7
|
|
13.0
|
11.1--15.2
|
13.2
|
10.5--16.4
|
13.1
|
11.3--15.2
|
|
Kentucky
|
14.4
|
11.1--18.4
|
20.5
|
17.5--24.0
|
17.6
|
15.1--20.4
|
|
16.4
|
13.7--19.6
|
14.9
|
12.6--17.4
|
15.6
|
13.7--17.7
|
|
Louisiana
|
11.3
|
8.8--14.5
|
18.1
|
12.7--25.2
|
14.7
|
12.1--17.7
|
|
21.0
|
18.1--24.3
|
14.8
|
11.0--19.6
|
18.0
|
15.8--20.4
|
|
Maine
|
8.0
|
7.1--8.9
|
16.7
|
15.5--18.0
|
12.5
|
11.7--13.3
|
|
13.5
|
12.4--14.6
|
16.7
|
15.5--17.9
|
15.1
|
14.3--16.0
|
|
Maryland
|
8.8
|
5.9--12.8
|
15.5
|
13.2--18.1
|
12.2
|
9.9--14.9
|
|
15.4
|
12.7--18.4
|
15.9
|
13.7--18.4
|
15.6
|
13.6--17.9
|
|
Massachusetts
|
7.2
|
5.4--9.7
|
14.3
|
12.2--16.8
|
10.9
|
9.3--12.9
|
|
14.8
|
12.2--17.9
|
13.8
|
11.8--16.0
|
14.3
|
12.5--16.3
|
|
Michigan
|
8.0
|
6.6--9.7
|
15.7
|
13.5--18.2
|
11.9
|
10.6--13.5
|
|
13.2
|
10.8--15.9
|
15.2
|
13.4--17.2
|
14.2
|
12.6--15.9
|
|
Mississippi
|
16.6
|
13.7--20.0
|
20.0
|
16.7--23.7
|
18.3
|
15.9--21.0
|
|
16.8
|
13.9--20.1
|
16.2
|
13.2--19.7
|
16.5
|
14.2--19.0
|
|
Missouri
|
10.5
|
8.0--13.8
|
18.3
|
16.2--20.5
|
14.4
|
12.4--16.7
|
|
13.9
|
11.0--17.5
|
14.8
|
11.8--18.4
|
14.4
|
12.5--16.5
|
|
Montana
|
7.5
|
4.9--11.4
|
13.1
|
10.3--16.5
|
10.4
|
8.4--12.8
|
|
9.4
|
7.4--11.8
|
14.3
|
11.9--17.1
|
11.9
|
10.3--13.8
|
|
Nevada
|
6.7
|
5.4--8.2
|
15.1
|
12.5--18.2
|
11.0
|
9.3--13.0
|
|
13.5
|
11.3--16.0
|
13.4
|
11.5--15.6
|
13.4
|
11.9--15.2
|
|
New Hampshire
|
7.7
|
5.9--10.1
|
16.4
|
12.2--21.7
|
12.4
|
9.9--15.3
|
|
12.9
|
9.6--17.1
|
13.6
|
10.9--16.9
|
13.3
|
11.3--15.6
|
|
New Jersey
|
6.7
|
4.9--9.2
|
13.8
|
11.3--16.7
|
10.3
|
8.5--12.4
|
|
13.6
|
10.5--17.5
|
14.9
|
12.4--17.7
|
14.2
|
12.1--16.7
|
|
New Mexico
|
8.5
|
6.8--10.5
|
18.3
|
14.8--22.4
|
13.5
|
11.1--16.3
|
|
14.5
|
12.5--16.8
|
14.6
|
12.9--16.4
|
14.6
|
13.1--16.1
|
|
New York
|
7.4
|
5.6--9.6
|
14.6
|
12.2--17.5
|
11.0
|
9.5--12.8
|
|
14.0
|
12.2--16.0
|
17.2
|
14.8--20.1
|
15.6
|
14.0--17.5
|
|
North Carolina
|
10.1
|
7.5--13.3
|
16.8
|
14.3--19.7
|
13.4
|
11.1--16.0
|
|
15.2
|
12.3--18.6
|
13.9
|
11.9--16.2
|
14.6
|
12.4--17.0
|
|
North Dakota
|
7.2
|
5.5--9.3
|
14.6
|
12.3--17.3
|
11.0
|
9.6--12.7
|
|
12.4
|
10.2--14.9
|
14.6
|
11.9--17.8
|
13.5
|
11.7--15.6
|
|
Oklahoma
|
13.6
|
10.1--18.1
|
14.7
|
11.7--18.3
|
14.1
|
11.5--17.3
|
|
16.5
|
12.4--21.6
|
16.4
|
13.8--19.4
|
16.4
|
13.9--19.4
|
|
Pennsylvania
|
10.1
|
8.0--12.5
|
13.5
|
11.5--15.7
|
11.8
|
10.4--13.4
|
|
16.2
|
13.9--18.8
|
15.6
|
13.2--18.3
|
15.9
|
14.2--17.7
|
|
Rhode Island
|
8.2
|
6.2--10.8
|
12.4
|
10.4--14.7
|
10.4
|
8.5--12.6
|
|
16.9
|
14.5--19.8
|
16.5
|
14.8--18.4
|
16.7
|
15.3--18.2
|
|
South Carolina
|
14.4
|
9.7--20.7
|
18.9
|
14.7--23.9
|
16.7
|
12.7--21.6
|
|
16.1
|
13.4--19.3
|
14.0
|
10.0--19.2
|
15.0
|
12.5--17.9
|
|
South Dakota
|
6.0
|
4.4--8.0
|
13.1
|
10.2--16.6
|
9.6
|
7.8--11.9
|
|
12.0
|
10.2--14.1
|
13.1
|
11.5--15.0
|
12.6
|
11.3--14.1
|
|
Tennessee
|
13.0
|
10.7--15.7
|
18.6
|
15.9--21.5
|
15.8
|
13.9--18.0
|
|
17.5
|
15.6--19.5
|
14.8
|
12.5--17.6
|
16.1
|
14.5--17.9
|
|
Texas
|
11.0
|
8.7--13.9
|
15.9
|
13.8--18.2
|
13.6
|
11.9--15.5
|
|
15.7
|
12.3--19.9
|
15.5
|
13.1--18.3
|
15.6
|
13.3--18.2
|
|
Utah
|
4.4
|
2.8--6.9
|
8.3
|
6.1--11.2
|
6.4
|
4.8--8.5
|
|
10.9
|
8.2--14.2
|
10.2
|
8.0--13.0
|
10.5
|
8.9--12.4
|
|
Vermont
|
8.1
|
7.2--9.2
|
16.1
|
13.9--18.4
|
12.2
|
10.8--13.8
|
|
12.5
|
11.3--13.8
|
14.7
|
13.3--16.1
|
13.6
|
12.7--14.5
|
|
West Virginia
|
7.7
|
6.0--9.7
|
20.3
|
16.9--24.1
|
14.2
|
12.0--16.8
|
|
15.8
|
13.2--18.7
|
13.1
|
10.6--16.2
|
14.4
|
12.8--16.1
|
|
Wisconsin
|
6.8
|
5.4--8.6
|
11.7
|
9.7--14.1
|
9.3
|
8.0--10.8
|
|
13.7
|
11.5--16.4
|
14.2
|
11.5--17.4
|
14.0
|
12.0--16.3
|
|
Wyoming
|
8.4
|
6.9--10.2
|
11.1
|
9.4--12.9
|
9.8
|
8.6--11.1
|
|
11.9
|
10.1--14.0
|
13.2
|
11.4--15.2
|
12.6
|
11.3--14.0
|
|
Median
|
8.6
|
15.2
|
12.3
|
|
14.6
|
14.6
|
14.6
|
|
Range
|
4.4--16.6
|
8.3--20.5
|
6.4--18.3
|
|
9.4--21.0
|
10.2--17.2
|
10.5--18.0
|
|
Local surveys
|
|
|
|
|
|
|
|
|
|
|
|
|
|
|
Boston, MA
|
12.2
|
9.1--16.3
|
17.7
|
14.6--21.4
|
15.0
|
12.6--17.9
|
|
19.1
|
15.6--23.2
|
17.3
|
13.9--21.4
|
18.2
|
15.5--21.2
|
|
Broward County, FL
|
6.1
|
4.3--8.5
|
13.1
|
10.7--16.0
|
9.7
|
8.1--11.6
|
|
14.9
|
12.0--18.3
|
16.3
|
13.5--19.6
|
15.6
|
13.5--18.0
|
|
Charlotte-Mecklenburg, NC
|
9.7
|
7.5--12.5
|
13.3
|
10.5--16.7
|
11.5
|
9.9--13.3
|
|
16.9
|
14.1--20.3
|
16.1
|
13.5--19.2
|
16.5
|
14.4--19.0
|
|
Chicago, IL
|
11.7
|
9.4--14.5
|
18.1
|
14.1--23.1
|
15.1
|
12.3--18.4
|
|
22.4
|
18.7--26.5
|
19.9
|
16.7--23.5
|
21.1
|
18.5--23.9
|
|
Clark County, NV
|
7.7
|
6.0--9.7
|
16.7
|
13.4--20.6
|
12.3
|
10.1--14.9
|
|
12.9
|
10.4--15.9
|
13.0
|
10.5--15.9
|
12.9
|
11.0--15.1
|
|
Dallas, TX
|
12.7
|
9.8--16.2
|
21.0
|
17.3--25.2
|
16.9
|
14.3--19.8
|
|
20.0
|
16.3--24.3
|
18.5
|
14.7--23.0
|
19.2
|
16.5--22.3
|
|
Detroit, MI
|
18.9
|
15.3--23.1
|
22.8
|
18.2--28.0
|
20.8
|
17.6--24.5
|
|
21.4
|
17.7--25.7
|
17.9
|
14.4--21.9
|
19.6
|
16.7--22.9
|
|
Duval County, FL
|
10.5
|
8.4--13.0
|
15.4
|
13.2--17.9
|
12.9
|
11.4--14.7
|
|
18.4
|
16.0--21.1
|
14.8
|
12.3--17.8
|
16.6
|
14.7--18.7
|
|
Los Angeles, CA
|
7.1
|
5.3--9.5
|
20.3
|
16.4--24.8
|
14.1
|
11.6--17.0
|
|
21.7
|
18.8--25.0
|
16.7
|
14.3--19.5
|
19.1
|
17.7--20.6
|
|
Memphis, TN
|
15.5
|
12.5--19.0
|
18.2
|
15.1--21.9
|
16.8
|
14.3--19.6
|
|
21.2
|
17.5--25.4
|
16.1
|
13.2--19.5
|
18.7
|
16.2--21.6
|
|
Miami-Dade County, FL
|
7.2
|
5.4--9.5
|
13.3
|
11.1--15.9
|
10.3
|
8.9--11.9
|
|
15.0
|
12.8--17.7
|
17.1
|
14.3--20.4
|
16.1
|
14.1--18.4
|
|
Milwaukee, WI
|
15.1
|
12.7--17.8
|
18.1
|
15.7--20.7
|
16.6
|
14.8--18.6
|
|
19.7
|
17.0--22.8
|
14.5
|
12.1--17.2
|
17.1
|
15.2--19.2
|
|
New York City, NY
|
8.5
|
7.6--9.4
|
13.1
|
11.9--14.4
|
10.7
|
10.0--11.5
|
|
16.9
|
15.0--19.0
|
16.3
|
14.8--17.9
|
16.6
|
15.4--17.9
|
|
Orange County, FL
|
8.9
|
6.6--11.9
|
14.3
|
11.4--17.7
|
11.6
|
9.6--14.0
|
|
15.8
|
12.8--19.3
|
15.6
|
12.8--18.8
|
15.7
|
13.7--18.0
|
|
Palm Beach County, FL
|
6.3
|
4.8--8.2
|
13.3
|
10.6--16.4
|
9.8
|
8.3--11.6
|
|
13.8
|
11.6--16.3
|
12.9
|
11.0--15.1
|
13.3
|
11.8--15.0
|
|
Philadelphia, PA
|
15.2
|
11.9--19.2
|
19.6
|
15.6--24.5
|
17.4
|
14.3--20.9
|
|
22.5
|
18.5--27.0
|
16.3
|
12.6--20.7
|
19.4
|
16.8--22.3
|
|
San Bernardino, CA
|
13.4
|
10.8--16.6
|
21.2
|
16.9--26.2
|
17.4
|
14.9--20.2
|
|
20.2
|
17.7--23.0
|
14.9
|
11.8--18.7
|
17.5
|
15.3--20.0
|
|
San Diego, CA
|
7.9
|
6.2--9.9
|
14.9
|
12.6--17.4
|
11.5
|
10.0--13.1
|
|
14.4
|
11.8--17.5
|
13.6
|
11.3--16.4
|
14.0
|
12.6--15.5
|
|
San Francisco, CA
|
5.5
|
3.7--8.0
|
11.1
|
8.9--13.6
|
8.4
|
7.0--10.0
|
|
13.2
|
10.9--15.8
|
12.4
|
10.3--14.8
|
12.8
|
11.4--14.3
|
|
Seattle, WA
|
6.8
|
5.1--8.9
|
13.2
|
10.6--16.5
|
10.2
|
8.2--12.5
|
|
12.5
|
10.3--15.1
|
13.5
|
11.2--16.1
|
13.0
|
11.5--14.7
|
|
Median
|
9.3
|
16.0
|
12.6
|
|
17.6
|
16.1
|
16.6
|
|
Range
|
5.5--18.9
|
11.1--22.8
|
8.4--20.8
|
|
12.5--22.5
|
12.4--19.9
|
12.8--21.1
|
|
|
Described themselves as overweight
|
|
Were trying to lose weight
|
|
|
Female
|
Male
|
Total
|
|
Female
|
Male
|
Total
|
|
Category
|
%
|
CI*
|
%
|
CI
|
%
|
CI
|
|
%
|
CI
|
%
|
CI
|
%
|
CI
|
|
Race/Ethnicity
|
|
|
|
|
|
|
|
|
|
|
|
|
|
|
White†
|
32.3
|
30.4--34.3
|
21.3
|
19.4--23.4
|
26.4
|
24.9--27.9
|
|
61.3
|
59.0--63.6
|
28.4
|
26.2--30.8
|
43.7
|
41.2--46.2
|
|
Black†
|
28.7
|
25.9--31.8
|
17.2
|
14.9--19.9
|
22.9
|
21.1--24.9
|
|
47.3
|
42.1--52.6
|
26.3
|
23.2--29.6
|
36.8
|
33.6--40.1
|
|
Hispanic
|
37.6
|
34.9--40.4
|
28.8
|
26.7--31.1
|
33.3
|
31.7--35.0
|
|
62.4
|
59.7--64.9
|
41.8
|
39.4--44.3
|
52.1
|
50.1--54.1
|
|
Grade
|
|
|
|
|
|
|
|
|
|
|
|
|
|
|
9
|
32.2
|
30.0--34.4
|
22.7
|
20.2--25.5
|
27.1
|
25.4--28.9
|
|
57.0
|
54.4--59.6
|
31.8
|
28.5--35.3
|
43.5
|
41.1--46.0
|
|
10
|
31.1
|
28.1--34.1
|
21.2
|
19.1--23.4
|
25.9
|
24.1--27.7
|
|
59.4
|
56.0--62.7
|
29.5
|
26.9--32.1
|
43.6
|
41.0--46.3
|
|
11
|
33.5
|
31.0--36.1
|
21.8
|
19.7--24.0
|
27.5
|
25.7--29.4
|
|
60.8
|
58.2--63.4
|
28.0
|
25.2--31.0
|
44.0
|
41.4--46.6
|
|
12
|
36.0
|
33.6--38.4
|
25.5
|
23.0--28.1
|
30.6
|
28.9--32.4
|
|
60.3
|
57.5--62.9
|
32.8
|
29.9--36.0
|
46.4
|
44.2--48.5
|
|
Total
|
33.1
|
31.7--34.5
|
22.7
|
21.4--24.1
|
27.7
|
26.7--28.6
|
|
59.3
|
57.5--61.2
|
30.5
|
28.9--32.3
|
44.4
|
42.8--46.0
|
|
|
Described themselves as overweight
|
|
Were trying to lose weight
|
|
|
Female
|
Male
|
Total
|
|
Female
|
Male
|
Total
|
|
Site
|
%
|
CI*
|
%
|
CI
|
%
|
CI
|
|
%
|
CI
|
%
|
CI
|
%
|
CI
|
|
State surveys
|
|
|
|
|
|
|
|
|
|
|
|
|
|
|
Alabama
|
29.8
|
26.0--33.9
|
18.1
|
15.0--21.7
|
23.9
|
21.6--26.4
|
|
56.8
|
52.7--60.8
|
29.4
|
25.6--33.6
|
42.9
|
39.9--45.9
|
|
Alaska
|
35.5
|
31.2--40.1
|
23.6
|
19.8--27.9
|
29.3
|
26.1--32.7
|
|
59.2
|
54.5--63.8
|
29.9
|
25.8--34.3
|
44.1
|
40.0--48.2
|
|
Arizona
|
36.6
|
32.5--40.9
|
23.7
|
20.8--26.9
|
30.1
|
27.6--32.8
|
|
---†
|
---
|
---
|
---
|
---
|
---
|
|
Arkansas
|
30.7
|
27.2--34.4
|
24.1
|
20.1--28.6
|
27.3
|
24.0--30.9
|
|
59.0
|
53.9--64.0
|
32.9
|
29.8--36.1
|
45.8
|
42.8--48.9
|
|
Colorado
|
26.1
|
21.4--31.4
|
18.0
|
14.4--22.3
|
21.9
|
19.0--25.1
|
|
52.8
|
48.6--57.0
|
24.8
|
20.7--29.5
|
38.6
|
35.7--41.5
|
|
Connecticut
|
28.3
|
25.2--31.7
|
23.8
|
20.9--26.9
|
26.0
|
23.8--28.3
|
|
61.6
|
57.9--65.2
|
31.6
|
29.0--34.4
|
46.4
|
44.7--48.2
|
|
Delaware
|
32.0
|
29.3--34.9
|
23.7
|
21.1--26.6
|
27.9
|
26.0--29.8
|
|
56.3
|
53.0--59.5
|
31.0
|
28.2--33.9
|
43.4
|
41.2--45.6
|
|
Florida
|
30.5
|
28.6--32.4
|
23.2
|
21.3--25.2
|
26.7
|
25.6--27.9
|
|
53.3
|
51.0--55.6
|
29.7
|
27.4--32.1
|
41.5
|
39.8--43.2
|
|
Georgia
|
32.5
|
29.6--35.5
|
18.7
|
16.1--21.5
|
25.5
|
23.8--27.3
|
|
55.4
|
51.9--58.9
|
26.3
|
23.2--29.7
|
40.9
|
37.8--44.0
|
|
Hawaii
|
36.2
|
29.6--43.4
|
25.1
|
20.3--30.5
|
30.3
|
26.2--34.8
|
|
66.4
|
59.3--72.9
|
35.0
|
30.9--39.3
|
50.2
|
47.2--53.2
|
|
Idaho
|
32.1
|
29.4--34.9
|
23.4
|
20.7--26.4
|
27.6
|
25.7--29.6
|
|
59.9
|
56.5--63.2
|
24.9
|
22.3--27.8
|
42.0
|
39.7--44.3
|
|
Illinois
|
29.5
|
26.5--32.6
|
21.6
|
19.3--24.1
|
25.5
|
23.7--27.4
|
|
57.6
|
54.8--60.4
|
30.6
|
27.1--34.3
|
43.8
|
41.3--46.4
|
|
Indiana
|
34.6
|
30.5--39.0
|
24.3
|
21.2--27.7
|
29.3
|
26.7--32.2
|
|
58.5
|
54.3--62.5
|
33.3
|
29.7--37.1
|
45.7
|
42.7--48.8
|
|
Kansas
|
35.6
|
32.1--39.3
|
20.2
|
16.6--24.4
|
27.7
|
25.4--30.1
|
|
58.9
|
54.1--63.6
|
28.1
|
24.4--32.1
|
43.1
|
39.4--46.9
|
|
Kentucky
|
36.5
|
32.9--40.3
|
24.2
|
21.5--27.1
|
30.1
|
27.6--32.8
|
|
60.5
|
56.2--64.6
|
32.3
|
28.1--36.8
|
45.9
|
43.2--48.7
|
|
Louisiana
|
34.5
|
30.0--39.2
|
18.9
|
13.4--26.0
|
27.0
|
23.5--30.9
|
|
60.3
|
51.6--68.4
|
28.3
|
23.1--34.1
|
44.8
|
36.1--53.8
|
|
Maine
|
33.1
|
31.7--34.6
|
26.3
|
25.0--27.7
|
29.7
|
28.7--30.7
|
|
60.0
|
58.5--61.5
|
33.2
|
31.8--34.8
|
46.4
|
45.3--47.5
|
|
Maryland
|
32.5
|
29.1--36.0
|
22.5
|
20.0--25.3
|
27.5
|
24.8--30.3
|
|
55.6
|
51.5--59.6
|
32.3
|
28.8--36.0
|
43.7
|
40.2--47.3
|
|
Massachusetts
|
32.5
|
30.3--34.8
|
25.4
|
22.7--28.4
|
28.8
|
26.8--31.0
|
|
60.0
|
57.3--62.5
|
30.7
|
27.9--33.6
|
45.0
|
42.4--47.6
|
|
Michigan
|
31.6
|
28.5--34.9
|
24.3
|
22.5--26.2
|
27.9
|
25.9--30.0
|
|
58.7
|
55.4--62.0
|
31.1
|
28.7--33.5
|
44.8
|
42.6--46.9
|
|
Mississippi
|
31.0
|
26.7--35.6
|
23.0
|
20.2--26.0
|
27.0
|
24.0--30.1
|
|
55.4
|
50.9--59.8
|
27.6
|
24.3--31.2
|
41.6
|
38.4--44.8
|
|
Missouri
|
35.2
|
32.2--38.3
|
23.3
|
21.3--25.4
|
29.0
|
27.2--30.9
|
|
61.5
|
57.5--65.4
|
30.8
|
28.8--32.9
|
45.8
|
43.3--48.2
|
|
Montana
|
33.4
|
29.6--37.3
|
24.8
|
22.0--27.8
|
28.9
|
26.2--31.7
|
|
58.4
|
53.6--63.0
|
25.8
|
22.8--29.0
|
41.6
|
38.2--45.1
|
|
Nevada
|
33.4
|
30.3--36.7
|
23.8
|
20.6--27.3
|
28.5
|
26.2--30.9
|
|
59.4
|
56.3--62.5
|
32.0
|
28.4--35.8
|
45.3
|
42.6--48.2
|
|
New Hampshire
|
31.5
|
26.9--36.5
|
25.3
|
21.5--29.5
|
28.4
|
25.7--31.2
|
|
59.9
|
55.0--64.7
|
29.1
|
25.7--32.9
|
44.0
|
41.5--46.6
|
|
New Jersey
|
---
|
---
|
---
|
---
|
---
|
---
|
|
---
|
---
|
---
|
---
|
---
|
---
|
|
New Mexico
|
---
|
---
|
---
|
---
|
---
|
---
|
|
---
|
---
|
---
|
---
|
---
|
---
|
|
New York
|
28.8
|
25.7--32.2
|
22.7
|
19.9--25.7
|
26.0
|
23.8--28.3
|
|
56.9
|
53.2--60.6
|
33.2
|
30.1--36.5
|
45.2
|
43.1--47.3
|
|
North Carolina
|
32.9
|
30.4--35.4
|
23.0
|
20.5--25.6
|
28.0
|
26.1--30.1
|
|
61.8
|
58.8--64.6
|
29.8
|
27.6--32.1
|
46.2
|
44.0--48.4
|
|
North Dakota
|
35.5
|
31.9--39.1
|
23.6
|
20.7--26.8
|
29.3
|
27.0--31.8
|
|
58.6
|
54.4--62.6
|
28.9
|
25.6--32.3
|
43.2
|
40.5--45.9
|
|
Oklahoma
|
37.3
|
31.3--43.7
|
20.8
|
17.8--24.3
|
28.9
|
25.8--32.2
|
|
59.6
|
53.0--65.8
|
27.7
|
22.6--33.5
|
43.4
|
39.2--47.7
|
|
Pennsylvania
|
33.8
|
30.3--37.5
|
22.7
|
20.8--24.8
|
28.1
|
25.9--30.4
|
|
62.4
|
59.5--65.3
|
28.2
|
25.8--30.7
|
44.9
|
42.7--47.2
|
|
Rhode Island
|
34.1
|
31.0--37.3
|
21.8
|
19.1--24.8
|
27.8
|
25.6--30.2
|
|
61.0
|
57.7--64.2
|
30.5
|
27.9--33.2
|
45.5
|
43.1--47.9
|
|
South Carolina
|
31.5
|
27.2--36.2
|
23.4
|
19.2--28.1
|
27.5
|
24.0--31.3
|
|
55.4
|
49.5--61.2
|
28.3
|
24.4--32.6
|
41.8
|
38.6--45.1
|
|
South Dakota
|
---
|
---
|
---
|
---
|
---
|
---
|
|
63.7
|
60.8--66.6
|
28.3
|
25.1--31.7
|
45.8
|
43.8--47.8
|
|
Tennessee
|
33.3
|
30.6--36.2
|
22.9
|
19.7--26.5
|
28.1
|
25.5--30.9
|
|
59.1
|
56.1--62.1
|
31.8
|
27.9--35.9
|
45.2
|
41.4--49.0
|
|
Texas
|
32.7
|
30.3--35.2
|
21.9
|
19.7--24.1
|
27.2
|
25.7--28.7
|
|
61.0
|
58.4--63.6
|
31.4
|
28.5--34.4
|
45.9
|
43.9--47.9
|
|
Utah
|
30.0
|
26.7--33.6
|
17.9
|
14.6--21.7
|
23.8
|
21.4--26.4
|
|
59.0
|
54.7--63.1
|
23.8
|
20.5--27.5
|
41.0
|
37.9--44.1
|
|
Vermont
|
33.2
|
31.1--35.4
|
26.6
|
24.2--29.1
|
30.0
|
27.9--32.1
|
|
56.6
|
55.0--58.2
|
28.2
|
26.3--30.2
|
42.1
|
41.0--43.2
|
|
West Virginia
|
33.5
|
29.7--37.6
|
27.9
|
24.7--31.4
|
30.6
|
27.6--33.9
|
|
62.3
|
57.3--67.1
|
35.4
|
31.8--39.2
|
48.4
|
46.4--50.3
|
|
Wisconsin
|
---
|
---
|
---
|
---
|
---
|
---
|
|
58.9
|
56.4--61.4
|
28.0
|
25.1--31.0
|
43.0
|
40.7--45.4
|
|
Wyoming
|
36.4
|
33.9--39.0
|
22.2
|
20.1--24.6
|
29.1
|
27.5--30.8
|
|
59.9
|
57.2--62.6
|
29.4
|
27.0--32.0
|
44.3
|
42.2--46.4
|
|
Median
|
33.0
|
23.3
|
27.9
|
|
59.1
|
29.8
|
44.3
|
|
Range
|
26.1--37.3
|
17.9--27.9
|
21.9--30.6
|
|
52.8--66.4
|
23.8--35.4
|
38.6--50.2
|
|
Local surveys
|
|
|
|
|
|
|
|
|
|
|
|
|
|
|
Boston, MA
|
30.0
|
26.1--34.1
|
23.9
|
20.4--27.8
|
27.0
|
24.0--30.3
|
|
54.0
|
49.3--58.5
|
35.0
|
30.8--39.4
|
44.4
|
41.5--47.5
|
|
Broward County, FL
|
29.3
|
25.5--33.3
|
23.9
|
19.9--28.3
|
26.6
|
23.9--29.5
|
|
53.8
|
50.5--57.1
|
29.9
|
26.1--34.1
|
42.1
|
39.3--45.0
|
|
Charlotte-Mecklenburg, NC
|
33.0
|
29.5--36.6
|
22.0
|
19.0--25.2
|
27.6
|
25.1--30.1
|
|
57.0
|
53.1--60.9
|
30.6
|
26.8--34.7
|
44.0
|
41.1--46.9
|
|
Chicago, IL
|
30.3
|
25.0--36.1
|
22.7
|
19.5--26.2
|
26.8
|
23.0--30.9
|
|
51.4
|
45.3--57.4
|
39.3
|
33.8--45.0
|
45.1
|
40.4--49.9
|
|
Clark County, NV
|
32.4
|
28.7--36.3
|
25.5
|
22.0--29.5
|
28.8
|
26.4--31.4
|
|
60.2
|
56.2--64.1
|
34.8
|
30.5--39.4
|
47.1
|
43.8--50.4
|
|
Dallas, TX
|
35.6
|
30.7--40.8
|
25.4
|
20.8--30.7
|
30.5
|
26.7--34.7
|
|
55.8
|
50.9--60.5
|
35.8
|
28.8--43.6
|
45.8
|
41.5--50.1
|
|
Detroit, MI
|
33.1
|
29.2--37.3
|
24.5
|
20.2--29.4
|
28.9
|
25.9--32.1
|
|
46.9
|
42.7--51.2
|
31.4
|
24.9--38.7
|
39.0
|
34.4--43.8
|
|
Duval County, FL
|
33.4
|
30.6--36.4
|
19.8
|
17.4--22.4
|
26.8
|
24.8--28.9
|
|
53.3
|
50.1--56.5
|
30.6
|
27.0--34.4
|
42.1
|
39.8--44.5
|
|
Los Angeles, CA
|
37.2
|
33.0--41.5
|
29.3
|
24.6--34.5
|
33.1
|
29.8--36.6
|
|
61.9
|
56.1--67.4
|
41.5
|
37.8--45.4
|
51.4
|
48.1--54.6
|
|
Memphis, TN
|
27.3
|
22.9--32.2
|
15.4
|
13.0--18.2
|
21.5
|
18.7--24.7
|
|
47.4
|
43.0--51.9
|
25.1
|
21.3--29.4
|
36.6
|
33.8--39.4
|
|
Miami-Dade County, FL
|
29.5
|
26.4--32.7
|
21.9
|
19.2--24.9
|
25.7
|
23.7--27.8
|
|
53.4
|
50.6--56.2
|
32.7
|
29.7--35.9
|
43.3
|
41.2--45.4
|
|
Milwaukee, WI
|
---
|
---
|
---
|
---
|
---
|
---
|
|
51.9
|
48.9--54.9
|
28.1
|
24.6--31.9
|
40.3
|
38.0--42.7
|
|
New York City, NY
|
28.4
|
26.4--30.5
|
20.9
|
19.3--22.6
|
24.9
|
23.5--26.4
|
|
51.7
|
49.6--53.9
|
34.2
|
32.7--35.9
|
43.7
|
42.3--45.1
|
|
Orange County, FL
|
31.7
|
27.4--36.3
|
22.9
|
19.8--26.4
|
27.3
|
24.4--30.4
|
|
54.4
|
49.3--59.4
|
29.7
|
25.4--34.4
|
42.0
|
38.3--45.9
|
|
Palm Beach County, FL
|
28.8
|
26.0--31.7
|
19.2
|
16.4--22.4
|
24.0
|
22.0--26.1
|
|
54.7
|
51.5--57.8
|
26.6
|
23.4--30.0
|
40.4
|
37.7--43.1
|
|
Philadelphia, PA
|
32.5
|
29.1--36.2
|
22.2
|
18.0--27.1
|
27.8
|
24.6--31.3
|
|
53.4
|
49.0--57.7
|
33.6
|
29.6--37.8
|
44.0
|
41.3--46.7
|
|
San Bernardino, CA
|
34.9
|
31.2--38.7
|
26.6
|
22.7--30.8
|
30.6
|
28.0--33.4
|
|
60.9
|
57.1--64.6
|
38.8
|
33.3--44.6
|
49.7
|
46.1--53.3
|
|
San Diego, CA
|
30.5
|
27.2--34.1
|
22.6
|
19.3--26.2
|
26.4
|
24.0--28.9
|
|
59.2
|
55.7--62.6
|
32.2
|
28.5--36.0
|
45.4
|
42.8--47.9
|
|
San Francisco, CA
|
36.9
|
33.9--39.9
|
24.5
|
22.0--27.2
|
30.8
|
28.8--32.8
|
|
58.6
|
54.8--62.2
|
30.9
|
28.5--33.4
|
44.6
|
42.1--47.1
|
|
Seattle, WA
|
26.8
|
23.7--30.3
|
20.4
|
17.5--23.5
|
23.6
|
21.8--25.5
|
|
49.7
|
46.2--53.2
|
27.6
|
24.3--31.1
|
38.6
|
36.2--41.0
|
|
Median
|
31.7
|
22.7
|
27.0
|
|
53.9
|
31.8
|
43.8
|
|
Range
|
26.8--37.2
|
15.4--29.3
|
21.5--33.1
|
|
46.9--61.9
|
25.1--41.5
|
36.6--51.4
|
|
|
Ate less food, fewer calories, or low-fat foods to lose weight or to keep from gaining weight
|
|
Exercised to lose weight or to keep from gaining weight
|
|
|
Female
|
Male
|
Total
|
|
Female
|
Male
|
Total
|
|
Category
|
%
|
CI†
|
%
|
CI
|
%
|
CI
|
|
%
|
CI
|
%
|
CI
|
%
|
CI
|
|
Race/Ethnicity
|
|
|
|
|
|
|
|
|
|
|
|
|
|
|
White§
|
56.5
|
54.1--58.9
|
28.4
|
26.0--30.9
|
41.4
|
39.3--43.6
|
|
72.2
|
70.1--74.2
|
53.8
|
51.7--55.9
|
62.3
|
60.8--63.9
|
|
Black§
|
35.0
|
30.9--39.5
|
23.2
|
20.4--26.2
|
29.2
|
26.7--31.8
|
|
54.2
|
48.7--59.5
|
51.1
|
47.7--54.5
|
52.6
|
49.8--55.4
|
|
Hispanic
|
48.0
|
45.7--50.4
|
32.8
|
30.2--35.4
|
40.4
|
38.4--42.3
|
|
66.3
|
63.9--68.6
|
64.8
|
62.3--67.2
|
65.6
|
63.8--67.4
|
|
Grade
|
|
|
|
|
|
|
|
|
|
|
|
|
|
|
9
|
49.1
|
46.2--52.0
|
27.5
|
24.2--31.1
|
37.5
|
35.3--39.8
|
|
67.4
|
64.4--70.3
|
57.6
|
55.2--60.0
|
62.2
|
60.1--64.2
|
|
10
|
52.6
|
48.7--56.5
|
26.7
|
24.3--29.3
|
38.9
|
36.9--41.0
|
|
69.6
|
66.5--72.5
|
53.6
|
50.3--56.7
|
61.1
|
58.9--63.3
|
|
11
|
52.7
|
49.7--55.6
|
27.8
|
25.3--30.5
|
39.9
|
37.9--42.0
|
|
67.5
|
64.9--70.0
|
53.6
|
49.4--57.7
|
60.3
|
57.8--62.8
|
|
12
|
52.0
|
49.3--54.6
|
32.4
|
28.3--36.9
|
42.1
|
39.3--45.0
|
|
66.7
|
64.3--69.1
|
58.0
|
53.2--62.7
|
62.3
|
59.3--65.2
|
|
Total
|
51.6
|
49.6--53.5
|
28.4
|
27.0--29.9
|
39.5
|
38.2--41.0
|
|
67.9
|
65.8--69.8
|
55.7
|
54.3--57.1
|
61.5
|
60.2--62.8
|
|
|
Ate less food, fewer calories, or low-fat foods to lose weight or to keep from gaining weight
|
|
Exercised to lose weight or to keep from gaining weight
|
|
|
Female
|
Male
|
Total
|
|
Female
|
Male
|
Total
|
|
Site
|
%
|
CI†
|
%
|
CI
|
%
|
CI
|
|
%
|
CI
|
%
|
CI
|
%
|
CI
|
|
State surveys
|
|
|
|
|
|
|
|
|
|
|
|
|
|
|
Alabama
|
48.1
|
43.4--52.7
|
26.2
|
23.0--29.7
|
37.4
|
34.5--40.5
|
|
65.0
|
61.0--68.8
|
48.4
|
43.6--53.2
|
56.9
|
53.9--59.8
|
|
Alaska
|
47.7
|
43.7--51.7
|
25.8
|
21.9--30.1
|
36.3
|
33.4--39.4
|
|
68.8
|
64.4--72.9
|
56.6
|
53.0--60.1
|
62.5
|
59.4--65.4
|
|
Arizona
|
---§
|
---
|
---
|
---
|
---
|
---
|
|
---
|
---
|
---
|
---
|
---
|
---
|
|
Arkansas
|
49.9
|
45.0--54.9
|
30.4
|
27.2--33.7
|
40.2
|
37.2--43.3
|
|
65.9
|
62.4--69.2
|
51.4
|
47.7--54.9
|
58.6
|
55.9--61.3
|
|
Colorado
|
43.6
|
40.2--47.1
|
21.5
|
17.4--26.4
|
32.4
|
30.0--35.0
|
|
68.7
|
65.1--72.0
|
49.2
|
42.8--55.7
|
58.6
|
54.9--62.2
|
|
Connecticut
|
52.7
|
49.1--56.3
|
25.7
|
22.7--28.8
|
39.1
|
37.2--41.1
|
|
71.3
|
68.2--74.2
|
51.8
|
48.5--55.1
|
61.5
|
59.8--63.1
|
|
Delaware
|
45.6
|
42.3--49.0
|
27.7
|
25.5--30.1
|
36.6
|
34.5--38.8
|
|
58.5
|
55.2--61.7
|
56.7
|
53.5--59.9
|
57.7
|
55.3--60.0
|
|
Florida
|
48.1
|
45.9--50.3
|
27.1
|
25.1--29.3
|
37.5
|
36.0--39.0
|
|
62.6
|
60.6--64.7
|
54.2
|
51.9--56.4
|
58.3
|
56.8--59.8
|
|
Georgia
|
47.3
|
43.0--51.7
|
24.4
|
20.8--28.4
|
36.0
|
32.8--39.3
|
|
66.3
|
63.3--69.2
|
52.4
|
49.1--55.6
|
59.3
|
57.3--61.3
|
|
Hawaii
|
48.3
|
43.3--53.3
|
30.7
|
26.0--35.9
|
39.3
|
36.4--42.3
|
|
70.6
|
62.3--77.7
|
64.4
|
58.5--69.8
|
67.4
|
63.4--71.2
|
|
Idaho
|
52.4
|
49.6--55.3
|
24.4
|
21.3--27.7
|
38.0
|
35.6--40.5
|
|
74.1
|
70.7--77.2
|
50.3
|
46.8--53.8
|
61.8
|
59.2--64.3
|
|
Illinois
|
47.5
|
44.3--50.8
|
27.4
|
24.5--30.5
|
37.2
|
35.0--39.5
|
|
65.7
|
61.9--69.3
|
55.9
|
51.2--60.6
|
60.8
|
57.6--63.9
|
|
Indiana
|
46.2
|
40.9--51.5
|
29.9
|
26.3--33.8
|
38.0
|
34.9--41.3
|
|
62.2
|
58.0--66.2
|
56.8
|
51.7--61.8
|
59.5
|
56.2--62.8
|
|
Kansas
|
52.4
|
47.8--56.9
|
25.5
|
22.4--28.9
|
38.7
|
35.4--42.0
|
|
68.6
|
64.3--72.6
|
50.0
|
46.4--53.6
|
59.1
|
55.7--62.3
|
|
Kentucky
|
52.4
|
47.7--57.0
|
27.1
|
23.1--31.5
|
39.4
|
36.4--42.6
|
|
63.5
|
59.2--67.5
|
50.4
|
45.6--55.2
|
56.7
|
53.2--60.1
|
|
Louisiana
|
51.2
|
46.0--56.4
|
25.6
|
20.0--32.2
|
38.8
|
33.3--44.7
|
|
67.8
|
60.4--74.3
|
46.2
|
41.2--51.3
|
57.7
|
50.3--64.6
|
|
Maine
|
52.8
|
51.2--54.4
|
28.8
|
27.4--30.3
|
40.6
|
39.5--41.7
|
|
69.6
|
68.1--71.1
|
53.4
|
51.7--55.1
|
61.4
|
60.2--62.5
|
|
Maryland
|
45.9
|
41.4--50.5
|
27.2
|
23.2--31.8
|
36.4
|
32.5--40.6
|
|
65.9
|
61.1--70.3
|
54.6
|
51.0--58.2
|
60.1
|
56.6--63.5
|
|
Massachusetts
|
49.1
|
46.3--51.8
|
29.4
|
27.2--31.7
|
39.0
|
36.8--41.2
|
|
65.3
|
62.2--68.2
|
52.3
|
49.0--55.6
|
58.7
|
56.0--61.3
|
|
Michigan
|
50.6
|
47.0--54.1
|
27.0
|
24.2--30.0
|
38.7
|
36.2--41.3
|
|
68.8
|
64.5--72.7
|
56.3
|
53.5--59.0
|
62.5
|
59.5--65.4
|
|
Mississippi
|
48.6
|
43.0--54.3
|
27.4
|
24.5--30.5
|
38.1
|
35.0--41.3
|
|
61.6
|
58.0--65.0
|
55.7
|
51.9--59.3
|
58.6
|
55.7--61.4
|
|
Missouri
|
56.0
|
51.5--60.4
|
26.3
|
23.9--28.8
|
40.8
|
37.8--43.9
|
|
73.0
|
68.0--77.5
|
54.9
|
51.3--58.4
|
63.7
|
60.6--66.7
|
|
Montana
|
51.5
|
47.9--55.1
|
25.9
|
22.0--30.4
|
38.4
|
35.1--41.8
|
|
71.3
|
66.9--75.3
|
52.5
|
49.3--55.6
|
61.6
|
58.7--64.4
|
|
Nevada
|
46.4
|
43.2--49.7
|
24.9
|
21.5--28.6
|
35.5
|
32.8--38.2
|
|
67.7
|
63.7--71.4
|
59.6
|
56.9--62.3
|
63.5
|
61.0--65.9
|
|
New Hampshire
|
53.4
|
49.5--57.3
|
28.4
|
25.5--31.5
|
40.6
|
38.4--42.8
|
|
68.1
|
62.9--72.9
|
52.3
|
49.3--55.3
|
59.9
|
57.2--62.7
|
|
New Jersey
|
---
|
---
|
---
|
---
|
---
|
---
|
|
---
|
---
|
---
|
---
|
---
|
---
|
|
New Mexico
|
41.4
|
39.3--43.6
|
31.3
|
27.6--35.2
|
36.3
|
33.9--38.9
|
|
64.8
|
61.6--67.8
|
63.3
|
60.3--66.3
|
64.1
|
61.8--66.3
|
|
New York
|
49.2
|
46.2--52.2
|
27.8
|
24.9--31.0
|
38.5
|
36.6--40.4
|
|
64.8
|
62.1--67.3
|
57.7
|
55.2--60.2
|
61.3
|
59.8--62.8
|
|
North Carolina
|
45.8
|
41.7--50.0
|
26.1
|
23.9--28.3
|
36.2
|
34.0--38.6
|
|
67.5
|
63.7--71.1
|
55.9
|
52.4--59.2
|
61.9
|
59.3--64.5
|
|
North Dakota
|
53.9
|
50.3--57.5
|
23.8
|
21.3--26.4
|
38.4
|
36.0--40.8
|
|
71.5
|
68.1--74.6
|
51.5
|
47.6--55.4
|
61.1
|
58.4--63.8
|
|
Oklahoma
|
52.1
|
45.6--58.6
|
28.4
|
23.5--33.9
|
40.0
|
36.5--43.6
|
|
64.7
|
59.7--69.3
|
51.9
|
47.0--56.7
|
58.3
|
55.0--61.6
|
|
Pennsylvania
|
55.5
|
51.8--59.1
|
26.1
|
23.2--29.3
|
40.4
|
38.2--42.6
|
|
71.9
|
68.1--75.3
|
53.7
|
49.6--57.8
|
62.6
|
59.9--65.2
|
|
Rhode Island
|
52.0
|
48.8--55.2
|
28.9
|
27.1--30.8
|
40.2
|
38.2--42.2
|
|
71.1
|
67.4--74.6
|
55.4
|
52.2--58.5
|
63.2
|
60.8--65.5
|
|
South Carolina
|
45.9
|
41.3--50.6
|
25.0
|
20.6--29.9
|
35.5
|
32.1--39.0
|
|
63.6
|
59.7--67.4
|
49.9
|
42.5--57.3
|
56.7
|
53.1--60.4
|
|
South Dakota
|
51.9
|
46.7--57.0
|
24.8
|
21.7--28.1
|
38.2
|
35.5--40.9
|
|
69.8
|
66.3--73.1
|
50.1
|
46.6--53.5
|
59.9
|
57.5--62.1
|
|
Tennessee
|
49.6
|
46.3--52.9
|
25.3
|
22.2--28.5
|
37.2
|
33.9--40.5
|
|
63.8
|
60.5--66.9
|
54.1
|
50.4--57.8
|
58.8
|
56.3--61.2
|
|
Texas
|
53.9
|
50.7--57.0
|
28.7
|
26.2--31.3
|
41.1
|
38.6--43.7
|
|
68.8
|
65.7--71.7
|
57.7
|
55.0--60.3
|
63.1
|
60.9--65.3
|
|
Utah
|
49.1
|
43.3--54.9
|
21.7
|
18.3--25.5
|
35.0
|
31.7--38.6
|
|
72.4
|
67.4--76.8
|
46.4
|
41.9--50.9
|
59.0
|
56.5--61.5
|
|
Vermont
|
---
|
---
|
---
|
---
|
---
|
---
|
|
---
|
---
|
---
|
---
|
---
|
---
|
|
West Virginia
|
53.0
|
49.4--56.5
|
30.3
|
26.1--34.8
|
41.5
|
39.3--43.8
|
|
68.8
|
65.7--71.8
|
56.2
|
52.5--59.8
|
62.2
|
59.7--64.7
|
|
Wisconsin
|
---
|
---
|
---
|
---
|
---
|
---
|
|
---
|
---
|
---
|
---
|
---
|
---
|
|
Wyoming
|
48.4
|
45.9--50.9
|
25.7
|
23.2--28.4
|
36.7
|
34.9--38.6
|
|
69.9
|
67.3--72.3
|
51.9
|
48.8--54.9
|
60.6
|
58.5--62.7
|
|
Median
|
49.4
|
26.6
|
38.3
|
|
67.9
|
53.5
|
60.3
|
|
Range
|
41.4--56.0
|
21.5--31.3
|
32.4--41.5
|
|
58.5--74.1
|
46.2--64.4
|
56.7--67.4
|
|
Local surveys
|
|
|
|
|
|
|
|
|
|
|
|
|
|
|
Boston, MA
|
37.8
|
33.8--42.0
|
26.2
|
22.4--30.3
|
32.2
|
29.1--35.4
|
|
48.8
|
44.9--52.7
|
51.2
|
47.2--55.2
|
49.8
|
46.6--52.9
|
|
Broward County, FL
|
47.4
|
43.4--51.5
|
27.8
|
24.4--31.4
|
37.8
|
35.2--40.5
|
|
63.2
|
59.3--67.0
|
53.3
|
49.5--57.1
|
58.3
|
55.9--60.8
|
|
Charlotte-Mecklenburg, NC
|
48.0
|
44.0--52.1
|
26.3
|
23.3--29.5
|
37.3
|
34.9--39.8
|
|
64.6
|
60.7--68.3
|
54.2
|
49.7--58.6
|
59.5
|
56.4--62.5
|
|
Chicago, IL
|
40.1
|
35.4--45.0
|
29.5
|
25.9--33.4
|
34.7
|
31.6--37.8
|
|
56.2
|
49.7--62.5
|
60.0
|
55.8--64.0
|
58.2
|
55.0--61.3
|
|
Clark County, NV
|
45.7
|
41.6--49.8
|
25.9
|
22.0--30.2
|
35.6
|
32.3--38.9
|
|
66.4
|
61.2--71.2
|
61.6
|
58.3--64.7
|
63.9
|
60.8--66.9
|
|
Dallas, TX
|
38.7
|
33.6--44.0
|
35.6
|
28.9--43.0
|
37.1
|
33.4--41.0
|
|
56.8
|
51.2--62.2
|
61.3
|
54.4--67.7
|
59.1
|
55.6--62.5
|
|
Detroit, MI
|
37.5
|
33.9--41.3
|
25.4
|
20.4--31.1
|
31.4
|
28.3--34.8
|
|
50.5
|
47.2--53.8
|
50.7
|
44.8--56.5
|
50.5
|
47.0--53.9
|
|
Duval County, FL
|
46.5
|
43.3--49.7
|
28.4
|
25.1--32.0
|
37.7
|
35.3--40.1
|
|
60.1
|
57.2--62.9
|
53.5
|
50.3--56.8
|
56.9
|
54.8--58.9
|
|
Los Angeles, CA
|
45.5
|
42.9--48.2
|
30.8
|
27.1--34.7
|
37.9
|
35.1--40.7
|
|
65.5
|
60.5--70.2
|
60.4
|
57.1--63.7
|
62.9
|
60.3--65.4
|
|
Memphis, TN
|
40.2
|
36.3--44.1
|
27.0
|
23.0--31.4
|
33.9
|
31.3--36.5
|
|
50.6
|
46.3--54.8
|
56.7
|
51.9--61.4
|
53.7
|
50.4--56.9
|
|
Miami-Dade County, FL
|
48.4
|
45.5--51.3
|
32.5
|
29.0--36.2
|
40.6
|
38.5--42.7
|
|
60.7
|
57.4--63.9
|
60.2
|
57.1--63.3
|
60.5
|
58.1--62.8
|
|
Milwaukee, WI
|
---
|
---
|
---
|
---
|
---
|
---
|
|
---
|
---
|
---
|
---
|
---
|
---
|
|
New York City, NY
|
38.9
|
37.2--40.7
|
27.1
|
25.7--28.6
|
33.5
|
32.2--34.9
|
|
54.7
|
51.9--57.3
|
57.3
|
55.8--58.9
|
55.9
|
54.2--57.5
|
|
Orange County, FL
|
46.2
|
41.1--51.3
|
24.1
|
20.0--28.8
|
35.1
|
31.2--39.2
|
|
62.8
|
57.4--67.8
|
54.4
|
50.4--58.4
|
58.5
|
54.9--61.9
|
|
Palm Beach County, FL
|
49.0
|
45.6--52.5
|
27.2
|
24.3--30.3
|
37.9
|
35.3--40.6
|
|
63.4
|
59.7--66.9
|
53.6
|
49.6--57.6
|
58.3
|
55.5--61.1
|
|
Philadelphia, PA
|
39.9
|
35.9--44.0
|
27.9
|
23.4--32.8
|
34.2
|
30.9--37.7
|
|
53.4
|
48.7--58.0
|
50.9
|
45.6--56.2
|
52.2
|
48.3--56.0
|
|
San Bernardino, CA
|
44.6
|
40.6--48.7
|
31.1
|
27.0--35.6
|
37.8
|
34.8--40.9
|
|
64.2
|
59.8--68.4
|
56.7
|
51.8--61.4
|
60.5
|
56.9--63.9
|
|
San Diego, CA
|
47.3
|
43.8--50.9
|
29.8
|
26.1--33.9
|
38.3
|
35.8--41.0
|
|
67.9
|
64.5--71.1
|
59.5
|
55.6--63.2
|
63.5
|
60.9--66.0
|
|
San Francisco, CA
|
39.7
|
36.9--42.6
|
24.0
|
21.5--26.7
|
31.8
|
29.8--34.0
|
|
57.8
|
54.6--61.0
|
51.1
|
48.3--53.8
|
54.3
|
52.0--56.5
|
|
Seattle, WA
|
41.2
|
37.1--45.4
|
24.2
|
21.5--27.0
|
32.5
|
30.0--35.0
|
|
60.0
|
56.3--63.5
|
51.7
|
47.9--55.4
|
55.9
|
53.1--58.6
|
|
Median
|
44.6
|
27.2
|
35.6
|
|
60.1
|
54.4
|
58.3
|
|
Range
|
37.5--49.0
|
24.0--35.6
|
31.4--40.6
|
|
48.8--67.9
|
50.7--61.6
|
49.8--63.9
|
|
|
Did not eat for 24 or more hours to lose weight or to keep from gaining weight
|
|
Took diet pills, powders, or liquids to lose weight or to keep from gaining weight
|
|
|
Female
|
Male
|
Total
|
|
Female
|
Male
|
Total
|
|
Category
|
%
|
CI§
|
%
|
CI
|
%
|
CI
|
|
%
|
CI
|
%
|
CI
|
%
|
CI
|
|
Race/Ethnicity
|
|
|
|
|
|
|
|
|
|
|
|
|
|
|
White¶
|
14.7
|
13.4--16.1
|
6.1
|
4.9--7.7
|
10.1
|
8.9--11.5
|
|
7.0
|
6.1--8.0
|
3.6
|
2.9--4.5
|
5.2
|
4.5--6.0
|
|
Black¶
|
12.8
|
10.3--15.9
|
8.0
|
6.2--10.2
|
10.4
|
8.9--12.1
|
|
3.7
|
2.8--4.8
|
3.8
|
2.6--5.5
|
3.8
|
2.9--4.8
|
|
Hispanic
|
15.2
|
13.3--17.4
|
8.8
|
7.6--10.2
|
12.0
|
10.9--13.3
|
|
6.9
|
5.9--8.0
|
4.6
|
3.5--6.0
|
5.7
|
4.9--6.7
|
|
Grade
|
|
|
|
|
|
|
|
|
|
|
|
|
|
|
9
|
15.7
|
13.9--17.6
|
6.7
|
5.5--8.3
|
10.9
|
9.6--12.3
|
|
4.7
|
3.8--5.9
|
3.7
|
2.7--5.1
|
4.2
|
3.5--5.1
|
|
10
|
14.5
|
12.6--16.7
|
6.5
|
5.0--8.4
|
10.3
|
8.9--11.9
|
|
6.0
|
4.8--7.5
|
3.0
|
2.2--4.1
|
4.4
|
3.6--5.4
|
|
11
|
14.8
|
12.4--17.5
|
7.2
|
5.9--8.7
|
10.9
|
9.6--12.4
|
|
8.1
|
6.6--9.9
|
4.0
|
3.0--5.3
|
6.0
|
5.1--7.1
|
|
12
|
12.6
|
10.6--14.8
|
7.3
|
5.6--9.5
|
9.9
|
8.4--11.6
|
|
6.6
|
5.0--8.7
|
4.6
|
3.6--6.0
|
5.6
|
4.6--6.9
|
|
Total
|
14.5
|
13.4--15.7
|
6.9
|
6.0--7.9
|
10.6
|
9.7--11.5
|
|
6.3
|
5.7--7.0
|
3.8
|
3.2--4.5
|
5.0
|
4.5--5.5
|
|
|
Did not eat for 24 or more hours to lose weight or to keep from gaining weight
|
|
Took diet pills, powders, or liquids to lose weight or to keep from gaining weight
|
|
|
Female
|
Male
|
Total
|
|
Female
|
Male
|
Total
|
|
Site
|
%
|
CI§
|
%
|
CI
|
%
|
CI
|
|
%
|
CI
|
%
|
CI
|
%
|
CI
|
|
State surveys
|
|
|
|
|
|
|
|
|
|
|
|
|
|
|
Alabama
|
16.0
|
13.1--19.5
|
8.8
|
5.7--13.2
|
12.5
|
9.9--15.7
|
|
8.3
|
6.1--11.3
|
9.6
|
7.0--12.9
|
9.1
|
7.7--10.8
|
|
Alaska
|
---¶
|
---
|
---
|
---
|
---
|
---
|
|
---
|
---
|
---
|
---
|
---
|
---
|
|
Arizona
|
17.8
|
15.2--20.7
|
9.3
|
7.3--11.9
|
13.7
|
11.6--15.9
|
|
8.3
|
7.0--9.7
|
6.1
|
4.3--8.5
|
7.2
|
6.1--8.4
|
|
Arkansas
|
20.3
|
16.2--25.1
|
12.8
|
9.5--17.0
|
16.6
|
14.2--19.3
|
|
10.2
|
7.3--14.2
|
10.8
|
7.3--15.7
|
10.5
|
8.4--13.2
|
|
Colorado
|
14.5
|
12.6--16.7
|
5.3
|
3.6--7.5
|
9.8
|
8.6--11.2
|
|
5.8
|
4.5--7.6
|
3.4
|
2.2--5.3
|
4.7
|
3.8--5.8
|
|
Connecticut
|
12.0
|
10.2--14.2
|
6.2
|
4.6--8.4
|
9.1
|
7.8--10.7
|
|
---
|
---
|
---
|
---
|
---
|
---
|
|
Delaware
|
15.4
|
13.2--17.9
|
8.1
|
6.7--9.9
|
11.9
|
10.5--13.4
|
|
4.4
|
3.2--6.2
|
3.4
|
2.4--4.7
|
4.0
|
3.2--5.0
|
|
Florida
|
13.0
|
11.6--14.5
|
6.8
|
5.9--7.9
|
9.9
|
8.9--10.9
|
|
5.7
|
4.6--6.9
|
4.6
|
3.8--5.6
|
5.1
|
4.4--6.0
|
|
Georgia
|
14.3
|
12.5--16.3
|
9.8
|
7.3--13.0
|
12.0
|
10.3--14.0
|
|
7.7
|
6.0--9.7
|
6.5
|
4.7--8.8
|
7.1
|
5.6--8.9
|
|
Hawaii
|
15.1
|
12.7--17.9
|
8.5
|
5.9--12.1
|
11.8
|
9.6--14.5
|
|
5.8
|
4.0--8.3
|
5.4
|
3.8--7.5
|
5.6
|
4.5--7.0
|
|
Idaho
|
13.5
|
10.8--16.8
|
7.2
|
5.7--9.0
|
10.3
|
8.7--12.2
|
|
7.2
|
5.6--9.1
|
3.9
|
2.8--5.4
|
5.6
|
4.6--6.7
|
|
Illinois
|
12.8
|
11.2--14.6
|
7.8
|
5.9--10.2
|
10.3
|
8.8--11.9
|
|
6.3
|
5.1--7.8
|
5.4
|
3.9--7.3
|
5.9
|
4.8--7.2
|
|
Indiana
|
17.5
|
14.1--21.4
|
9.1
|
6.7--12.2
|
13.2
|
11.5--15.0
|
|
5.7
|
4.2--7.8
|
3.8
|
2.5--5.7
|
4.9
|
3.9--6.1
|
|
Kansas
|
14.9
|
12.6--17.5
|
7.4
|
5.5--9.9
|
11.0
|
9.3--13.0
|
|
5.6
|
4.1--7.6
|
3.3
|
2.3--4.7
|
4.4
|
3.4--5.8
|
|
Kentucky
|
16.1
|
13.9--18.5
|
9.1
|
7.2--11.4
|
12.5
|
10.9--14.2
|
|
7.5
|
5.2--10.8
|
6.5
|
4.4--9.4
|
7.0
|
5.3--9.1
|
|
Louisiana
|
13.6
|
10.3--17.7
|
12.3
|
8.1--18.1
|
13.0
|
10.2--16.6
|
|
7.9
|
5.1--11.9
|
8.1
|
4.3--14.8
|
8.0
|
5.3--11.8
|
|
Maine
|
15.4
|
14.3--16.6
|
9.2
|
8.3--10.2
|
12.4
|
11.6--13.2
|
|
5.3
|
4.7--6.1
|
6.0
|
5.3--6.9
|
5.8
|
5.2--6.4
|
|
Maryland
|
14.3
|
11.7--17.3
|
7.2
|
5.9--8.9
|
10.7
|
9.3--12.3
|
|
5.1
|
3.5--7.4
|
5.5
|
4.2--7.3
|
5.4
|
4.1--7.0
|
|
Massachusetts
|
10.3
|
8.4--12.5
|
6.3
|
4.6--8.5
|
8.2
|
6.8--9.9
|
|
4.9
|
4.0--6.1
|
5.2
|
3.8--7.2
|
5.1
|
4.1--6.3
|
|
Michigan
|
16.0
|
13.9--18.4
|
9.9
|
7.5--13.1
|
13.1
|
11.3--15.0
|
|
7.4
|
5.8--9.6
|
7.1
|
5.7--8.8
|
7.3
|
6.0--8.9
|
|
Mississippi
|
15.1
|
12.3--18.4
|
6.3
|
4.6--8.6
|
10.8
|
9.4--12.3
|
|
6.8
|
4.8--9.5
|
4.5
|
3.3--6.0
|
5.7
|
4.4--7.4
|
|
Missouri
|
15.2
|
11.3--20.2
|
5.7
|
3.8--8.4
|
10.3
|
7.9--13.4
|
|
6.2
|
4.5--8.5
|
3.7
|
2.4--5.5
|
4.9
|
3.7--6.4
|
|
Montana
|
14.6
|
11.6--18.2
|
7.2
|
5.0--10.3
|
10.8
|
8.7--13.5
|
|
6.8
|
4.7--9.8
|
4.7
|
2.8--7.8
|
5.8
|
4.0--8.3
|
|
Nevada
|
13.8
|
11.6--16.3
|
7.5
|
5.6--9.9
|
10.6
|
9.0--12.3
|
|
7.0
|
5.6--8.6
|
4.1
|
2.8--5.9
|
5.5
|
4.5--6.6
|
|
New Hampshire
|
13.1
|
10.1--16.7
|
4.5
|
3.4--6.1
|
8.8
|
7.2--10.7
|
|
6.0
|
4.3--8.3
|
4.1
|
2.7--6.2
|
5.1
|
3.9--6.6
|
|
New Jersey
|
---
|
---
|
---
|
---
|
---
|
---
|
|
---
|
---
|
---
|
---
|
---
|
---
|
|
New Mexico
|
---
|
---
|
---
|
---
|
---
|
---
|
|
---
|
---
|
---
|
---
|
---
|
---
|
|
New York
|
---
|
---
|
---
|
---
|
---
|
---
|
|
---
|
---
|
---
|
---
|
---
|
---
|
|
North Carolina
|
---
|
---
|
---
|
---
|
---
|
---
|
|
6.0
|
4.7--7.6
|
4.1
|
2.9--5.7
|
5.1
|
4.1--6.4
|
|
North Dakota
|
13.2
|
11.3--15.4
|
6.6
|
4.8--9.0
|
9.9
|
8.6--11.5
|
|
6.0
|
4.6--7.8
|
3.1
|
1.8--5.2
|
4.6
|
3.5--6.0
|
|
Oklahoma
|
17.4
|
13.9--21.5
|
8.6
|
5.9--12.6
|
12.9
|
10.7--15.5
|
|
8.1
|
5.9--10.9
|
3.9
|
2.3--6.7
|
6.0
|
4.4--8.0
|
|
Pennsylvania
|
14.0
|
11.5--16.9
|
6.0
|
4.3--8.2
|
9.9
|
8.3--11.7
|
|
5.1
|
3.8--6.7
|
3.2
|
1.9--5.3
|
4.1
|
3.1--5.4
|
|
Rhode Island
|
14.0
|
12.2--16.1
|
7.8
|
6.7--9.1
|
10.9
|
9.9--12.0
|
|
---
|
---
|
---
|
---
|
---
|
---
|
|
South Carolina
|
12.6
|
9.4--16.7
|
6.2
|
4.0--9.4
|
9.5
|
7.8--11.6
|
|
7.2
|
3.7--13.5
|
4.8
|
3.1--7.4
|
6.0
|
4.0--9.0
|
|
South Dakota
|
10.0
|
8.3--12.1
|
5.5
|
3.8--7.7
|
7.7
|
6.7--8.9
|
|
6.4
|
4.7--8.7
|
4.5
|
3.3--6.2
|
5.4
|
4.6--6.5
|
|
Tennessee
|
15.9
|
13.7--18.3
|
8.4
|
6.4--11.0
|
12.2
|
10.6--13.9
|
|
7.3
|
5.9--8.9
|
4.3
|
3.0--6.0
|
5.7
|
4.7--6.9
|
|
Texas
|
17.0
|
15.3--18.8
|
6.6
|
5.1--8.6
|
11.7
|
10.5--13.0
|
|
7.7
|
6.2--9.4
|
4.8
|
3.5--6.5
|
6.2
|
5.2--7.4
|
|
Utah
|
12.5
|
9.8--15.7
|
7.8
|
5.4--11.1
|
10.1
|
8.2--12.5
|
|
5.3
|
3.6--7.9
|
6.0
|
3.9--9.2
|
5.9
|
4.4--7.8
|
|
Vermont
|
---
|
---
|
---
|
---
|
---
|
---
|
|
4.0
|
3.4--4.6
|
2.1
|
1.5--2.8
|
3.0
|
2.6--3.5
|
|
West Virginia
|
18.0
|
15.7--20.7
|
9.4
|
6.8--12.9
|
13.7
|
11.8--16.0
|
|
8.3
|
6.8--10.2
|
5.6
|
3.4--9.2
|
7.0
|
5.4--8.9
|
|
Wisconsin
|
---
|
---
|
---
|
---
|
---
|
---
|
|
---
|
---
|
---
|
---
|
---
|
---
|
|
Wyoming
|
17.0
|
14.9--19.3
|
11.1
|
9.3--13.1
|
13.9
|
12.6--15.4
|
|
6.1
|
4.9--7.5
|
6.9
|
5.6--8.4
|
6.5
|
5.6--7.5
|
|
Median
|
14.6
|
7.8
|
10.9
|
|
6.3
|
4.7
|
5.7
|
|
Range
|
10.0--20.3
|
4.5--12.8
|
7.7--16.6
|
|
4.0--10.2
|
2.1--10.8
|
3.0--10.5
|
|
Local surveys
|
|
|
|
|
|
|
|
|
|
|
|
|
|
|
Boston, MA
|
10.9
|
8.3--14.1
|
8.4
|
5.7--12.1
|
9.6
|
7.6--12.1
|
|
5.4
|
3.7--8.0
|
4.2
|
2.3--7.5
|
4.9
|
3.3--7.2
|
|
Broward County, FL
|
12.0
|
9.9--14.4
|
6.3
|
4.6--8.5
|
9.1
|
7.9--10.4
|
|
6.1
|
4.6--8.0
|
5.9
|
4.3--7.9
|
6.0
|
4.9--7.3
|
|
Charlotte-Mecklenburg, NC
|
---
|
---
|
---
|
---
|
---
|
---
|
|
4.4
|
3.1--6.2
|
4.8
|
3.4--6.7
|
4.6
|
3.6--5.9
|
|
Chicago, IL
|
14.5
|
10.9--19.0
|
15.2
|
10.4--21.7
|
15.1
|
11.9--19.1
|
|
7.1
|
4.9--10.3
|
9.3
|
5.8--14.6
|
8.5
|
5.9--12.1
|
|
Clark County, NV
|
13.6
|
10.9--16.8
|
7.6
|
5.7--9.9
|
10.5
|
8.6--12.7
|
|
6.9
|
5.4--8.8
|
4.2
|
2.7--6.5
|
5.5
|
4.4--6.8
|
|
Dallas, TX
|
10.6
|
6.9--15.8
|
7.6
|
5.0--11.4
|
9.1
|
6.9--12.0
|
|
8.7
|
6.0--12.4
|
4.4
|
2.5--7.7
|
6.8
|
4.9--9.2
|
|
Detroit, MI
|
16.3
|
13.9--19.0
|
14.7
|
11.7--18.3
|
15.5
|
13.5--17.7
|
|
6.2
|
4.9--7.9
|
9.0
|
6.6--12.2
|
7.6
|
6.3--9.3
|
|
Duval County, FL
|
15.1
|
12.9--17.5
|
10.9
|
8.8--13.5
|
13.2
|
11.5--15.2
|
|
7.8
|
6.3--9.8
|
9.1
|
6.8--11.9
|
8.6
|
7.1--10.4
|
|
Los Angeles, CA
|
12.1
|
9.0--16.0
|
9.6
|
7.1--13.0
|
10.8
|
8.7--13.3
|
|
6.8
|
5.3--8.7
|
6.2
|
3.9--9.8
|
6.5
|
4.7--9.0
|
|
Memphis, TN
|
11.6
|
8.9--15.1
|
8.1
|
5.7--11.3
|
9.9
|
8.0--12.2
|
|
3.2
|
1.9--5.4
|
3.5
|
2.1--5.7
|
3.4
|
2.3--5.0
|
|
Miami-Dade County, FL
|
13.7
|
11.9--15.7
|
8.3
|
6.2--10.9
|
11.0
|
9.6--12.6
|
|
6.4
|
5.0--8.2
|
5.8
|
4.4--7.6
|
6.2
|
5.3--7.2
|
|
Milwaukee, WI
|
---
|
---
|
---
|
---
|
---
|
---
|
|
---
|
---
|
---
|
---
|
---
|
---
|
|
New York City, NY
|
---
|
---
|
---
|
---
|
---
|
---
|
|
---
|
---
|
---
|
---
|
---
|
---
|
|
Orange County, FL
|
13.0
|
10.0--16.7
|
4.5
|
3.1--6.6
|
8.8
|
7.0--11.1
|
|
5.2
|
3.5--7.8
|
3.2
|
2.1--5.0
|
4.2
|
3.1--5.7
|
|
Palm Beach County, FL
|
13.9
|
11.0--17.3
|
5.3
|
4.0--7.1
|
9.6
|
7.9--11.6
|
|
5.6
|
4.1--7.6
|
5.0
|
3.7--6.7
|
5.3
|
4.4--6.5
|
|
Philadelphia, PA
|
13.4
|
10.5--16.9
|
7.6
|
5.1--11.3
|
10.9
|
8.6--13.7
|
|
6.2
|
4.1--9.3
|
5.3
|
3.2--8.6
|
5.8
|
4.1--8.1
|
|
San Bernardino, CA
|
14.1
|
11.8--16.7
|
9.3
|
6.8--12.6
|
11.6
|
9.9--13.6
|
|
5.5
|
3.8--7.8
|
4.3
|
2.8--6.5
|
4.9
|
3.8--6.3
|
|
San Diego, CA
|
11.0
|
8.8--13.8
|
7.9
|
5.8--10.6
|
9.4
|
7.8--11.3
|
|
5.6
|
4.0--7.7
|
4.6
|
3.3--6.2
|
5.1
|
4.0--6.4
|
|
San Francisco, CA
|
7.0
|
5.3--9.3
|
5.7
|
4.2--7.8
|
6.5
|
5.1--8.2
|
|
4.5
|
3.2--6.3
|
2.9
|
2.0--4.2
|
3.7
|
2.9--4.7
|
|
Seattle, WA
|
10.1
|
8.0--12.6
|
7.2
|
5.3--9.8
|
8.6
|
7.1--10.3
|
|
4.3
|
3.0--6.0
|
5.4
|
3.9--7.4
|
5.0
|
3.9--6.4
|
|
Median
|
13.0
|
7.9
|
9.9
|
|
5.8
|
4.9
|
5.4
|
|
Range
|
7.0--16.3
|
4.5--15.2
|
6.5--15.5
|
|
3.2--8.7
|
2.9--9.3
|
3.4--8.6
|
|
|
Female
|
Male
|
Total
|
|
Category
|
%
|
CI†
|
%
|
CI
|
%
|
CI
|
|
Race/Ethnicity
|
|
|
|
|
|
|
|
White§
|
5.2
|
4.4--6.1
|
1.8
|
1.3--2.6
|
3.4
|
2.8--4.0
|
|
Black§
|
3.6
|
2.4--5.3
|
4.6
|
3.0--6.9
|
4.1
|
3.1--5.4
|
|
Hispanic
|
6.9
|
5.7--8.2
|
4.0
|
3.0--5.2
|
5.4
|
4.7--6.3
|
|
Grade
|
|
|
|
|
|
|
|
9
|
5.6
|
4.6--6.9
|
2.8
|
1.9--4.0
|
4.1
|
3.5--4.8
|
|
10
|
5.3
|
4.2--6.7
|
2.2
|
1.5--3.3
|
3.7
|
3.1--4.5
|
|
11
|
6.3
|
5.0--7.8
|
2.7
|
2.0--3.8
|
4.5
|
3.7--5.4
|
|
12
|
4.2
|
3.2--5.5
|
2.6
|
1.8--3.6
|
3.4
|
2.7--4.3
|
|
Total
|
5.4
|
4.8--6.0
|
2.6
|
2.1--3.2
|
4.0
|
3.5--4.4
|
|
|
Female
|
Male
|
Total
|
|
Site
|
%
|
CI†
|
%
|
CI
|
%
|
CI
|
|
State surveys
|
|
|
|
|
|
|
|
Alabama
|
5.9
|
4.3--8.1
|
7.0
|
4.4--10.8
|
6.6
|
5.0--8.7
|
|
Alaska
|
---§
|
---
|
---
|
---
|
---
|
---
|
|
Arizona
|
7.4
|
5.8--9.5
|
4.2
|
2.6--6.5
|
5.8
|
4.4--7.5
|
|
Arkansas
|
10.7
|
7.2--15.4
|
7.8
|
4.3--13.8
|
9.3
|
6.8--12.5
|
|
Colorado
|
4.6
|
3.2--6.5
|
2.6
|
1.4--4.7
|
3.6
|
2.7--4.6
|
|
Connecticut
|
---
|
---
|
---
|
---
|
---
|
---
|
|
Delaware
|
5.1
|
3.8--6.9
|
2.4
|
1.5--3.8
|
3.9
|
3.1--4.9
|
|
Florida
|
5.4
|
4.5--6.6
|
3.4
|
2.8--4.2
|
4.5
|
3.9--5.1
|
|
Georgia
|
5.6
|
4.0--7.9
|
5.5
|
4.0--7.6
|
5.6
|
4.3--7.1
|
|
Hawaii
|
8.7
|
6.3--11.9
|
5.3
|
3.5--7.9
|
7.1
|
5.5--9.1
|
|
Idaho
|
5.7
|
4.3--7.4
|
2.7
|
1.7--4.1
|
4.2
|
3.2--5.4
|
|
Illinois
|
6.6
|
5.1--8.5
|
4.5
|
3.3--6.0
|
5.5
|
4.5--6.8
|
|
Indiana
|
7.6
|
5.7--10.0
|
3.4
|
2.1--5.2
|
5.4
|
4.1--7.2
|
|
Kansas
|
5.3
|
3.8--7.3
|
2.2
|
1.3--3.8
|
3.7
|
2.7--5.1
|
|
Kentucky
|
8.2
|
6.0--11.2
|
4.8
|
3.2--7.3
|
6.5
|
5.1--8.4
|
|
Louisiana
|
5.4
|
3.3--8.7
|
8.2
|
4.7--14.1
|
6.7
|
4.4--10.2
|
|
Maine
|
7.2
|
6.5--8.1
|
7.0
|
6.2--8.0
|
7.2
|
6.6--7.9
|
|
Maryland
|
5.9
|
4.4--7.9
|
5.9
|
4.7--7.3
|
5.9
|
4.9--7.0
|
|
Massachusetts
|
5.1
|
3.9--6.5
|
4.5
|
3.3--6.1
|
4.8
|
3.9--5.8
|
|
Michigan
|
8.0
|
6.6--9.6
|
6.3
|
4.5--8.7
|
7.2
|
6.2--8.4
|
|
Mississippi
|
5.3
|
3.7--7.6
|
3.0
|
2.0--4.3
|
4.2
|
3.3--5.3
|
|
Missouri
|
5.2
|
3.9--6.9
|
2.1
|
1.1--3.8
|
3.6
|
2.8--4.7
|
|
Montana
|
6.7
|
5.1--8.8
|
4.0
|
2.3--6.8
|
5.3
|
4.0--6.9
|
|
Nevada
|
8.1
|
6.4--10.2
|
2.8
|
1.9--4.1
|
5.4
|
4.4--6.5
|
|
New Hampshire
|
5.7
|
3.5--9.1
|
2.0
|
1.1--3.7
|
3.9
|
2.7--5.8
|
|
New Jersey
|
---
|
---
|
---
|
---
|
---
|
---
|
|
New Mexico
|
8.0
|
6.2--10.4
|
7.3
|
5.9--9.0
|
7.7
|
6.2--9.5
|
|
New York
|
6.2
|
4.8--7.8
|
5.1
|
3.8--6.9
|
5.9
|
5.0--7.0
|
|
North Carolina
|
6.1
|
5.0--7.3
|
3.5
|
2.5--4.8
|
4.8
|
4.2--5.6
|
|
North Dakota
|
6.9
|
5.2--9.3
|
2.5
|
1.4--4.5
|
4.7
|
3.5--6.3
|
|
Oklahoma
|
5.7
|
4.0--8.0
|
2.2
|
1.2--4.1
|
3.9
|
3.0--5.1
|
|
Pennsylvania
|
5.0
|
3.5--7.1
|
1.9
|
1.0--3.6
|
3.5
|
2.8--4.3
|
|
Rhode Island
|
6.0
|
5.1--7.1
|
5.5
|
3.9--7.6
|
5.7
|
4.9--6.6
|
|
South Carolina
|
5.1
|
3.6--7.2
|
5.1
|
3.5--7.4
|
5.1
|
3.9--6.5
|
|
South Dakota
|
---
|
---
|
---
|
---
|
---
|
---
|
|
Tennessee
|
3.9
|
2.8--5.5
|
3.1
|
2.1--4.5
|
3.5
|
2.6--4.6
|
|
Texas
|
6.2
|
4.9--7.9
|
2.2
|
1.4--3.4
|
4.2
|
3.4--5.1
|
|
Utah
|
4.9
|
3.3--7.2
|
3.8
|
2.2--6.5
|
4.4
|
3.2--6.2
|
|
Vermont
|
5.8
|
4.8--6.9
|
2.2
|
1.7--2.8
|
4.0
|
3.4--4.7
|
|
West Virginia
|
8.4
|
6.8--10.3
|
5.3
|
3.7--7.6
|
6.8
|
5.4--8.5
|
|
Wisconsin
|
---
|
---
|
---
|
---
|
---
|
---
|
|
Wyoming
|
6.8
|
5.7--8.1
|
5.5
|
4.3--7.0
|
6.1
|
5.3--7.1
|
|
Median
|
5.9
|
4.0
|
5.3
|
|
Range
|
3.9--10.7
|
1.9--8.2
|
3.5--9.3
|
|
Local surveys
|
|
|
|
|
|
|
|
Boston, MA
|
4.3
|
2.7--6.6
|
4.5
|
2.7--7.3
|
4.3
|
3.0--6.2
|
|
Broward County, FL
|
6.6
|
4.4--9.7
|
3.5
|
2.4--5.1
|
5.0
|
3.6--7.0
|
|
Charlotte-Mecklenburg, NC
|
5.6
|
4.0--7.7
|
4.3
|
2.8--6.5
|
4.9
|
3.7--6.4
|
|
Chicago, IL
|
5.9
|
3.9--8.7
|
8.5
|
5.1--14.0
|
7.3
|
5.3--10.1
|
|
Clark County, NV
|
8.4
|
6.4--11.1
|
3.0
|
1.9--4.6
|
5.6
|
4.4--7.1
|
|
Dallas, TX
|
4.6
|
3.0--7.0
|
3.6
|
2.2--5.9
|
4.1
|
2.9--5.7
|
|
Detroit, MI
|
6.8
|
5.2--8.8
|
11.0
|
7.9--15.0
|
8.9
|
6.9--11.2
|
|
Duval County, FL
|
8.3
|
6.7--10.4
|
8.4
|
6.5--10.9
|
8.6
|
7.1--10.4
|
|
Los Angeles, CA
|
7.2
|
5.5--9.4
|
6.8
|
4.3--10.5
|
7.0
|
5.2--9.5
|
|
Memphis, TN
|
3.3
|
2.1--5.2
|
3.1
|
1.9--5.1
|
3.3
|
2.4--4.5
|
|
Miami-Dade County, FL
|
5.9
|
4.4--8.0
|
3.6
|
2.4--5.3
|
4.8
|
3.7--6.2
|
|
Milwaukee, WI
|
---
|
---
|
---
|
---
|
---
|
---
|
|
New York City, NY
|
5.1
|
4.3--5.9
|
5.0
|
4.0--6.1
|
5.0
|
4.5--5.6
|
|
Orange County, FL
|
6.2
|
4.2--9.0
|
2.1
|
1.1--4.2
|
4.2
|
2.9--6.0
|
|
Palm Beach County, FL
|
5.0
|
3.8--6.6
|
3.2
|
2.4--4.4
|
4.1
|
3.3--5.1
|
|
Philadelphia, PA
|
7.0
|
4.5--10.7
|
5.0
|
2.3--10.5
|
6.2
|
3.8--9.8
|
|
San Bernardino, CA
|
4.4
|
3.3--5.8
|
2.7
|
1.6--4.7
|
3.5
|
2.7--4.6
|
|
San Diego, CA
|
6.1
|
4.7--7.9
|
4.2
|
2.8--6.1
|
5.1
|
4.1--6.3
|
|
San Francisco, CA
|
4.6
|
3.3--6.4
|
3.0
|
2.1--4.5
|
3.9
|
3.0--5.0
|
|
Seattle, WA
|
4.1
|
2.9--5.8
|
5.2
|
3.8--7.1
|
4.6
|
3.7--5.8
|
|
Median
|
5.9
|
4.2
|
4.9
|
|
Range
|
3.3--8.4
|
2.1--11.0
|
3.3--8.9
|
|
|
Ever had asthma*
|
|
Current asthma†
|
|
|
Female
|
Male
|
Total
|
|
Female
|
Male
|
Total
|
|
Category
|
%
|
CI§
|
%
|
CI
|
%
|
CI
|
|
%
|
CI
|
%
|
CI
|
%
|
CI
|
|
Race/Ethnicity
|
|
|
|
|
|
|
|
|
|
|
|
|
|
|
White¶
|
21.7
|
19.5--24.0
|
21.8
|
19.8--24.0
|
21.8
|
20.2--23.4
|
|
12.1
|
10.6--13.9
|
9.6
|
8.2--11.3
|
10.8
|
9.5--12.3
|
|
Black¶
|
20.8
|
18.7--23.0
|
26.4
|
23.8--29.3
|
23.6
|
21.5--25.7
|
|
11.9
|
9.9--14.2
|
13.1
|
10.9--15.7
|
12.5
|
10.9--14.3
|
|
Hispanic
|
18.7
|
16.8--20.7
|
21.5
|
18.3--25.0
|
20.1
|
18.0--22.4
|
|
9.6
|
8.3--11.1
|
8.2
|
6.7--10.1
|
9.0
|
7.8--10.3
|
|
Grade
|
|
|
|
|
|
|
|
|
|
|
|
|
|
|
9
|
22.1
|
19.8--24.6
|
23.1
|
20.8--25.6
|
22.7
|
21.1--24.4
|
|
11.9
|
10.5--13.4
|
10.6
|
9.0--12.6
|
11.3
|
10.1--12.5
|
|
10
|
20.3
|
18.0--22.7
|
22.0
|
19.5--24.7
|
21.2
|
19.4--23.1
|
|
11.0
|
9.3--12.9
|
9.8
|
8.1--11.9
|
10.4
|
9.2--11.6
|
|
11
|
21.3
|
19.2--23.5
|
23.4
|
20.7--26.2
|
22.4
|
20.8--24.0
|
|
12.0
|
10.4--13.9
|
10.0
|
8.3--11.9
|
11.0
|
9.9--12.2
|
|
12
|
20.7
|
18.4--23.1
|
22.6
|
20.1--25.3
|
21.6
|
20.0--23.4
|
|
11.5
|
9.5--13.9
|
9.1
|
7.7--10.7
|
10.3
|
8.9--11.8
|
|
Total
|
21.1
|
19.7--22.6
|
22.8
|
21.1--24.5
|
22.0
|
20.8--23.1
|
|
11.6
|
10.6--12.7
|
10.0
|
8.9--11.2
|
10.8
|
9.9--11.7
|
|
|
Ever had asthma*
|
|
Current asthma†
|
|
|
Female
|
Male
|
Total
|
|
Female
|
Male
|
Total
|
|
Site
|
%
|
CI§
|
%
|
CI
|
%
|
CI
|
|
%
|
CI
|
%
|
CI
|
%
|
CI
|
|
State surveys
|
|
|
|
|
|
|
|
|
|
|
|
|
|
|
Alabama
|
22.6
|
19.5--26.0
|
28.2
|
25.3--31.3
|
25.5
|
22.9--28.4
|
|
11.2
|
8.9--13.9
|
10.9
|
9.0--13.2
|
11.0
|
9.3--13.0
|
|
Alaska
|
19.7
|
16.9--22.8
|
17.2
|
14.7--20.0
|
18.5
|
16.7--20.5
|
|
9.8
|
7.6--12.4
|
6.3
|
4.7--8.4
|
7.9
|
6.5--9.7
|
|
Arizona
|
19.1
|
15.5--23.2
|
22.7
|
19.6--26.1
|
20.9
|
18.4--23.6
|
|
7.9
|
5.9--10.6
|
9.2
|
6.9--12.2
|
8.6
|
6.9--10.7
|
|
Arkansas
|
21.7
|
18.1--25.9
|
24.7
|
22.0--27.7
|
23.2
|
21.0--25.6
|
|
10.0
|
7.4--13.4
|
9.7
|
7.4--12.7
|
9.9
|
8.0--12.2
|
|
Colorado
|
21.7
|
18.6--25.3
|
21.9
|
17.9--26.4
|
21.7
|
19.2--24.4
|
|
12.8
|
9.6--16.9
|
11.8
|
8.9--15.6
|
12.2
|
10.1--14.8
|
|
Connecticut
|
---¶
|
---
|
---
|
---
|
---
|
---
|
|
---
|
---
|
---
|
---
|
---
|
---
|
|
Delaware
|
---
|
---
|
---
|
---
|
---
|
---
|
|
---
|
---
|
---
|
---
|
---
|
---
|
|
Florida
|
19.2
|
17.9--20.6
|
22.3
|
20.8--23.8
|
20.7
|
19.6--21.8
|
|
9.6
|
8.8--10.6
|
8.4
|
7.6--9.2
|
9.0
|
8.4--9.7
|
|
Georgia
|
24.8
|
21.2--28.9
|
27.1
|
23.9--30.6
|
26.0
|
23.1--29.1
|
|
13.7
|
11.3--16.6
|
8.7
|
6.8--11.0
|
11.3
|
9.9--12.7
|
|
Hawaii
|
27.6
|
24.1--31.3
|
29.1
|
25.8--32.8
|
28.3
|
25.9--30.8
|
|
13.7
|
11.1--16.8
|
11.9
|
9.6--14.6
|
12.7
|
10.7--15.0
|
|
Idaho
|
19.2
|
16.6--22.1
|
16.1
|
13.8--18.7
|
17.6
|
16.1--19.3
|
|
9.9
|
8.5--11.5
|
7.3
|
5.9--8.9
|
8.5
|
7.5--9.6
|
|
Illinois
|
21.6
|
18.5--25.0
|
22.9
|
19.9--26.2
|
22.2
|
19.8--24.9
|
|
11.6
|
9.6--13.9
|
8.2
|
6.6--10.0
|
9.8
|
8.5--11.4
|
|
Indiana
|
23.9
|
19.8--28.6
|
23.4
|
19.5--27.8
|
23.6
|
20.4--27.2
|
|
13.3
|
9.6--18.1
|
11.2
|
9.0--13.9
|
12.2
|
10.0--14.8
|
|
Kansas
|
21.7
|
19.7--23.9
|
20.5
|
18.0--23.3
|
21.1
|
19.4--22.9
|
|
13.6
|
11.4--16.1
|
9.3
|
7.5--11.4
|
11.4
|
9.9--13.1
|
|
Kentucky
|
23.8
|
20.7--27.3
|
24.8
|
20.9--29.0
|
24.3
|
22.1--26.6
|
|
10.8
|
8.8--13.3
|
8.7
|
6.7--11.1
|
9.7
|
8.4--11.2
|
|
Louisiana
|
20.8
|
16.9--25.4
|
24.1
|
21.2--27.3
|
22.4
|
19.6--25.5
|
|
11.4
|
9.1--14.1
|
10.3
|
7.7--13.7
|
10.9
|
8.7--13.7
|
|
Maine
|
25.9
|
24.5--27.4
|
26.6
|
25.2--28.1
|
26.3
|
25.3--27.3
|
|
13.9
|
12.8--15.2
|
12.3
|
11.2--13.5
|
13.1
|
12.3--13.9
|
|
Maryland
|
24.3
|
21.3--27.6
|
28.0
|
24.1--32.4
|
26.1
|
22.9--29.6
|
|
13.1
|
10.6--16.2
|
10.6
|
8.7--12.8
|
11.8
|
10.3--13.6
|
|
Massachusetts
|
---
|
---
|
---
|
---
|
---
|
---
|
|
---
|
---
|
---
|
---
|
---
|
---
|
|
Michigan
|
23.2
|
20.6--25.9
|
23.4
|
21.3--25.6
|
23.3
|
21.6--25.1
|
|
13.6
|
11.9--15.5
|
9.6
|
8.3--11.2
|
11.6
|
10.6--12.7
|
|
Mississippi
|
16.7
|
14.5--19.1
|
19.7
|
17.4--22.2
|
18.2
|
16.2--20.3
|
|
10.1
|
8.5--12.0
|
9.7
|
7.1--13.0
|
9.9
|
8.3--11.7
|
|
Missouri
|
19.7
|
17.7--21.9
|
21.6
|
18.7--24.8
|
20.6
|
19.0--22.4
|
|
12.9
|
10.6--15.6
|
10.4
|
8.1--13.3
|
11.6
|
10.4--13.0
|
|
Montana
|
19.0
|
16.2--22.1
|
19.9
|
16.4--23.8
|
19.5
|
17.1--22.1
|
|
13.0
|
10.7--15.8
|
7.9
|
6.0--10.4
|
10.4
|
8.8--12.2
|
|
Nevada
|
20.2
|
18.0--22.7
|
18.7
|
16.2--21.4
|
19.4
|
17.5--21.5
|
|
9.9
|
8.0--12.2
|
6.8
|
5.2--8.8
|
8.3
|
7.0--9.8
|
|
New Hampshire
|
---
|
---
|
---
|
---
|
---
|
---
|
|
---
|
---
|
---
|
---
|
---
|
---
|
|
New Jersey
|
25.0
|
21.9--28.5
|
22.9
|
19.1--27.2
|
24.2
|
21.5--27.1
|
|
13.4
|
10.8--16.5
|
11.0
|
8.7--13.7
|
12.2
|
10.1--14.7
|
|
New Mexico
|
25.6
|
22.8--28.5
|
25.0
|
22.0--28.2
|
25.3
|
22.9--27.9
|
|
13.2
|
11.1--15.5
|
9.7
|
8.0--11.7
|
11.4
|
9.8--13.3
|
|
New York
|
22.5
|
19.9--25.3
|
24.0
|
21.0--27.2
|
23.2
|
21.0--25.4
|
|
---
|
---
|
---
|
---
|
---
|
---
|
|
North Carolina
|
21.3
|
19.0--23.8
|
22.3
|
20.0--24.7
|
21.8
|
20.0--23.7
|
|
12.2
|
10.6--14.1
|
9.3
|
7.6--11.3
|
10.8
|
9.3--12.4
|
|
North Dakota
|
20.0
|
17.3--23.0
|
19.7
|
16.9--22.7
|
19.8
|
17.9--21.9
|
|
11.3
|
9.5--13.5
|
9.4
|
7.6--11.7
|
10.3
|
9.0--11.8
|
|
Oklahoma
|
20.6
|
16.9--24.9
|
22.6
|
18.4--27.3
|
21.6
|
18.2--25.4
|
|
11.2
|
8.5--14.7
|
11.8
|
9.2--14.9
|
11.5
|
9.5--14.0
|
|
Pennsylvania
|
23.5
|
19.9--27.5
|
20.4
|
17.1--24.2
|
22.0
|
19.1--25.1
|
|
14.5
|
11.9--17.6
|
8.7
|
5.7--13.3
|
11.6
|
9.1--14.6
|
|
Rhode Island
|
22.6
|
20.9--24.3
|
22.6
|
20.3--25.0
|
22.5
|
21.0--24.1
|
|
13.1
|
11.0--15.6
|
10.4
|
8.5--12.7
|
11.7
|
10.1--13.6
|
|
South Carolina
|
20.1
|
15.8--25.1
|
23.2
|
18.6--28.5
|
21.7
|
18.9--24.7
|
|
8.8
|
6.6--11.6
|
10.6
|
7.5--14.8
|
9.7
|
7.6--12.3
|
|
South Dakota
|
14.9
|
12.1--18.1
|
16.2
|
13.7--19.0
|
15.5
|
13.7--17.5
|
|
---
|
---
|
---
|
---
|
---
|
---
|
|
Tennessee
|
14.7
|
12.8--16.9
|
21.0
|
18.8--23.4
|
17.9
|
16.3--19.6
|
|
10.1
|
8.4--12.0
|
11.5
|
9.9--13.2
|
10.8
|
9.6--12.1
|
|
Texas
|
19.1
|
16.8--21.5
|
18.9
|
16.5--21.4
|
19.0
|
17.2--20.9
|
|
10.5
|
8.5--13.0
|
8.1
|
6.6--9.8
|
9.3
|
7.8--11.1
|
|
Utah
|
20.9
|
18.2--23.9
|
22.0
|
19.7--24.6
|
21.4
|
19.3--23.7
|
|
11.7
|
9.3--14.7
|
10.6
|
8.4--13.2
|
11.1
|
9.1--13.5
|
|
Vermont
|
---
|
---
|
---
|
---
|
---
|
---
|
|
---
|
---
|
---
|
---
|
---
|
---
|
|
West Virginia
|
26.4
|
23.3--29.9
|
24.9
|
21.0--29.3
|
25.7
|
22.9--28.8
|
|
12.7
|
9.8--16.5
|
7.4
|
5.6--9.7
|
10.0
|
7.8--12.6
|
|
Wisconsin
|
---
|
---
|
---
|
---
|
---
|
---
|
|
---
|
---
|
---
|
---
|
---
|
---
|
|
Wyoming
|
20.9
|
18.9--23.0
|
21.6
|
19.5--23.9
|
21.2
|
19.7--22.8
|
|
11.1
|
9.6--12.9
|
11.4
|
9.8--13.1
|
11.2
|
10.1--12.4
|
|
Median
|
21.4
|
22.6
|
21.7
|
|
11.6
|
9.7
|
10.9
|
|
Range
|
14.7--27.6
|
16.1--29.1
|
15.5--28.3
|
|
7.9--14.5
|
6.3--12.3
|
7.9--13.1
|
|
Local surveys
|
|
|
|
|
|
|
|
|
|
|
|
|
|
|
Boston, MA
|
27.0
|
23.8--30.5
|
22.1
|
18.1--26.7
|
24.6
|
21.7--27.6
|
|
13.1
|
10.0--16.9
|
9.1
|
6.6--12.5
|
11.1
|
9.1--13.5
|
|
Broward County, FL
|
16.8
|
14.3--19.6
|
19.6
|
16.4--23.2
|
18.1
|
15.9--20.5
|
|
8.1
|
6.5--10.2
|
7.1
|
5.4--9.3
|
7.6
|
6.3--9.0
|
|
Charlotte-Mecklenburg, NC
|
17.9
|
15.5--20.6
|
20.1
|
17.2--23.3
|
19.0
|
17.1--21.1
|
|
8.9
|
7.0--11.2
|
10.2
|
8.2--12.8
|
9.5
|
8.2--11.1
|
|
Chicago, IL
|
24.0
|
20.6--27.9
|
25.2
|
20.0--31.2
|
24.8
|
21.0--29.0
|
|
10.6
|
7.9--14.0
|
6.3
|
4.2--9.3
|
8.3
|
6.6--10.5
|
|
Clark County, NV
|
20.1
|
17.3--23.4
|
20.2
|
17.5--23.2
|
20.2
|
18.0--22.6
|
|
9.2
|
6.8--12.2
|
7.9
|
5.9--10.6
|
8.5
|
6.9--10.4
|
|
Dallas, TX
|
16.4
|
13.3--20.1
|
20.6
|
17.0--24.8
|
18.4
|
15.9--21.2
|
|
7.9
|
5.4--11.6
|
8.3
|
5.7--12.2
|
8.1
|
6.0--11.0
|
|
Detroit, MI
|
23.4
|
20.9--26.1
|
21.9
|
18.6--25.7
|
22.6
|
20.3--25.1
|
|
11.5
|
9.6--13.8
|
8.8
|
6.3--12.1
|
10.1
|
8.4--12.2
|
|
Duval County, FL
|
22.6
|
20.1--25.2
|
26.8
|
23.6--30.2
|
24.5
|
22.3--26.9
|
|
---
|
---
|
---
|
---
|
---
|
---
|
|
Los Angeles, CA
|
17.7
|
14.3--21.7
|
21.0
|
18.9--23.2
|
19.6
|
17.4--22.0
|
|
7.3
|
4.9--10.7
|
6.3
|
4.9--8.1
|
6.8
|
5.2--8.9
|
|
Memphis, TN
|
15.0
|
12.1--18.6
|
24.2
|
20.9--27.8
|
19.4
|
17.3--21.7
|
|
8.2
|
6.3--10.5
|
12.2
|
9.5--15.5
|
10.1
|
8.4--12.0
|
|
Miami-Dade County, FL
|
19.8
|
17.5--22.2
|
22.9
|
20.6--25.5
|
21.3
|
19.8--23.0
|
|
7.9
|
6.5--9.6
|
7.5
|
6.1--9.1
|
7.7
|
6.7--8.7
|
|
Milwaukee, WI
|
29.9
|
26.8--33.2
|
28.5
|
25.7--31.5
|
29.2
|
27.2--31.3
|
|
---
|
---
|
---
|
---
|
---
|
---
|
|
New York City, NY
|
21.1
|
19.4--22.9
|
23.6
|
21.3--26.1
|
22.2
|
20.8--23.7
|
|
---
|
---
|
---
|
---
|
---
|
---
|
|
Orange County, FL
|
20.1
|
16.6--24.0
|
21.8
|
18.4--25.8
|
20.9
|
18.5--23.5
|
|
11.5
|
8.9--14.8
|
9.6
|
7.4--12.5
|
10.6
|
9.0--12.4
|
|
Palm Beach County, FL
|
16.9
|
14.4--19.8
|
20.9
|
17.9--24.3
|
19.1
|
17.3--21.0
|
|
7.7
|
5.9--10.1
|
7.9
|
6.2--10.1
|
8.0
|
6.8--9.4
|
|
Philadelphia, PA
|
28.2
|
25.0--31.6
|
30.4
|
26.8--34.3
|
29.4
|
26.9--31.9
|
|
17.2
|
14.5--20.3
|
15.0
|
11.8--19.0
|
16.3
|
13.9--19.0
|
|
San Bernardino, CA
|
15.5
|
13.0--18.5
|
21.4
|
18.0--25.2
|
18.5
|
16.3--20.8
|
|
8.7
|
6.7--11.3
|
9.0
|
6.8--11.7
|
8.8
|
7.3--10.7
|
|
San Diego, CA
|
20.8
|
18.4--23.5
|
21.1
|
18.5--23.9
|
20.9
|
18.8--23.2
|
|
9.9
|
7.8--12.4
|
8.7
|
6.8--11.0
|
9.2
|
7.6--11.2
|
|
San Francisco, CA
|
19.2
|
16.7--21.9
|
24.0
|
21.1--27.1
|
21.7
|
19.7--23.8
|
|
7.4
|
5.8--9.5
|
7.6
|
6.1--9.6
|
7.6
|
6.5--8.8
|
|
Seattle, WA
|
23.7
|
20.8--26.9
|
21.6
|
18.5--25.0
|
22.8
|
20.5--25.2
|
|
8.7
|
7.0--10.9
|
7.4
|
5.4--10.0
|
8.2
|
6.7--10.0
|
|
Median
|
20.1
|
21.8
|
21.1
|
|
8.7
|
8.3
|
8.5
|
|
Range
|
15.0--29.9
|
19.6--30.4
|
18.1--29.4
|
|
7.3--17.2
|
6.3--15.0
|
6.8--16.3
|
|
|
Routine sunscreen use
|
|
Indoor tanning device use
|
|
|
Female
|
Male
|
Total
|
|
Female
|
Male
|
Total
|
|
Category
|
%
|
CI§
|
%
|
CI
|
%
|
CI
|
|
%
|
CI
|
%
|
CI
|
%
|
CI
|
|
Race/Ethnicity
|
|
|
|
|
|
|
|
|
|
|
|
|
|
|
White¶
|
14.4
|
12.5--16.6
|
7.4
|
6.4--8.5
|
10.6
|
9.4--12.0
|
|
37.4
|
33.6--41.4
|
7.0
|
5.7--8.7
|
21.1
|
18.3--24.2
|
|
Black¶
|
5.9
|
4.2--8.3
|
3.3
|
2.1--5.1
|
4.6
|
3.4--6.1
|
|
2.7
|
1.7--4.1
|
6.1
|
4.1--9.0
|
4.5
|
3.1--6.4
|
|
Hispanic
|
10.4
|
8.8--12.3
|
4.5
|
3.4--6.0
|
7.5
|
6.4--8.8
|
|
10.5
|
8.8--12.6
|
5.8
|
4.4--7.6
|
8.2
|
6.9--9.7
|
|
Grade
|
|
|
|
|
|
|
|
|
|
|
|
|
|
|
9
|
12.6
|
10.1--15.7
|
6.5
|
4.6--9.0
|
9.3
|
7.6--11.4
|
|
16.0
|
13.4--18.9
|
5.9
|
4.7--7.4
|
10.5
|
9.0--12.2
|
|
10
|
12.1
|
9.7--15.2
|
6.5
|
5.3--7.8
|
9.2
|
7.7--10.9
|
|
23.2
|
19.3--27.5
|
4.6
|
3.2--6.5
|
13.4
|
11.1--16.1
|
|
11
|
13.8
|
12.0--15.8
|
7.0
|
5.6--8.7
|
10.3
|
9.0--11.6
|
|
30.3
|
26.5--34.4
|
7.0
|
5.5--9.0
|
18.2
|
16.0--20.7
|
|
12
|
11.0
|
8.9--13.4
|
6.1
|
4.5--8.0
|
8.4
|
7.2--9.9
|
|
33.7
|
29.3--38.5
|
10.0
|
8.1--12.3
|
21.7
|
18.8--24.8
|
|
Total
|
12.4
|
11.1--13.9
|
6.5
|
5.7--7.4
|
9.3
|
8.4--10.3
|
|
25.4
|
22.4--28.6
|
6.7
|
5.6--8.0
|
15.6
|
13.7--17.6
|
|
|
Female
|
Male
|
Total
|
|
Category
|
%
|
CI†
|
%
|
CI
|
%
|
CI
|
|
Race/Ethnicity
|
|
|
|
|
|
|
|
White§
|
26.6
|
24.8--28.5
|
34.4
|
32.4--36.4
|
30.8
|
29.2--32.4
|
|
Black§
|
32.7
|
29.5--36.2
|
27.4
|
24.1--30.9
|
30.0
|
27.3--32.8
|
|
Hispanic
|
32.0
|
28.5--35.7
|
36.1
|
32.4--39.9
|
34.1
|
30.9--37.5
|
|
Grade
|
|
|
|
|
|
|
|
9
|
36.2
|
33.9--38.4
|
42.8
|
39.7--46.0
|
39.8
|
37.9--41.8
|
|
10
|
28.7
|
25.7--32.0
|
33.4
|
30.4--36.6
|
31.3
|
28.6--34.1
|
|
11
|
25.5
|
22.3--29.0
|
27.7
|
24.5--31.2
|
26.6
|
23.9--29.6
|
|
12
|
21.3
|
18.4--24.6
|
27.1
|
23.9--30.4
|
24.2
|
21.7--27.0
|
|
Total
|
28.2
|
26.6--29.9
|
33.3
|
31.6--35.1
|
30.9
|
29.3--32.5
|
|
Objective number*
|
Objective
|
2010
Target
%
|
2009
YRBS
%
|
|
3-9a
|
Increase the proportion of adolescents in grades 9-12 who follow protective measures that may reduce the risk of skin cancer†
|
None set§
|
9.3
|
|
15-19
|
Increase use of safety belts¶
|
92.0
|
90.3
|
|
15-21
|
Increase the proportion of motorcyclists using helmets**
|
79.0
|
68.1
|
|
15-38
|
Reduce physical fighting among adolescents††
|
32.0
|
31.5
|
|
15-39
|
Reduce weapon carrying by adolescents on school property§§
|
4.9
|
5.6
|
|
18-2
|
Reduce the rate of suicide attempts by adolescents¶¶
|
1.0
|
1.9
|
|
22-6
|
Increase the proportion of adolescents who engage in moderate physical activity for at least 30 minutes on 5 or more of the previous 7 days***
|
35.0
|
28.7
|
|
22-7
|
Increase the proportion of adolescents who engage in vigorous physical activity that promotes cardiorespiratory fitness 3 or more days per week for 20 or more minutes per occasion†††,§§§
|
85.0
|
67.7
|
|
22-9
|
Increase the proportion of adolescents who participate in daily school physical education¶¶¶
|
50.0
|
33.3
|
|
22-10
|
Increase the proportion of adolescents who spend at least 50% of school physical education class time being physically active****
|
50.0
|
40.9
|
|
22-11
|
Increase the proportion of adolescents who view television 2 or fewer hours on a school day
|
75.0
|
67.2
|
|
25-11
|
Increase the proportion of adolescents who abstain from sexual intercourse or use condoms, if currently sexually active††††,§§§
|
95.0
|
86.9
|
|
26-6
|
Reduce the proportion of adolescents who report that they rode, during the previous 30 days, with a driver who had been drinking alcohol§§§§
|
30.0
|
28.3
|
|
27-2
|
Reduce tobacco use by adolescents
|
|
|
|
27-2a
|
Reduce tobacco product use (past month)¶¶¶¶
|
21.0
|
26.0
|
|
27-2b
|
Reduce cigarette use (past month)*****,§§§
|
16.0
|
19.5
|
|
27-2c
|
Reduce spit tobacco use (past month)†††††
|
1.0
|
8.9
|
|
27-2d
|
Reduce cigar use (past month)§§§§§
|
8.0
|
14.0
|
|
27-7
|
Increase tobacco use cessation attempts by adolescent smokers¶¶¶¶¶
|
84.0
|
58.5
|
|
|