|
TABLE 1. Comparison of sample populations used to create the CDC and WHO growth curves for children aged <24 mos |
||
|---|---|---|
|
Characteristic |
CDC growth reference (2000)* |
WHO growth standard (2006)† |
|
Data sources |
National vital statistics (birth weights) Missouri and Wisconsin vital statistics (birth lengths) Pediatric Nutrition Surveillance System (lengths, 0.1 to <5 mos) NHANES I (1971--1974) (12--23 mos) NHANES II (1976--1980) (6--23 mos) NHANES III (1988--1994) (2--23 mos) |
MGRS longitudinal component, with sites in the following locations: Pelotas, Brazil Accra, Ghana Delhi, India Oslo, Norway Muscat, Oman Davis, California |
|
Type and frequency of data collection |
Cross-sectional data on weight and length starting at age 2 mos, with mathematical models used to connect birth weights and lengths to survey data |
Longitudinal data with measurements of weight and length at birth; 1, 2, 4, 6, and 8 wks; and 3, 4, 5, 6, 7, 8, 9, 10, 11, 12, 14, 16, 18, 20, 22, and 24 mos |
|
Sample size |
4,697 observations for 4,697 distinct children |
18,973 observations for 882 distinct children |
|
Exclusion criteria |
Very low birth weight (<1,500 g [<3 lbs, 4 oz]) |
Low socioeconomic status Birth at altitude >1,500 m Birth at <37 wks or ≥42 wks Multiple birth Perinatal morbidities Child health conditions known to affect growth Maternal smoking during pregnancy or lactation Breastfeeding for <12 mos Introduction of complementary foods before age 4 mos or after age 6 mos Weight-for-length measurements >3 standard deviations above or below study median for sex |
|
Breastfeeding among infants in sample |
Approximately 50% ever breastfed Approximately 33% breastfeeding at 3 mos |
100% ever breastfed 100% predominantly breastfeeding at 4 mos 100% still breastfeeding at 12 mos Complementary foods introduced at mean age of 5.4 mos |
|
Abbreviations: MGRS = Multicentre Growth Reference Study; NHANES = National Health and Nutrition Examination Survey; WHO = World Health Organization. * Source: Kuczmarski RJ, Ogden CL, Guo SS, et al. 2000 CDC growth charts for the United States: methods and development. Vital Health Stat 2002;246. † Sources: World Health Organization. WHO child growth standards: length/height-for-age, weight-for-age, weight-for-height and body mass index-for-age: Methods and development. Geneva, Switzerland: World Health Organization; 2006. Available at http://www.who.int/childgrowth/publications/technical_report_pub/en/index.html. Accessed June 1, 2010; and WHO Multicentre Growth Reference Study Group. Enrolment and baseline characteristics in the WHO Multicentre Growth Reference Study. Acta Paediatr Suppl 2006;450:7--15. |
||
Persons using assistive technology might not be able to fully access information in this file. For assistance, please send e-mail to: mmwrq@cdc.gov. Type 508 Accommodation and the title of the report in the subject line of e-mail.
Use of World Health Organization and CDC Growth Charts for Children Aged 0--59 Months in the United States
Please note: An erratum has been published for this article. To view the erratum, please click here.
Summary
In April 2006, the World Health Organization (WHO) released new international growth charts for children aged 0--59 months. Similar to the 2000 CDC growth charts, these charts describe weight for age, length (or stature) for age, weight for length (or stature), and body mass index for age. Whereas the WHO charts are growth standards, describing the growth of healthy children in optimal conditions, the CDC charts are a growth reference, describing how certain children grew in a particular place and time. However, in practice, clinicians use growth charts as standards rather than references.
In 2006, CDC, the National Institutes of Health, and the American Academy of Pediatrics convened an expert panel to review scientific evidence and discuss the potential use of the new WHO growth charts in clinical settings in the United States. On the basis of input from this expert panel, CDC recommends that clinicians in the United States use the 2006 WHO international growth charts, rather than the CDC growth charts, for children aged <24 months (available at https://www.cdc.gov/growthcharts). The CDC growth charts should continue to be used for the assessment of growth in persons aged 2--19 years.
The recommendation to use the 2006 WHO international growth charts for children aged <24 months is based on several considerations, including the recognition that breastfeeding is the recommended standard for infant feeding. In the WHO charts, the healthy breastfed infant is intended to be the standard against which all other infants are compared; 100% of the reference population of infants were breastfed for 12 months and were predominantly breastfed for at least 4 months. When using the WHO growth charts to screen for possible abnormal or unhealthy growth, use of the 2.3rd and 97.7th percentiles (or ±2 standard deviations) are recommended, rather than the 5th and 95th percentiles. Clinicians should be aware that fewer U.S. children will be identified as underweight using the WHO charts, slower growth among breastfed infants during ages 3--18 months is normal, and gaining weight more rapidly than is indicated on the WHO charts might signal early signs of overweight.
Introduction
The physical growth of infants and children has long been recognized as an important indicator of health and wellness (1,2). Growth charts have been used for at least a century to assess whether a child is receiving adequate nutrition and to screen for potentially inadequate growth that might be indicative of adverse health conditions. Traditionally, attention has focused on undernutrition. However, in the past few decades, concerns about excessive weight gain have increased, and growth charts have been used to screen for overweight, including obesity.
In April 2006, the World Health Organization (WHO) released a new international growth standard for children aged 0--59 months (3). Similar to the 2000 CDC growth reference (4,5), these growth charts describe weight for age, length (or stature) for age, weight for length (or stature), and body mass index (BMI) for age. WHO growth curves include BMI for age starting at birth, and CDC growth curves include BMI for age beginning at age 2 years. CDC and WHO growth charts also include a curve for head circumference for age; CDC provides values for children aged <36 months, and WHO charts include a head circumference curve for those aged <60 months.
Because two sets of growth curves exist for assessing child growth, clinicians in the United States need guidelines indicating which curves should be used and for which children. This report provides guidance on the use of the WHO and CDC growth charts and is intended for health-care providers and others who measure and assess child growth.
Methods
During June 29--30, 2006, CDC, the National Institutes of Health (NIH), and the American Academy of Pediatrics (AAP) convened a meeting in Hyattsville, Maryland, to review scientific evidence and obtain opinions regarding the use of the new WHO growth charts in clinical settings in the United States. The participants at the meeting were selected on the basis of their expertise in child growth, statistical methodology, clinical application, and maternal and child health policy. CDC, NIH, and AAP each had numerous representatives; additional experts from academia, clinical professional groups, and other government agencies were invited.
Participants were provided background documents describing the development of both sets of curves. At the meeting, CDC made presentations on the methods used to create the CDC growth charts, and a principal investigator for the WHO Multicentre Growth Reference Study (MGRS), which generated the data used for the WHO growth curves, made a presentation on the methods used to create the WHO charts. CDC conducted a statistical comparison of the charts and presented the results to participants. Meeting discussions focused on the numerous factors involved in the selection of a chart, including the assessment of child growth using references (i.e., how certain groups of children have grown in the past) compared with standards (i.e., how healthy children should grow in ideal conditions), differences between the growth of breastfed and formula-fed infants, the methods used to create the CDC and WHO charts, and implications of using the charts in clinical practice. At the time of the meeting, WHO was developing but had not released growth charts for head circumference for age; therefore, these charts were not discussed. The charts have since been released and are available at http://www.who.int/childgrowth/standards/hc_for_age/en/index.html.
The panel was not asked to arrive at a consensus. At the end of the meeting, CDC asked all participants to provide written opinions on which curves should be recommended, at which ages, and for which children. After the meeting ended, CDC worked with NIH and AAP to develop these CDC recommendations based on the meeting proceedings.
Creation of the WHO and CDC Growth Curves
History
Until the late 1970s, clinicians used various growth charts to assess child growth (6--9). In 1977, the National Center for Health Statistics (NCHS), which became a part of CDC in 1987, published a new set of growth charts for children aged <18 years based on data from the Fels Longitudinal Growth Study and nationally representative surveys (10). In 1978, CDC extrapolated the published percentiles to compute z scores, allowing for the generation of more extreme cutoffs, including 2 and 3 standard deviations below the median (11). WHO then recommended that these z scores be used as a global reference for the definition of malnutrition. The curves began to be used worldwide.
In spite of their widespread use, there were numerous concerns about these charts, including a lack of racial diversity in the infant sample, an infant sample composed of infants who were almost all formula fed, and the disjunction in length and stature measurements when transitioning from the charts for younger children to those for older children. Therefore, while planning the third National Health and Nutrition Examination Survey (NHANES III), NCHS decided to oversample children aged <6 years so that the 1970s growth charts could be revised. After data collection was completed in 1994, CDC began revising the curves, and the new charts were released in 2000. In 1997, WHO launched the MGRS to collect data on the growth of children worldwide based on strict inclusion criteria. Data collection was completed in 2003, and the growth charts were released in 2006.
Growth Reference Versus Growth Standard
The CDC and WHO growth charts differ in their overall conceptual approach to describing growth. The WHO charts are growth standards that describe how healthy children should grow under optimal environmental and health conditions. The curves were created based on data from selected communities worldwide, which were chosen according to specific inclusion and exclusion criteria. Deviation from the WHO growth standard should prompt clinicians to determine whether suboptimal environmental conditions exist, and if so, whether they can be corrected.
Whereas the WHO charts describe growth of healthy children in optimal conditions, the 2000 CDC growth charts are a growth reference, not a standard, and describe how certain children grew in a particular place and time. The CDC charts describe the growth of children in the United States during a span of approximately 30 years (1963--1994).
Sample Populations
The reference populations used to create the 2006 WHO and 2000 CDC growth curves vary with respect to inclusion and exclusion criteria, geographic location, frequency of measurements, and sample size (Tables 1 and 2).
WHO
The 2006 WHO growth curves for children are based on data from the WHO MGRS, a study conducted during 1997--2003 in six sites: Pelotas, Brazil; Accra, Ghana; Delhi, India; Oslo, Norway; Muscat, Oman; and Davis, California (12). The criteria for selection of the communities included 1) socioeconomic status that does not constrain growth of the child (based on infant mortality rate; prevalence of underweight, stunting, and wasting; subpopulation size; and access to safe water), 2) low altitude (<1,500 m [4,921 ft]), 3) low enough population mobility to allow for a 2-year follow-up, 4) at least 20% of mothers in the community willing to follow international feeding recommendations, 5) existence of a breastfeeding support system (typically in the form of lactation consultants), and 6) existence of a research institution capable of conducting the study (12). The international infant feeding recommendations in effect at the time of the study included exclusive breastfeeding for at least 4 months (although predominantly breastfed infants were also included in the study), introduction of complementary foods by at least 6 months but not before 4 months, and continued breastfeeding for at least 12 months. Study participants were provided breastfeeding support as needed and were counseled on complementary feeding, with an emphasis on timing, energy density, feeding frequency, and micronutrient content.
Exclusion criteria for mothers and infants included maternal smoking during pregnancy or lactation, birth at <37 weeks or ≥42 weeks, multiple birth, substantial morbidity, low socioeconomic status, and unwillingness of the mother to follow feeding criteria (12). Weight-for-length measurements of >3 standard deviations from the overall study median were considered to be outliers and excluded from the final sample.
The WHO growth curves for children aged <24 months were based on the longitudinal component of MGRS, in which cohorts of newborns were measured from birth through age 23 months (Table 1). Longitudinal data were collected at birth, 1 week, and every 2 weeks for the first 2 months after birth, monthly through age 12 months, and bimonthly from age 14 to 24 months. Of the initial 1,743 enrolled participants, six were excluded because of substantial morbidities. A total of 882 infants (50.8%) (range: 21.4%--69.2% among sites) met the feeding and maternal nonsmoking criteria and completed the 2-year follow-up; these participants were included in the growth curves (3). For the 855 infants who did not meet the feeding and maternal nonsmoking criteria, only the birth measurements were used. A total of 18,973 distinct measurements of weight and length were included in the data set. Data on participants who were not included in the data set were not available to meeting participants.
A primary study hypothesis of MGRS based on previous research (13,14) was that all young children have the potential to grow similarly, regardless of their ethnic group or place of birth, if they are in a healthy environment and receive adequate nutrition. This hypothesis was confirmed; the mean length measurements of children aged <24 months in the six country sites were virtually identical (Figure 1).
The WHO growth curves for children aged 24--59 months were based on the cross-sectional component MGRS, in which groups of children at specific ages were measured at a specific point in time; the cross-sectional data represented 6,669 children (Table 2). Data were collected in the same communities as those used to create the curves for children aged <24 months, typically just after completion of the longitudinal study. Other than the infant feeding criteria, the inclusion criteria used for the cross-sectional data collection for ages <24 months and 24--59 months were the same. The infant feeding criteria were much less stringent (breastfeeding for at least 3 months and no requirements for the timing of complementary feeding). Mothers of children aged 24--59 months years did not receive assistance to ensure that the children received optimal nutrition.
To eliminate the effect of overweight children on the weight distributions in the WHO curves for children aged 24--59 months, weight measurements of >2 standard deviations above the study median were excluded; a total of 226 (2.7%) weight measurements were excluded.
CDC
The CDC growth curves for children aged <36 months were based on cross-sectional data from various sources (Table 1). The curves were anchored at birth using national birth weight data obtained from U.S. birth certificates from 1968--1980 and 1985--1994 and birth length data from Wisconsin and Missouri birth certificates (the only states with these data available on birth certificates) from 1989--1994 (5). Birth data were based on 82 million birth weight measurements and 445,000 birth length measurements.
The curves for children aged 2--59 months were primarily based on data from NHANES; no NHANES data were available for infants aged <2 months. NHANES is a continuous cross-sectional survey of the health and nutritional status of the U.S. civilian, noninstitutionalized population. Participants are selected through a complex, multistage probability design. All NHANES surveys include a household interview and a detailed physical examination that includes anthropometric measurements. Data from NHANES III (1988--1994) were used to create the curves for children aged 2--5 months; NHANES II (1976--1980) and III for ages 6--11 months; and NHANES I (1971--1974), II, and III for ages 12--59 months. In addition, supplementary length data from clinics that participated in the CDC Pediatric Nutrition Surveillance System (PedNSS) (1975--1995) and had data for older infants and children that were similar to the NHANES national surveillance data were used for the length-for-age charts for ages 0.1 to <5 months (15).
For the cross-sectional data for children aged 2--23 months, there were 4,697 data points. At age 2 months, 72 weight measurements were available (representing 38 boys and 34 girls), and approximately 200 measurements (each measurement representing one child) per month were available through age 5 years. Data from approximately 35,000 infants aged 0.1 to <5 months from the PedNSS clinics were used. To create curves for children aged 24--59 months, data from 9,894 children, were used. From ages 5--59 months, sample sizes for length were similar to those for weight.
Because the growth of infants with very low birth weight (VLBW) (<1,500 g [<3 lbs, 4 oz]) is distinctly different from that of infants with higher birth weights, data for VLBW infants were excluded from the charts for children aged <36 months (5). No other exclusion or inclusion criteria (such as breastfeeding) were used. Approximately 50% of the infants in the data set had ever been breastfed, and 33% were still breastfeeding when they reached age 3 months. No overweight measurements were excluded.
Measurements
Careful procedures for training and measurement standardization were followed, and high-quality instruments were used for weight and length (or stature) measurements. In the WHO study, anthropometrists took two measurements independently and repeated measurements that exceeded preset maximum allowable differences. NHANES anthropometrists took measurements once. In general, both WHO and CDC assessed length (measured lying down) for children aged <24 months and stature (measured standing up) for children aged 24--59 months. A subset of children were measured both recumbent and standing (at ages 18--30 months for WHO, at ages 24--36 months for CDC) to assess the discrepancy between the two measurements and allow for connection of the curves before and after age 24 months. Detailed descriptions of these procedures and instruments have been published (4,16,17).
Calculation of Percentiles and z Scores
Optimal data entry and cleaning techniques were used. For both sets of curves, the data analysis treated each data point independently, even if two data points were taken for a single child. Although there were some differences in the statistical smoothing techniques used to create the WHO and CDC charts, both used a variant of the lambda-mu-sigma (LMS) statistical method to describe both percentiles and z scores (standard deviation units) (5,18--20). Because no data (other than length for age) were available to connect the birth data to the cross-sectional data after age 2 months in the CDC curves, a 3-parameter linear mathematical model was used to smooth the weight data from 0--35 months (5).
Rationale for Recommendations
Use of Growth Reference or Growth Standard in Clinical Settings
Opinions of the participants varied about whether the use of a growth standard or a growth reference would be best for clinical settings in the United States. Several participants explained that identification of growth that is unhealthy (i.e., indicates an underlying adverse health condition) or abnormal first requires a definition of healthy growth, thus a standard is needed. Other participants countered that because many children do not live in ideal environmental conditions, interpreting their growth by comparing them to a growth standard might not be appropriate. Likewise, some children who live in optimal conditions deviate from the normal growth curve but are not unhealthy. Participants acknowledged that adoption of a standard for assessing growth in children would create a substantial need for the education of clinicians but would also create an opportunity for clinicians to identify and address environmental conditions that might be negatively affecting growth. Meeting participants agreed that in practice, clinicians often use growth references, such as the CDC growth charts, as a standard to evaluate healthy growth rather than a reference as intended.
Children Aged <24 Months
Available Data
The meeting participants were concerned about the paucity of data for the first several months of age in the data set used to create the 2000 CDC growth charts, as well as about the effects of combining various disparate data sets (e.g., birth records, NHANES national survey data, and PedNSS clinical surveillance data) to generate the charts. In contrast, the WHO charts for children aged <24 months were created with longitudinal data that were collected more frequently than the data used for the CDC charts, especially during the first few months of life when children grow the most quickly. However, the panel also was concerned that the exclusion of weight-for-length data that were >3 standard deviations from the median from the WHO charts was inappropriate because these data represented children who were part of the actual distribution of observed physiological growth. The data for the WHO growth charts were generally considered to be strong during the first several months of age.
Breastfeeding and Growth Patterns
When the WHO growth curves were created, the difference in growth between primarily formula-fed infants and primarily breastfed infants was an important consideration (12). The WHO charts were based on the premise that the healthy breastfed infant is the standard against which all other infants should be compared. This is consistent with U.S. dietary reference intakes, in which norms for infant intakes of most nutrients are determined on the basis of the composition of human milk and the average volume of human milk intake (21). In the WHO charts, 100% of the reference population of infants were breastfed for 12 months and were predominantly breastfed for at least 4 months. In contrast, approximately 50% of the infants in the CDC data set had ever been breastfed, and 33% were still breastfeeding when they reached age 3 months, rates that are lower than those for infant cohorts born today. Data from the CDC National Immunization Survey indicate that in 2007 in the United States, 75% of infants had ever been breastfed, and 58% had been breastfed for at least 3 months (22). In addition, the composition of infant formula has changed considerably during the preceding 35 years (23). Therefore, the current growth of U.S. infants might not be the same as the growth of infants used in the creation of the CDC growth curves.
The expert panel universally agreed that breastfeeding is the optimal form of infant feeding and recognized that the growth of breastfed infants differs from that of formula-fed infants. The panel also recognized that AAP has stated the breastfed infant "is the reference or normative model against which all alternative feeding methods must be measured with regard to growth, health, development, and all other short- and long-term outcomes" (24).
Some U.S. clinicians who are currently using the CDC charts might be unaware of or not understand the growth pattern of exclusively breastfed infants, which differs from that of formula-fed infants. These clinicians might inappropriately recommend that mothers supplement breastfeeding with formula or advise them to wean their infants from breastfeeding completely.
The WHO and CDC charts show different growth patterns that might lead clinicians to different conclusions about variations in growth. Healthy breastfed infants typically gain weight faster than formula-fed infants in the first few months of life but then gain weight more slowly for the remainder of infancy (25,26). Therefore, in the first few months of life, WHO curves show a faster rate of weight gain than the CDC charts for boys and girls (Figures 2 and 3). Use of the WHO charts in the United States might lead to an increase in the misperception of poor growth at this age.
Beginning at approximately age 3 months, WHO curves show a slower rate of weight gain than the CDC charts, both in weight for age and weight for length. Because WHO curves are derived from infants who breastfeed through 12 months, infants who are still breastfeeding at approximately age 3 months are more likely to maintain their percentages on the WHO growth charts but to decrease in percentages on the CDC charts. In contrast, if WHO charts are used to assess the growth of formula-fed infants, these infants might be identified as growing too slowly during the first few months of life but then be identified as gaining weight too quickly after approximately 3 months.
Children Aged 24--59 Months
CDC curves allow for a transition period from 24--35 months when children can be assessed using either the charts for children aged 0--36 months or for persons aged 2--19 years. Children in this age range can have their measurements plotted on the chart for younger children to show continuity with previous growth and on the chart for older children to show continuity with subsequent growth. For weight for length (or stature) and length (or stature) for age, assessing children using both curves requires measuring the child both recumbent and supine and therefore is not a common practice.
The meeting participants raised concerns that weights >2 standard deviations above the median should not have been deleted in creation of the WHO curves because they were part of the full weight distribution of the study population. They also noted that the methods for selecting the study participants for this age range was not substantively different between the WHO and CDC charts. CDC and WHO growth charts for ages 24--59 months were both based on cross-sectional data, and compared with the methods used to create the growth curves for children aged <24 months, the methodological differences between CDC and WHO in creating growth curves for ages 24--59 months were minor. For these reasons, the expert panel found little reason to recommend a change from the current use of the CDC curves among older children.
Transition from WHO to CDC Charts
The panel discussed the possibility of using the WHO charts for children aged <24 months but the CDC charts for older children. During these discussions, participants explained that transitioning from one chart to another might create a disjunction by changing how a particular child's growth is classified. For example, a child aged 24 months who is classified as overweight according to the WHO charts might be classified in the normal range on the CDC charts at the same age. Regardless, both the WHO and CDC growth charts already have somewhat of an internal disjunction because length measurements switch from recumbent to stature measurements when children are aged 2 years; measurements of length are greater (0.7--0.8 cm) than measurements of stature. Therefore, a child aged 2 years might seem to be approximately 1 cm shorter when a clinician transitions from using length to stature measurements, potentially leading to a change in the plotted percentile.
Because CDC charts are printed on separate pages, clinicians must switch charts when they switch from length to stature measurements at age 24 months. Likewise, clinicians would switch to a separate page if they were to transition from the WHO to the CDC charts at age 24 months. Thus, if the WHO charts were to be used for infants and the CDC charts for older children, transitioning at age 24 months seemed to be the most feasible age to switch.
Selection of Percentiles
Predetermined percentiles on growth charts are used to identify children who might not be growing normally. Traditionally, the 5th or 95th percentiles have been used with the CDC charts; however, they are arbitrary statistical values and are not based on analysis of health outcomes. Likewise, the WHO percentiles (2.3rd and 97.7th, or ±2 standard deviations) also are arbitrary and not based on health outcomes. Using the WHO-recommended percentiles with the WHO curves in the United States would result in a prevalence of short stature and overweight that is similar to the prevalence from the CDC curves using the 5th and 95th percentiles (27). Therefore, in pediatric practice, the number of children identified for additional follow-up because of short stature and overweight would be similar to current numbers. In contrast, use of the 5th and 95th percentiles with the WHO weight charts would result in 10% of the WHO growth curve population being categorized as underweight or overweight, even though the population comprises healthy children who were fed according to international recommendations. The population used to create the CDC charts includes children with various health problems and children who were not fed according to international recommendations. Use of the 5th and 95th percentiles with the WHO curves to assess the U.S. population might overestimate the prevalence of short stature, underweight, and overweight in the United States. For example, the mean stature included in the WHO and CDC charts is similar, but the WHO charts have less variability than the CDC charts among children aged <24 months, leading to an increased prevalence of both shortness and tallness for children aged <2 years when the 5th and 95th percentiles are applied (Figures 4 and 5).
The estimated prevalences of low weight for age and high weight for length among U.S. children differ depending on whether the CDC charts (using the 5th and 95th percentiles) or the WHO charts (using the 2.3rd and 97.7th percentiles) are used (Figure 6). A substantial difference exists in the prevalence of low weight for age, with the WHO standard showing a lower prevalence beginning at age 6 months. The CDC reference identifies 7%--11% of children aged 6--23 months as having low weight for age, whereas the WHO standard identifies <3%. The WHO standard also identifies fewer infants (aged <12 months) as having high weight for length (5%--9%) than the CDC reference (9%--13%). For children aged 18--23 months, the differences in high weight for length essentially disappear. The prevalence of short stature is similar for both sets of curves.
Recommendations
Use of WHO Growth Charts for Children Aged <24 Months
Use of the 2006 WHO international growth standard for the assessment of growth among all children aged <24 months, regardless of type of feeding, is recommended. (The charts are available at https://www.cdc.gov/growthcharts.) When using the WHO growth charts, values of 2 standard deviations above and below the median, or the 2.3rd and 97.7th percentiles (labeled as the 2nd and 98th percentiles on the growth charts), are recommended for identification of children whose growth might be indicative of adverse health conditions. The rationale for use of the WHO growth charts for this age group includes the following: 1) the recognition that breastfeeding is the recommended standard for infant feeding and, unlike the CDC charts, the WHO charts reflect growth patterns among children who were predominantly breastfed for at least 4 months and still breastfeeding at age 12 months; 2) clinicians already use growth charts as a standard for normal growth; and 3) the WHO charts are based on a high-quality study, the MGRS.
Continued Use of CDC Growth Charts for Children Aged 24--59 Months
Use of the CDC growth charts for children aged 24--59 months is recommended. The CDC charts also should be used for older children because the charts extend up to age 20 years, whereas the WHO standards described in this report apply only to children aged 0--59 months. The rationale for continuing to use CDC growth charts includes the following: 1) the methods used to create the WHO and CDC charts are similar after age 24 months, 2) the CDC charts can be used continuously through age 19 years, and 3) transitioning at age 24 months is most feasible because measurements switch from recumbent length to standing height at the this age, necessitating use of new printed charts.
Use of Recommended Growth Charts in Clinical Settings
CDC recommends the use of modified versions of the WHO curves for children aged <24 months that include the 2.3rd and 97.7th percentiles and are appropriate for clinicians. These curves have been developed and are available at http://www.cdc.gov/growthcharts. Training tools for clinicians are being developed and also will be available at this website.
Clinicians should recognize that the WHO charts are intended to reflect optimal growth of infants and children. Although many children in the United States have not experienced the optimal environmental, behavioral, or health conditions specified in the WHO study, the charts are intended for use with all children aged <24 months. Therefore, their growth might not always follow the patterns shown in the WHO curves. For example, formula-fed infants tend to gain weight more rapidly after approximately age 3 months and therefore cross upward in percentiles, perhaps becoming classified as overweight. Although no evidence-based guidelines for treating overweight in infancy exist, early recognition of a tendency toward obesity might appropriately trigger interventions to slow the rate of weight gain.
For the first 3 months of age, the WHO charts show a somewhat faster rate of weight gain than the CDC charts, leading to the identification of more infants who appear to be growing slowly. Clinicians should recognize that this slower rate of weight gain is typical for formula fed infants. For breastfed infants identified as growing slowly, clinicians need to carefully assess general health issues and ensure appropriate management of lactation. Only if there is evidence of lactation inadequacy should they consider supplementation with formula.
Differences in the length-for-age WHO and CDC charts are small, and clinical differences based on these charts are expected to be insignificant. In contrast, when the WHO charts are used to assess the growth of U.S. children, fewer children aged 6--23 months will be identified as having inadequate weight for age. Some assert that this might be beneficial because overdiagnosis of underweight might damage the parent-child interaction, subjecting families to unnecessary interventions and possibly unintentionally creating an eating disorder (28). However, children who are identified as having low weight for age on the WHO charts will be more likely to have a substantial deficiency. Clinicians need to seek out the causes for poor growth and propose changes accordingly. For example, poor weight gain might result from neglect, substantial morbidities, or other medical problems that require immediate attention (29).
Recent WHO Growth Chart Policies and Publications
According to WHO, 111 countries had adopted the WHO growth standards as of July 1, 2010 (A. Onyango, WHO, personal communication, July 26, 2010.). Canada has recommended the use of the WHO growth charts (30), including the more recently published charts for children aged 5--17 years (31). The United Kingdom Department of Health has recommended use of the WHO growth standards for children aged 2 weeks to 5 years in combination with United Kingdom birth weight charts (32--42 weeks' gestation) (32,33).
In 2007, the AAP board of directors voted to support the use of the WHO growth charts for children aged <24 months (D. Burrowes, American Academy of Pediatrics, personal communication, November 7, 2007), with the recognition that substantial educational measures are needed to assist with interpretation of the charts. AAP has waited for the availability of clinically useable charts to publicize this recommendation.
Various studies have compared the WHO growth standards with other growth references (34--37). Researchers also have analyzed ways in which use of the WHO standards might affect prevalences of wasting, stunting, and underweight worldwide (38), as well as the distribution of z scores, a commonly used indicator of data quality in international surveys (39). WHO has developed an algorithm to convert population prevalences that were computed using the previous NCHS, CDC, and WHO growth curves (10,11) to those expected using the new charts (38). Several studies have conducted field testing of the WHO charts in clinical settings worldwide, showing differences in prevalence compared with existing charts but also documenting that the WHO standards generally correspond with clinical assessment of malnutrition (36,40,41).
Conclusion
Because the CDC charts are currently in use in clinical settings to assess growth of children, use of the WHO charts for children aged <24 months will require training of health-care providers and others who measure and assess child growth. Training should focus on how to interpret growth on the charts, differences between references and standards, the characteristics of the WHO cohort (especially regarding socioeconomic status, infant feeding patterns, and maternal lack of smoking), the disjunction created by switching from the WHO to the CDC curves at age 2 years, growth patterns of children who breastfeed compared with those who formula feed, and the potential contribution of education and support programs for breastfeeding and complementary feeding. Development of appropriate guidance based on clinical and applied experience is needed so that clinicians can interpret the growth of infants and children who do not meet all optimal environmental and health criteria (e.g., breastfeeding) used for participants in the WHO study. Growth patterns over time using multiple data points should be used in conjunction with other medical and family history to assess appropriate growth. Training on accurate measurement techniques, especially for recumbent length, is critical for any assessment to be valid.
The clinical consequences of using the WHO standards compared with the CDC reference should be evaluated over time to identify advantages and unforeseen adverse consequences of the use of the WHO standards. Research is needed on health outcomes related to different growth patterns during infancy, particularly with regard to identifying percentiles that are indicative of health problems. Finally, research should be conducted on the use of BMI measurements based on length in infants and toddlers as predictive of future adverse health effects.
References
- Garza C, de Onis M. Rationale for developing a new international growth reference. Food Nutr Bull 2004;25(Suppl 1):S5--12.
- Cole TJ. The secular trend in human physical growth: a biological view. Econ Hum Biol 2003;1:161--8.
- World Health Organization. WHO child growth standards: length/height-for-age, weight-for-age, weight-for-height and body mass index-for-age: Methods and development. Geneva, Switzerland: World Health Organization; 2006. Available at http://www.who.int/childgrowth/publications/technical_report_pub/en/index.html. Accessed June 1, 2010.
- Kuczmarski RJ, Ogden CL, Grummer-Strawn LM, et al. CDC growth charts: United States. Adv Data 2000;314:1--27.
- Kuczmarski RJ, Ogden CL, Guo SS, et al. 2000 CDC growth charts for the United States: methods and development. Vital Health Stat 2002;246:1--190.
- Jackson RL, Kelly GH. Growth charts for use in pediatric practice. J Pediatr 1945;27:215--29.
- Stuart HC, Meredith HV. Use of body measurements in the school health program. Am J Public Health 1946;36:1365--86.
- Bayley N. Growth charts of height and weight by age for boys and girls scaled according to physical maturity. J Pediatr 1956;48:187--94.
- Reed RB, Stuart HC. Patterns of growth in height and weight from birth to eighteen years of age. Pediatrics 1959;24:904--21.
- Hamill PVV. NCHS growth curves for children. Vital Health Stat 1977;11(165).
- Dibley MJ, Goldsby JB, Staehling NW, Trowbridge FL. Development of normalized curves for the international growth reference: historical and technical considerations. Am J Clin Nutr 1987;46:736--48.
- de Onis M, Garza C, Victora CG, Onyango AW, Frongillo EA, Martines J. The WHO Multicentre Growth Reference Study: planning, study design, and methodology. Food Nutr Bull 2004;25:S15--26.
- Habicht JP, Martorell R, Yarbrough C, Malina RM, Klein RE. Height and weight standards for preschool children. How relevant are ethnic differences in growth potential? Lancet 1974;1:611--4.
- Graitcer PL, Gentry EM. Measuring children: one reference for all. Lancet 1981;2:297--9.
- CDC. Pediatric and Pregnancy Nutrition Surveillance System. Available online at http://www.cdc.gov/pednss. Accessed June 1, 2010.
- de Onis M, Onyango AW, Van den Broeck J, Chumlea WC, Martorell R. Measurement and standardization protocols for anthropometry used in the construction of a new international growth reference. Food Nutr Bull 2004;25: S27--36.
- National Center for Health Statistics. Plan and operation of the Third National Health and Nutrition Examination Survey, 1988--94. Vital Health Stat 1 1994;(32).
- Cole TJ, Green PJ. Smoothing reference centile curves: the LMS method and penalized likelihood. Stat Med 1992;11:1305--19.
- Cole TJ. The LMS method for constructing normalized growth standards. Eur J Clin Nutr 1990;44:45--60.
- Flegal KM, Wei R, Ogden CL, Freedman DS, Johnson CL, Curtin LR. Characterizing extreme values of body mass index-for-age by using the 2000 Centers for Disease Control and Prevention growth charts. Am J Clin Nutr 2009;90:1314--20.
- Otten JJ, Hellwig JP, Meyers LD, eds. Dietary reference intakes: the essential guide to nutrient requirements. Washington, DC: The National Academies Press; 2006.
- CDC. Breastfeeding among U.S. children born 1999--2007. CDC National Immunization Survey. Available online at http://www.cdc.gov/breastfeeding/data/NIS_data. Accessed August 2, 2010.
- Heird WC. Progress in promoting breast-feeding, combating malnutrition, and composition and use of infant formula, 1981--2006. J Nutr 2007;137:499S--502.
- American Academy of Pediatrics, Section on Breastfeeding. Breastfeeding and the use of human milk. Pediatrics 2005;115:496--506
- Dewey KG. Growth characteristics of breast-fed compared to formula-fed infants. Biol Neonate 1998;74:94--105.
- Dewey KG. Growth patterns of breastfed infants and the current status of growth charts for infants. J Hum Lact 1998;14:89--92.
- Mei Z, Ogden CL, Flegal KM, Grummer-Strawn LM. Comparison of the prevalence of shortness, underweight, and overweight among US children aged 0 to 59 months by using the CDC 2000 and the WHO 2006 growth charts. J Pediatr 2008;153:622--8.
- Wright JA, Ashenburg CA, Whitaker RC. Comparison of methods to categorize undernutrition in children. J Pediat 1994;124:944--6.
- Sherry BL. Epidemiology of inadequate growth. In Kessler DB, Dawson P, eds. Failure to thrive and pediatric undernutrition: a transdisciplinary approach. Baltimore: Paul H. Brookes, pp. 19--36.
- Dietitians of Canada, Canadian Paediatric Society; The College Of Family Physicians Of Canada; Community Health Nurses of Canada. Promoting optimal monitoring of child growth in Canada: using the new WHO growth charts. Collaborative Statement of the Dietitians of Canada, Canadian Paediatric Society, The College Of Family Physicians Of Canada, and Community Health Nurses of Canada. 2010. Available at http://www.cps.ca/english/publications/cps10-01.htm. Accessed June 1, 2010.
- de Onis M, Onyango AW, Borghi E, Siyam A, Nishida C, Siekmann J. Development of a WHO growth reference for school-aged children and adolescents. Bull World Health Organ 2007;85:660--7.
- Scientific Advisory Committee on Nutrition; The Royal College of Paediatrics and Child Health (2007). Application of WHO Growth Standards in the UK. London: The Stationery Office; 2007. Available at http://www.rcpch.ac.uk/doc.aspx?id_resource=2862. Accessed June 1, 2010.
- Department of Health (United Kingdom). Using the new UK---World Health Organization 0--4 years growth charts: information for healthcare professionals about the use and interpretation of growth charts. 2009. Available at http://www.dh.gov.uk/prod_consum_dh/groups/dh_digitalassets/documents/digitalasset/dh_110425.pdf. Accessed June 1, 2010.
- Ziegler EE, Nelson SE. Growth charts compared. Nestle Nutr Workshop Ser Pediatr Program 2010;65:197--212.
- Roelants M, Hauspie R, Hoppenbrouwers K. Breastfeeding, growth and growth standards: performance of the WHO growth standards for monitoring growth of Belgian children. Ann Hum Biol 2010;37:2--9.
- Nash A, Secker D, Corey M, Dunn M, O'Connor DL. Field testing of the 2006 World Health Organization growth charts from birth to 2 years: assessment of hospital undernutrition and overnutrition rates and the usefulness of BMI. JPEN J Parenter Enteral Nutr 2008;32:145--53.
- de Onis M, Garza C, Onyango AW, Borghi E. Comparison of the WHO child growth standards and the CDC 2000 growth charts. J Nutr 2007;137:144--8.
- Yang H, de Onis M. Algorithms for converting estimates of child malnutrition based on the NCHS reference into estimates based on the WHO child growth standards. BMC Pediatr 2008;8:19.
- Mei Z, Grummer-Strawn LM. Standard deviation of anthropometric Z-scores as a data quality assessment tool using the 2006 WHO growth standards: a cross country analysis. Bull World Health Organ 2007;85:441--8.
- Onyango AW, de Onis M, Caroli M, et al. Field-testing the WHO child growth standards in four countries. J Nutr 2007;137:149--52.
- Sguassero Y, Moyano C, Aronna A, Fain H, Orellano A, Carroli B. Field testing of new WHO growth standards: assessment of anthropometric outcomes of children from 0 to 5 years from Rosario city, Argentina [Spanish]. Arch Argent Pediatr 2008;106:198--204.
|
TABLE 2. Comparison of sample populations used to create the CDC and WHO growth curves for children aged 24--59 mos |
||
|---|---|---|
|
Characteristic |
CDC growth reference (2000)* |
WHO growth standard (2006)† |
|
Data sources |
NHANES I (1971--1974) NHANES II (1976--1980) NHANES III (1988--1994) |
MGRS cross-sectional component, with sites in the following locations: Pelotas, Brazil Accra, Ghana Delhi, India Oslo, Norway Muscat, Oman Davis, California |
|
Type and frequency of data collection |
Cross-sectional data |
Cross-sectional data |
|
Sample size |
9,894 |
6,669 |
|
Exclusion criteria |
None |
Low socioeconomic status Birth at altitude >1,500 m Birth at <37 wks or ≥42 wks Multiple birth Perinatal morbidities Child health conditions known to affect growth Maternal smoking during pregnancy or lactation Never breastfed or breastfed for <3 mos Multiple birth Preterm birth Weight-for-length measurements >3 standard deviations below or >2 standard deviations above study median for sex |
|
Breastfeeding among infants in sample |
Approximately 50% ever breastfed Approximately 33% breastfeeding at 3 mos |
100% ever breastfed 100% breastfeeding at 3 mos |
|
Abbreviations: MGRS = Multicentre Growth Reference Study; NHANES = National Health and Nutrition Examination Survey; WHO = World Health Organization. * Source: Kuczmarski RJ, Ogden CL, Guo SS, et al. 2000 CDC growth charts for the United States: methods and development. Vital Health Stat 2002;246. † Sources: World Health Organization. WHO child growth standards: length/height-for-age, weight-for-age, weight-for-height and body mass index-for-age: Methods and development. Geneva, Switzerland: World Health Organization; 2006. Available at http://www.who.int/childgrowth/publications/technical_report_pub/en/index.html. Accessed June 1, 2010; and WHO Multicentre Growth Reference Study Group. Enrolment and baseline characteristics in the WHO Multicentre Growth Reference Study. Acta Paediatr Suppl 2006;450:7--15. |
||
FIGURE 1. Mean length measurements of children aged <24 months in six sites worldwide --- World Health Organization Multicentre Growth Reference Study, 2006
Source: WHO Multicentre Growth Reference Study Group. Assessment of differences in linear growth among populations in the WHO Multicentre Growth Reference Study. Acta Paediatr Suppl 2006;450:56--65.
Alternate Text: This figure is a line graph of curves showing the mean length measurements of children aged <24 months in six international sites: Pelotas, Brazil; Accra, Ghana; Delhi, India; Oslo, Norway; Muscat, Oman; and Davis, California. The mean length measurements of these children was virtually identical; the six curves are almost indistinguishable in the figure.
FIGURE 2. Comparison of World Health Organization (WHO) and CDC growth chart weight-for-age measurements for girls aged <24 months
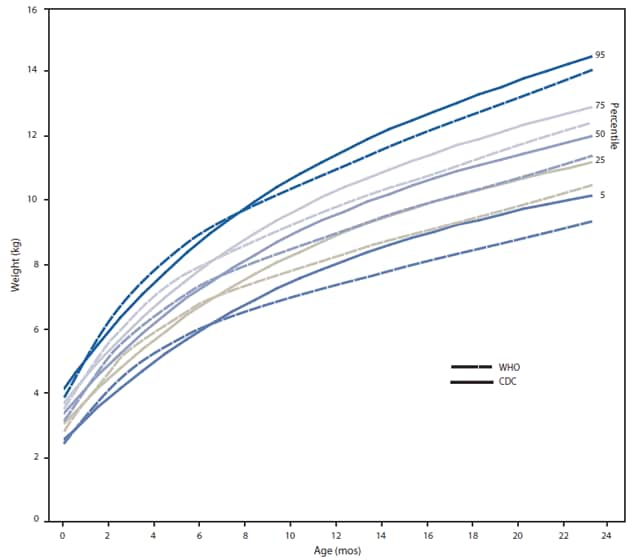
Alternate Text: This figure is a line graph comparing the WHO and CDC growth chart weight-for-age measurements for girls aged <24 months. In the first few months of life, WHO curves show a faster rate of weight gain than the CDC charts. Beginning at approximately age 3 months, WHO curves show a slower rate of weight gain than the CDC charts.
FIGURE 3. Comparison of World Health Organization (WHO) and CDC growth chart weight-for-age measurements for boys aged <24 months
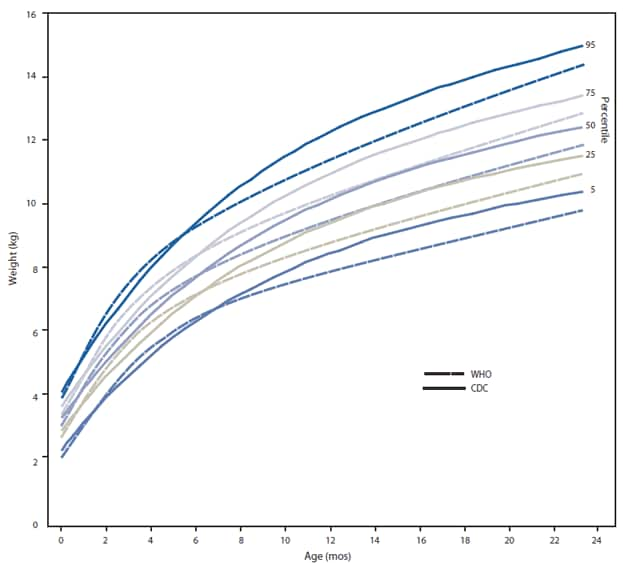
Alternate Text: This figure is a line graph comparing the WHO and CDC growth chart weight-for-age measurements for boys aged <24 months. In the first few months of life, WHO curves show a faster rate of weight gain than the CDC charts. Beginning at approximately age 3 months, WHO curves show a slower rate of weight gain than the CDC charts.
FIGURE 4. Comparison of World Health Organization (WHO) and CDC growth chart length/stature-for-age measurements for girls aged <5 yrs
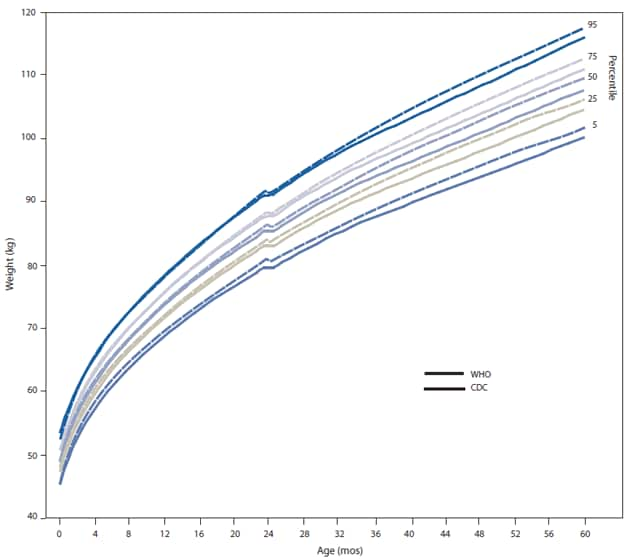
Alternate Text: This figure is a line graph comparing the WHO and CDC growth chart length/stature-for-age measurements for girls aged <5 years. The prevalence of short stature is similar for both sets of curves. Differences in the length-for-age WHO and CDC charts are small, and clinical differences based on these charts are expected to be insignificant.
FIGURE 5. Comparison of World Health Organization (WHO) and CDC growth chart length/stature-for-age measurements for boys aged <5 yrs
Alternate Text: This figure is a line graph comparing the WHO and CDC growth chart length/stature-for-age measurements for boys aged <5 years. The prevalence of short stature is similar for both sets of curves. Differences in the length-for-age WHO and CDC charts are small, and clinical differences based on these charts are expected to be insignificant.
FIGURE 6. Comparison of the World Health Organization (WHO) and CDC growth chart prevalences of low length for age, low weight for age, and high weight for length among children aged <24 months --- United States, 1999--2004
Source: Data from the National Health and Nutrition Examination Survey, 1999--2004.
* ≤5th percentile on the CDC charts; ≤2.3rd percentile on the WHO charts.
† ≥95th percentile on the CDC charts; ≥97.7th percentile on the WHO charts.
Alternate Text: This figure is a bar graph comparing WHO and CDC low length and weight for age and high weight for age among children aged <24 months. A substantial difference exists in the prevalence of low weight for age, with the WHO standard showing a lower prevalence beginning at age 6 months. The CDC reference identifies 7%–11% of children aged 6–23 months as having low weight for age, whereas the WHO stan¬dard identifies <3%. The WHO standard also identifies fewer infants (aged <12 months) as having high weight for length (5%–9%) than the CDC reference (9%–13%). For children aged 18–23 months, the differences in high weight for length essentially disappear. The prevalence of short stature is similar for both sets of curves.
Participants in the 2006 Expert Panel Review of World Health Organization and CDC Growth Charts
CDC: Katherine Flegal, PhD, Cliff Johnson, MSPH, Cynthia Ogden, PhD, Edward Sondik, PhD, Rong Wei, PhD, National Center for Health Statistics, Hyattsville, Maryland. Laurence M. Grummer-Strawn, PhD, Zuguo Mei, MD, Christopher Reinold, PhD, Diane Thompson, MPH, National Center for Chronic Disease Prevention and Health Promotion, Atlanta, Georgia.
National Institutes of Health: Gilman Grave, MD, Mary Hediger, PhD, National Institute of Child Health and Human Development, Bethesda, Maryland. Van S. Hubbard, MD, PhD, Wendy Johnson-Askew, PhD, Robert Kuczmarski, DrPH, National Institute of Diabetes and Digestive and Kidney Diseases, Bethesda, Maryland.
American Academy of Pediatrics: Ellen Buerk, MD, Oxford, Ohio. Arthur Eidelman, MD, Shaare Zedek Medical Center Jerusalem, Israel. Frank Greer, MD, Meriter Hospital, Madison, Wisconsin. Nancy Krebs, MD, University of Colorado Denver, Denver, Colorado. Ruth Lawrence, MD, University of Rochester School of Medicine and Dentistry, Rochester, New York. Lori Feldman-Winter, MD, Children's Regional Hospital at Cooper, University of Medicine and Dentistry of New Jersey---Robert Wood Johnson Medical School, Camden, New Jersey.
Other Federal Government Agencies: Sue Ann Anderson, PhD, Food and Drug Administration, Washington, DC. Donna Blum-Kemelor, PhD, Patricia Daniels, Jay Hirschman, U.S. Department of Agriculture, Alexandria, Virginia; Elizabeth Frazao, PhD, U.S. Department of Agriculture, Washington, DC. Steve Kessel, MD, PhD, Department of Health and Human Services, Washington, DC. Iris Mabry-Hernandez, MD, Agency for Healthcare Research and Quality, Washington, DC. Denise Sofka, MPH, Health Resources and Services Administration.
Invited Experts: Diane Anderson, PhD, American Dietetic Association, Baylor College of Medicine, Baylor, Texas. Mary Ann Best, PhD, National Association of Pediatric Nurse Practitioners, University of Texas Medical Branch, School of Nursing, Galveston, Texas. Margaret Boland, MD, North American Society for Pediatric Gastroenterology, Hepatology, and Nutrition, Children's Hospital of Eastern Ontario, University of Ottawa, Ontario, Canada. Nancy Butte, PhD, Baylor College of Medicine, Baylor, Texas. Katherine Dewey, PhD, Site Coordinator, Multicentre Growth Reference Study, University of California, Davis, Davis, California. Cutberto Garza, MD, PhD, Co-Principal Investigator, Multicentre Growth Reference Study, Boston College, Chestnut Hill, Massachusetts. John Himes, PhD, University of Minnesota School of Public Health, Minneapolis, Minnesota. Chessa Lutter, PhD, Pan American Health Organization, Washington, DC. Reynaldo Martorell, PhD, Emory University, Atlanta, Georgia. Van Nguyen, Community Clinic Inc., Women, Infants, and Children Program, Takoma Park, Maryland. Eckhart Ziegler, MD, University of Iowa Children's Hospital, Iowa City, Iowa.
Use of trade names and commercial sources is for identification only and does not imply endorsement by the U.S. Department of
Health and Human Services.
References to non-CDC sites on the Internet are
provided as a service to MMWR readers and do not constitute or imply
endorsement of these organizations or their programs by CDC or the U.S.
Department of Health and Human Services. CDC is not responsible for the content
of pages found at these sites. URL addresses listed in MMWR were current as of
the date of publication.
All MMWR HTML versions of articles are electronic conversions from typeset documents.
This conversion might result in character translation or format errors in the HTML version.
Users are referred to the electronic PDF version (http://www.cdc.gov/mmwr)
and/or the original MMWR paper copy for printable versions of official text, figures, and tables.
An original paper copy of this issue can be obtained from the Superintendent of Documents, U.S.
Government Printing Office (GPO), Washington, DC 20402-9371;
telephone: (202) 512-1800. Contact GPO for current prices.
**Questions or messages regarding errors in formatting should be addressed to
mmwrq@cdc.gov.
