Increases in Drug and Opioid Overdose Deaths — United States, 2000–2014
, MSPH1; , JD1; , PhD1; R. , PhD1
The United States is experiencing an epidemic of drug overdose (poisoning) deaths. Since 2000, the rate of deaths from drug overdoses has increased 137%, including a 200% increase in the rate of overdose deaths involving opioids (opioid pain relievers and heroin). CDC analyzed recent multiple cause-of-death mortality data to examine current trends and characteristics of drug overdose deaths, including the types of opioids associated with drug overdose deaths. During 2014, a total of 47,055 drug overdose deaths occurred in the United States, representing a 1-year increase of 6.5%, from 13.8 per 100,000 persons in 2013 to 14.7 per 100,000 persons in 2014. The rate of drug overdose deaths increased significantly for both sexes, persons aged 25–44 years and ≥55 years, non-Hispanic whites and non-Hispanic blacks, and in the Northeastern, Midwestern, and Southern regions of the United States. Rates of opioid overdose deaths also increased significantly, from 7.9 per 100,000 in 2013 to 9.0 per 100,000 in 2014, a 14% increase. Historically, CDC has programmatically characterized all opioid pain reliever deaths (natural and semisynthetic opioids, methadone, and other synthetic opioids) as "prescription" opioid overdoses (1). Between 2013 and 2014, the age-adjusted rate of death involving methadone remained unchanged; however, the age-adjusted rate of death involving natural and semisynthetic opioid pain relievers, heroin, and synthetic opioids, other than methadone (e.g., fentanyl) increased 9%, 26%, and 80%, respectively. The sharp increase in deaths involving synthetic opioids, other than methadone, in 2014 coincided with law enforcement reports of increased availability of illicitly manufactured fentanyl, a synthetic opioid; however, illicitly manufactured fentanyl cannot be distinguished from prescription fentanyl in death certificate data. These findings indicate that the opioid overdose epidemic is worsening. There is a need for continued action to prevent opioid abuse, dependence, and death, improve treatment capacity for opioid use disorders, and reduce the supply of illicit opioids, particularly heroin and illicit fentanyl.
The National Vital Statistics System multiple cause-of-death mortality files were used to identify drug overdose deaths.* Drug overdose deaths were classified using the International Classification of Disease, Tenth Revision (ICD-10), based on the ICD-10 underlying cause-of-death codes X40–44 (unintentional), X60–64 (suicide), X85 (homicide), or Y10–Y14 (undetermined intent) (2). Among the deaths with drug overdose as the underlying cause, the type of opioid involved is indicated by the following ICD-10 multiple cause-of-death codes: opioids (T40.0, T40.1, T40.2, T40.3, T40.4, or T40.6); natural and semisynthetic opioids (T40.2); methadone (T40.3); synthetic opioids, other than methadone (T40.4); and heroin (T40.1). Some deaths involve more than one type of opioid; these deaths were included in the rates for each category (e.g., a death involving both a synthetic opioid and heroin would be included in the rates for synthetic opioid deaths and in the rates for heroin deaths). Age-adjusted death rates were calculated by applying age-specific death rates to the 2000 U.S standard population age distribution (3). Significance testing was based on the z-test at a significance level of 0.05.
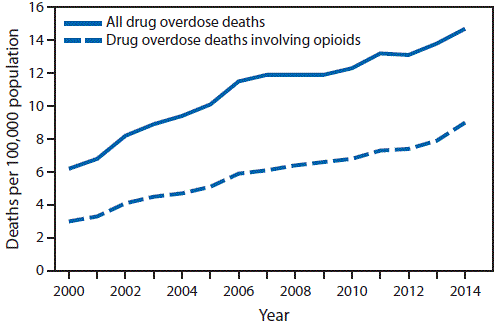
During 2014, 47,055 drug overdose deaths occurred in the United States. Since 2000, the age-adjusted drug overdose death rate has more than doubled, from 6.2 per 100,000 persons in 2000 to 14.7 per 100,000 in 2014 (Figure 1). The overall number and rate of drug overdose deaths increased significantly from 2013 to 2014, with an additional 3,073 deaths occurring in 2014 (Table), resulting in a 6.5% increase in the age-adjusted rate. From 2013 to 2014, statistically significant increases in drug overdose death rates were seen for both males and females, persons aged 25–34 years, 35–44 years, 55–64 years, and ≥65 years; non-Hispanic whites and non-Hispanic blacks; and residents in the Northeast, Midwest and South Census Regions (Table). In 2014, the five states with the highest rates of drug overdose deaths were West Virginia (35.5 deaths per 100,000), New Mexico (27.3), New Hampshire (26.2), Kentucky (24.7) and Ohio (24.6).† States with statistically significant increases in the rate of drug overdose deaths from 2013 to 2014 included Alabama, Georgia, Illinois, Indiana, Maine, Maryland, Massachusetts, Michigan, New Hampshire, New Mexico, North Dakota, Ohio, Pennsylvania, and Virginia.
In 2014, 61% (28,647, data not shown) of drug overdose deaths involved some type of opioid, including heroin. The age-adjusted rate of drug overdose deaths involving opioids increased significantly from 2000 to 2014, increasing 14% from 2013 (7.9 per 100,000) to 2014 (9.0) (Figure 1). From 2013 to 2014, the largest increase in the rate of drug overdose deaths involved synthetic opioids, other than methadone (e.g., fentanyl and tramadol), which nearly doubled from 1.0 per 100,000 to 1.8 per 100,000 (Figure 2). Heroin overdose death rates increased by 26% from 2013 to 2014 and have more than tripled since 2010, from 1.0 per 100,000 in 2010 to 3.4 per 100,000 in 2014 (Figure 2). In 2014, the rate of drug overdose deaths involving natural and semisynthetic opioids (e.g., morphine, oxycodone, and hydrocodone), 3.8 per 100,000, was the highest among opioid overdose deaths, and increased 9% from 3.5 per 100,000 in 2013. The rate of drug overdose deaths involving methadone, a synthetic opioid classified separately from other synthetic opioids, was similar in 2013 and 2014.
Discussion
More persons died from drug overdoses in the United States in 2014 than during any previous year on record. From 2000 to 2014 nearly half a million persons in the United States have died from drug overdoses. In 2014, there were approximately one and a half times more drug overdose deaths in the United States than deaths from motor vehicle crashes (4). Opioids, primarily prescription pain relievers and heroin, are the main drugs associated with overdose deaths. In 2014, opioids were involved in 28,647 deaths, or 61% of all drug overdose deaths; the rate of opioid overdoses has tripled since 2000. The 2014 data demonstrate that the United States' opioid overdose epidemic includes two distinct but interrelated trends: a 15-year increase in overdose deaths involving prescription opioid pain relievers and a recent surge in illicit opioid overdose deaths, driven largely by heroin.
Natural and semisynthetic opioids, which include the most commonly prescribed opioid pain relievers, oxycodone and hydrocodone, continue to be involved in more overdose deaths than any other opioid type. Although this category of opioid drug overdose death had declined in 2012 compared with 2011, and had held steady in 2013, there was a 9% increase in 2014.
Drug overdose deaths involving heroin continued to climb sharply, with heroin overdoses more than tripling in 4 years. This increase mirrors large increases in heroin use across the country (5) and has been shown to be closely tied to opioid pain reliever misuse and dependence. Past misuse of prescription opioids is the strongest risk factor for heroin initiation and use, specifically among persons who report past-year dependence or abuse (5). The increased availability of heroin, combined with its relatively low price (compared with diverted prescription opioids) and high purity appear to be major drivers of the upward trend in heroin use and overdose (6).
The rate of drug overdose deaths involving synthetic opioids nearly doubled between 2013 and 2014. This category includes both prescription synthetic opioids (e.g., fentanyl and tramadol) and non-pharmaceutical fentanyl manufactured in illegal laboratories (illicit fentanyl). Toxicology tests used by coroners and medical examiners are unable to distinguish between prescription and illicit fentanyl. Based on reports from states and drug seizure data, however, a substantial portion of the increase in synthetic opioid deaths appears to be related to increased availability of illicit fentanyl (7), although this cannot be confirmed with mortality data. For example, five jurisdictions (Florida, Maryland, Maine, Ohio, and Philadelphia, Pennsylvania) that reported sharp increases in illicit fentanyl seizures, and screened persons who died from a suspected drug overdose for fentanyl, detected similarly sharp increases in fentanyl-related deaths (7).§ Finally, illicit fentanyl is often combined with heroin or sold as heroin. Illicit fentanyl might be contributing to recent increases in drug overdose deaths involving heroin. Therefore, increases in illicit fentanyl-associated deaths might represent an emerging and troubling feature of the rise in illicit opioid overdoses that has been driven by heroin.
The findings in this report are subject to at least three limitations. First, several factors related to death investigation might affect estimates of death rates involving specific drugs. At autopsy, toxicological laboratory tests might be performed to determine the type of drugs present; however, the substances tested for and circumstances under which the tests are performed vary by jurisdiction. Second, in 2013 and 2014, 22% and 19% of drug overdose deaths, respectively, did not include information on the death certificate about the specific types of drugs involved. The percent of overdose deaths with specific drugs identified on the death certificate varies widely by state. Some of these deaths might have involved opioids. This increase in the reporting of specific drugs in 2014 might have contributed to some of the observed increases in drug overdose death rates involving different types of opioids from 2013 to 2014. Finally, some heroin deaths might be misclassified as morphine because morphine and heroin are metabolized similarly (8), which might result in an underreporting of heroin overdose deaths.
To reverse the epidemic of opioid drug overdose deaths and prevent opioid-related morbidity, efforts to improve safer prescribing of prescription opioids must be intensified. Opioid pain reliever prescribing has quadrupled since 1999 and has increased in parallel with overdoses involving the most commonly used opioid pain relievers (1). CDC has developed a draft guideline for the prescribing of opioids for chronic pain to address this need.¶
In addition, efforts are needed to protect persons already dependent on opioids from overdose and other harms. This includes expanding access to and use of naloxone (a safe and effective antidote for all opioid-related overdoses)** and increasing access to medication-assisted treatment, in combination with behavioral therapies (9). Efforts to ensure access to integrated prevention services, including access to syringe service programs when available, is also an important consideration to prevent the spread of hepatitis C virus and human immunodeficiency virus infections from injection drug use.
Public health agencies, medical examiners and coroners, and law enforcement agencies can work collaboratively to improve detection of outbreaks of drug overdose deaths involving illicit opioids (including heroin and illicit fentanyl) through improved investigation and testing as well as reporting and monitoring of specific drugs, and facilitate a rapid and effective response that can address this emerging threat to public health and safety (7). Efforts are needed to distinguish the drugs contributing to overdoses to better understand this trend.
1Division of Unintentional Injury Prevention, National Center for Injury Prevention and Control, CDC.
Corresponding author: Rose A. Rudd, rvr2@cdc.gov, 770-488-3712.
References
- Paulozzi LJ, Jones C, Mack K, Rudd R. Vital signs: overdoses of prescription opioid pain relievers—United States, 1999–2008. MMWR Morb Mortal Wkly Rep 2011;60:1487–92.
- Bergen G, Chen LH, Warner M, Fingerhut LA. Injury in the United States: 2007 chartbook. Hyattsville, MD: National Center for Health Statistics; 2008 Available at http://www.cdc.gov/nchs/data/misc/injury2007.pdf.
- Murphy SL, Xu JQ, Kochanek KD. Deaths: final data for 2010. National vital statistics reports. Hyattsville, MD: National Center for Health Statistics; 2013. Available at http://www.cdc.gov/nchs/data/nvsr/nvsr61/nvsr61_04.pdf.
- CDC. Wide-ranging online data for epidemiologic research (WONDER). Atlanta, GA: CDC, National Center for Health Statistics; 2015. Available at http://wonder.cdc.gov.
- Jones CM, Logan J, Gladden RM, Bohm MK. Vital signs: demographic and substance use trends among heroin users—United States, 2002–2013. MMWR Morb Mortal Wkly Rep 2015;64:719–25.
- Cicero TJ, Ellis MS, Surratt HL, Kurtz SP. The changing face of heroin use in the United States: a retrospective analysis of the past fifty years. JAMA Psychiatry 2014;71:821–6.
- CDC. Increases in fentanyl drug confiscations and fentanyl-related overdose fatalities. HAN Health Advisory. Atlanta, GA: US Department of Health and Human Services, CDC; 2015. Available at http://emergency.cdc.gov/han/han00384.asp.
- Davis GG. Complete republication: National Association of Medical Examiners position paper: recommendations for the investigation, diagnosis, and certification of deaths related to opioid drugs. J Med Toxicol 2014;10:100–6.
- Volkow ND, Frieden TR, Hyde PS, Cha SS. Medication-assisted therapies—tackling the opioid-overdose epidemic. N Engl J Med 2014;370:2063–6.
* Additional information available at http://www.cdc.gov/nchs/nvss/mortality_public_use_data.htm.
† Additional information available at http://www.cdc.gov/drugoverdose/data/statedeaths.html.
§ Additional information available at http://pub.lucidpress.com/NDEWSFentanyl/.
¶ Additional information available at http://www.cdc.gov/drugoverdose/prescribing/guideline.html.
** Additional information available at https://store.samhsa.gov/shin/content/SMA13-4742/Overdose_Toolkit_2014_Jan.pdf.
Summary
What is already known on this topic?
The rate for drug overdose deaths has increased approximately 140% since 2000, driven largely by opioid overdose deaths. After increasing since the 1990s, deaths involving the most commonly prescribed opioid pain relievers (i.e., natural and semisynthetic opioids) declined slightly in 2012 and remained steady in 2013, showing some signs of progress. Heroin overdose deaths have been sharply increasing since 2010.
What is added by this report?
Drug overdose deaths increased significantly from 2013 to 2014. Increases in opioid overdose deaths were the main factor in the increase in drug overdose deaths. The death rate from the most commonly prescribed opioid pain relievers (natural and semisynthetic opioids) increased 9%, the death rate from heroin increased 26%, and the death rate from synthetic opioids, a category that includes illicitly manufactured fentanyl and synthetic opioid pain relievers other than methadone, increased 80%. Nearly every aspect of the opioid overdose death epidemic worsened in 2014.
What are the implications for public health practice?
Efforts to encourage safer prescribing of opioid pain relievers should be strengthened. Other key prevention strategies include expanding availability and access to naloxone (an antidote for all opioid-related overdoses), increasing access to medication-assisted treatment in combination with behavioral therapies, and increasing access to syringe service programs to prevent the spread of hepatitis C virus infection and human immunodeficiency virus infections. Public health agencies, medical examiners and coroners, and law enforcement agencies can work collaboratively to improve detection of and response to outbreaks associated with drug overdoses related to illicit opioids.
FIGURE 1. Age-adjusted rate* of drug overdose deaths† and drug overdose deaths involving opioids§,¶ — United States, 2000–2014
Source: National Vital Statistics System, Mortality file.
* Age-adjusted death rates were calculated by applying age-specific death rates to the 2000 U.S. standard population age distribution.
† Drug overdose deaths are identified using International Classification of Diseases, Tenth Revision underlying cause-of-death codes X40–X44, X60–X64, X85, and Y10–Y14.
§ Drug overdose deaths involving opioids are drug overdose deaths with a multiple cause-of-death code of T40.0, T40.1, T40.2, T40.3, T40.4, or T40.6. Approximately one fifth of drug overdose deaths lack information on the specific drugs involved. Some of these deaths might involve opioids.
¶ Opioids include drugs such as morphine, oxycodone, hydrocodone, heroin, methadone, fentanyl, and tramadol.
Alternate Text: The figure above is a line chart showing age-adjusted rate of drug overdose deaths and drug overdose deaths involving opioids in the United States during 2000-2014.

Source: National Vital Statistics System, Mortality file.
* Age-adjusted death rates were calculated by applying age-specific death rates to the 2000 U.S. standard population age distribution.
† Drug overdose deaths involving opioids are identified using International Classification of Diseases, Tenth Revision underlying cause-of-death codes X40–X44, X60–X64, X85, and Y10–Y14 with a multiple cause code of T40.0, T40.1, T40.2, T40.3, T40.4, or T40.6.
§ Opioids include drugs such as morphine, oxycodone, hydrocodone, heroin, methadone, fentanyl, and tramadol.
¶ For each type of opioid, the multiple cause-of-death code was T40.1 for heroin, T40.2 for natural and semisynthetic opioids (e.g., oxycodone and hydrocodone), T40.3 for methadone, and T40.4 for synthetic opioids excluding methadone (e.g., fentanyl and tramadol). Deaths might involve more than one drug thus categories are not exclusive.
Alternate Text: The figure above is a line chart showing drug overdose deaths involving opioids, by type of opioid, in the United States during 2000-2014.
|
TABLE. (Continued) Number and age-adjusted rates of drug overdose deaths,* by sex, age, race and Hispanic origin,† Census region, and state — United States, 2013 and 2014 |
|||||
|---|---|---|---|---|---|
|
Decedent characteristic |
2013 |
2014 |
% change from 2013 to 2014 |
||
|
No. |
Age-adjusted rate |
No. |
Age-adjusted rate |
||
|
Pennsylvania |
2,426 |
19.4 |
2,732 |
21.9 |
12.9§ |
|
Rhode Island |
241 |
22.4 |
247 |
23.4 |
4.5 |
|
South Carolina |
620 |
13.0 |
701 |
14.4 |
10.8 |
|
South Dakota |
55 |
6.9 |
63 |
7.8 |
13.0 |
|
Tennessee |
1,187 |
18.1 |
1,269 |
19.5 |
7.7 |
|
Texas |
2,446 |
9.3 |
2,601 |
9.7 |
4.3 |
|
Utah |
594 |
22.1 |
603 |
22.4 |
1.4 |
|
Vermont |
93 |
15.1 |
83 |
13.9 |
-7.9 |
|
Virginia |
854 |
10.2 |
980 |
11.7 |
14.7§ |
|
Washington |
969 |
13.4 |
979 |
13.3 |
-0.7 |
|
West Virginia |
570 |
32.2 |
627 |
35.5 |
10.2 |
|
Wisconsin |
856 |
15.0 |
853 |
15.1 |
0.7 |
|
Wyoming |
98 |
17.2 |
109 |
19.4 |
12.8 |
|
Source: National Vital Statistics System, Mortality file. * Deaths are classified using the International Classification of Diseases, Tenth Revision (ICD–10). Drug overdose deaths are identified using underlying cause-of-death codes X40–X44, X60–X64, X85, and Y10–Y14. Age-adjusted death rates were calculated by applying age-specific death rates to the 2000 U.S standard population age distribution. † Data for Hispanic origin should be interpreted with caution; studies comparing Hispanic origin on death certificates and on census surveys have shown inconsistent reporting on Hispanic ethnicity. § Statistically significant change from 2013 to 2014. |
|||||
Use of trade names and commercial sources is for identification only and does not imply endorsement by the U.S. Department of
Health and Human Services.
References to non-CDC sites on the Internet are
provided as a service to MMWR readers and do not constitute or imply
endorsement of these organizations or their programs by CDC or the U.S.
Department of Health and Human Services. CDC is not responsible for the content
of pages found at these sites. URL addresses listed in MMWR were current as of
the date of publication.
All MMWR HTML versions of articles are electronic conversions from typeset documents.
This conversion might result in character translation or format errors in the HTML version.
Users are referred to the electronic PDF version (http://www.cdc.gov/mmwr)
and/or the original MMWR paper copy for printable versions of official text, figures, and tables.
An original paper copy of this issue can be obtained from the Superintendent of Documents, U.S.
Government Printing Office (GPO), Washington, DC 20402-9371;
telephone: (202) 512-1800. Contact GPO for current prices.
**Questions or messages regarding errors in formatting should be addressed to
mmwrq@cdc.gov.
