Vaccination Coverage Among Children in Kindergarten — United States, 2014–15 School Year
, MPH1; , MS2; 1; , MPH2; 3; , MPH2; , DVM1; , MD1
State and local jurisdictions require children to be vaccinated before starting school to maintain high vaccination coverage and protect schoolchildren from vaccine-preventable diseases (1). State vaccination requirements, which include school vaccination and exemption laws and health department regulations, permit medical exemptions for students with a medical contraindication to receiving a vaccine or vaccine component and may allow nonmedical exemptions for religious reasons or philosophic beliefs. To monitor state and national vaccination coverage and exemption levels among children attending kindergarten, CDC analyzes school vaccination data collected by federally funded state, local, and territorial immunization programs. This report describes vaccination coverage estimates in 49 states and the District of Columbia (DC) and vaccination exemption estimates in 46 states and DC that reported the number of children with at least one exemption among kindergartners during the 2014–15 school year. Median vaccination coverage* was 94.0% for 2 doses of measles, mumps, and rubella (MMR) vaccine; 94.2% for the local requirements for diphtheria, tetanus, and acellular pertussis vaccine (DTaP); and 93.6% for 2 doses of varicella vaccine among the 39 states and DC with a 2-dose requirement. The median percentage of any exemptions† was 1.7%. Although statewide vaccination coverage among kindergartners was high during the 2014–15 school year, geographic pockets of low vaccination coverage and high exemption levels can place children at risk for vaccine-preventable diseases (2). Appropriate school vaccination coverage assessments can help immunization programs identify clusters of low coverage and develop partnerships with schools and communities to ensure that children are protected from vaccine-preventable diseases.
Federally funded immunization programs work with health departments, education departments, school nurses, or other school personnel to assess the vaccination and exemption status (as defined by state and local school vaccination requirements) of children enrolled in public and private kindergartens. Among the 50 states and DC, 44 programs used an immunization information system as a source of data for their assessment.§ For the 2014–15 school year, the type of vaccination assessment varied: 29 programs used a census, including all kindergartners in all schools; two used a voluntary response¶ of schools; 10 used a sample**; and 10 used a mix of methods.†† Three states (Alaska, Kansas, and New Mexico) used a sample to collect vaccination coverage data and a census for exemption data. Two local areas (Houston, Texas; New York, New York) reported separately. Because these areas are represented in their respective state reports, the area-specific data are not included in the calculation of median MMR, DTaP, and varicella vaccine coverage and medical, nonmedical, and any exemption levels.§§
Data from the assessments were aggregated by state or area¶¶ and sent to CDC. California, Minnesota, Oregon, Pennsylvania, and Vermont reported data for selected homeschooled kindergartners.*** The 49 states and DC reported vaccination coverage data for 4,121,322 kindergartners, and 46 states and DC reported exemption data, including the number of children with at least one exemption, for 3,829,686 kindergartners.†††
Vaccination coverage was used to identify state/local areas with high (≥90%) 2-dose MMR coverage (3), and median vaccination coverage was used to assess progress toward the national Healthy People 2020 target of ≥95% vaccination coverage for kindergartners.§§§ The reported medians for medical and any exemptions include the 45 states and DC that reported data for all types of allowed exemptions, whereas the median for nonmedical exemptions includes 46 states and DC that reported, for at least one type of allowed exemption, the number of children with an exemption. Coverage and exemption estimates were adjusted based on survey type and response rates. State and local vaccination requirements for school entry varied.¶¶¶ Kindergartners were considered up-to-date for any vaccine if they received all doses required for school entry in their residence jurisdiction. In most jurisdictions, kindergartners with a history of varicella disease are considered to be vaccinated against varicella, whereas in some jurisdictions they may be given a medical exemption. Eight states considered kindergartners up-to-date only if they had received all doses of all vaccines required for school entry in their jurisdiction.**** Coverage estimates were based on completed vaccination series in those jurisdictions. Among all 50 states and DC, 13 met CDC standards for school assessment methods in 2014–15.††††
Among the 49 reporting states and DC, median reported MMR coverage was 94.0% (range = 86.9% [Colorado] to 99.2% [Mississippi]); 17 areas reported MMR coverage ≥95%; and seven reported MMR coverage <90% (Table 1). Median reported DTaP coverage was 94.2% (range = 84.3% [Colorado] to 99.6% [Maryland]); 21 areas reported coverage ≥95%. Among the 39 states and DC requiring and reporting 2-dose varicella vaccination coverage, median reported coverage was 93.6% (range = 85.4% [Colorado] to 99.2% [Mississippi]); 17 areas reported coverage ≥95%.
Among the 45 states and DC reporting vaccination exemption data for any medical and nonmedical exemptions allowed in the jurisdictions, the percentage of kindergartners with any exemption was <1% in six states and ≥4% in 11 states (range = <0.1% [Mississippi] to 6.5% [Idaho]), with a median of 1.7% (Figure) (Table 2). Three states (Kansas, Maine, and Oregon) reported a decrease of >1.0 percentage points in exemptions from the 2013–14 school year to the 2014–15 school year. Where reported separately, the median percentage of medical exemptions was 0.2% (range = <0.1% in four states [Colorado, Hawaii, Mississippi, and Arkansas] to 1.3% [Alaska]). Where allowed and reported separately, the median percentage of nonmedical exemptions was 1.5% (range = 0.5% [DC] to 6.2% [Idaho]).
Discussion
Most federally funded immunization programs reported high vaccination coverage and low levels of exemptions among kindergartners. Even so, 32 states and DC did not report meeting the Healthy People 2020 target of ≥95% coverage with 2 MMR doses,§§§§ and seven states had <90% 2-dose MMR coverage. During 2015, measles outbreak cases have included 68 unvaccinated U.S. residents, among whom 29 (43%) cited philosophic or religious objections to vaccination (4). Maintaining high vaccination coverage levels is important for measles control and elimination (3).
CDC's Public Health Law Program recently reviewed state school and childcare vaccination requirements and provided a summary of state vaccination laws, including both statutes and regulations (5). State laws are subject to change and will continue to be tracked. For example, earlier this year, California removed both religious and philosophic exemptions for children attending public and private schools, and eliminated all vaccination requirements for homeschooled children; and Vermont removed philosophic but not religious exemptions for children in public and private schools. Both changes take effect at the beginning of the 2016–17 school year (6,7). Both states will continue to allow medical exemptions. Changes in vaccination requirements have resulted in changes in patterns of types of exemptions claimed, with an increase in the proportion of kindergartners with medical exemptions offsetting decreases in the proportion of kindergartners with nonmedical exemptions (8). Parents have the option, depending on state vaccination requirements, to place their children in private schools or to homeschool them to avoid state laws regarding exemptions. Continued monitoring of trends in vaccination coverage and exemptions, including the number of children exempted by type of exemption, and enrollment in public and private schools or homeschools, will be critical to identify the potential impact of changes in school vaccination requirements.
The current assessment methods used to estimate coverage and exemptions in many states might be insufficient for immunization programs to identify children or communities at risk for vaccine-preventable diseases and might limit the ability of immunization programs to respond to outbreaks. In assessing school vaccination coverage and exemptions, states must balance the need for efficiency, accuracy and ability to have estimates at the community, school or child level. Using immunization information system vaccination data can streamline data collection, and provide accurate vaccination coverage data at the community, child, and possibly school levels. A census report by all schools provides local data but might be more resource-intensive to obtain. Statistically appropriate sampling methods can streamline data collection and can be used to validate census data, but do not provide local data. Using a census to track exemptions is preferred to ensure that immunization and education programs can identify geographic clusters of high exemption levels at the school or community level. To track vaccination coverage, it is desirable to use immunization information system data, or census data with a sample validation of vaccination status. Schools with high exemption rates do not necessarily have low vaccination rates (e.g., if many exemptions are filed for convenience by parents of fully vaccinated children) and a low exemption rate does not necessarily imply a high vaccination rate (e.g., if school vaccination requirements are not applied in a school with lower vaccination rates). Local availability of reliable information might lead to improved and effective engagements with local partner organizations, including private and homeschool associations and the community, to enhance understanding of school vaccination requirements and address concerns, thereby helping to ensure that children are protected against vaccine-preventable diseases. Availability of local data can also help parents understand their child's risk within their school and community. During the 2014–15 school year, 21 states provided local-level coverage and exemption data online,¶¶¶¶ compared with 18 last school year and 11 in 2012–13.
The findings in this report are subject to at least four limitations. First, immunization programs used different school vaccination assessment methods. Assessments based on surveys or voluntary response (e.g., an incomplete census) can miss schools with higher or lower vaccination coverage and thereby bias results. Surveys with inadequate sample size will yield imprecise estimates. Additionally, differences in reporting vaccine-specific vaccination coverage and exemption data limit comparability across all immunization programs. Second, exemption status does not always reflect vaccination status. A child with an exemption might not be completely unvaccinated. Although state-reported exemptions varied from <0.1% to 6.5% in this assessment, >99% of the 2009–2011 birth cohort who became kindergartners in 2014–15 received at least one vaccine in early childhood (9). An exemption may be given for all vaccines even if a child missed all doses of a single vaccine or a single vaccine dose. Parents or guardians might have obtained an exemption rather than submit documentation of a child's vaccination history. This could account for up to 25% of nonmedical exemptions (10). Vaccination and exemption status reflected the child's status at the time of assessment or at an earlier point in the school year and might not have been updated when the child later received needed vaccines. Furthermore, exemptions do not account for all undervaccinated kindergartners. Third, because immunization programs do not have vaccination coverage and exemption data on all kindergartners, including those who are in private schools, in boarding schools, or are home-schooled, where vaccination requirements might be different or not measured, actual vaccination coverage could be different from estimates presented in this report. Finally, adjustments to account for nonresponse assumed similar vaccination coverage and level of exemptions among nonrespondents and respondents within the same school type.
School vaccination regulations provide an opportunity for children who are behind on vaccination in infancy to be vaccinated by school entry. For example, the kindergartners covered in this report were born during 2009–2011. Despite differences in methodologies, when this cohort of children was included in the National Immunization Survey of children aged 19–35 months, their coverage with ≥1 MMR dose was 90.8%, compared with a median of 94.0% who had received ≥2 doses in this assessment during the school 2014–15 school year (9). Appropriate school vaccination coverage assessments at the state and local levels for all kindergartners will be critical to aid in identification of communities at risk for vaccine-preventable disease transmission, where further action could improve vaccination coverage to ensure that more children are able to benefit from the protection offered by vaccines.
1Immunization Services Division, National Center for Immunization and Respiratory Diseases, CDC; 2Carter Consulting, Inc., Atlanta, Georgia; 3Leidos, Atlanta, Georgia.
Corresponding author: Ranee Seither, rseither@cdc.gov, 404-639-8693.
References
- Orenstein WA, Hinman AR. The immunization system in the United States—the role of school immunization laws. Vaccine 1999;17(Suppl 3):S19–24.
- Omer SB, Enger KS, Moulton LH, Halsey NA, Stokley S, Salmon DA. Geographic clustering of nonmedical exemptions to school immunization requirements and associations with geographic clustering of pertussis. Am J Epidemiol 2008;168:1389–96.
- Fine PEM, Mulholland K. Community immunity. In: Plotkin SA, Orenstein WA, Offit PA, eds. Vaccines. 6th ed. Chapter 71. Philadelphia, PA: Elsevier Inc., 2013:1395–412.
- Clemmons NS, Gastanaduy PA, Fiebelkorn AP, Redd SB, Wallace GS. Measles—United States, January 4–April 2, 2015. MMWR Morb Mortal Wkly Rep 2015;64:373–6.
- CDC. State school and childcare vaccination laws. Available at http://www.cdc.gov/phlp/publications/topic/vaccinations.html.
- California Department of Public Health. New Law (SB 277) effective in 2016. Available at http://www.shotsforschool.org/laws/exemptions.
- Burbank A. Shumlin signs bill removing vaccine exemption. Available at http://www.burlingtonfreepress.com/story/news/politics/2015/05/28/shumlin-vaccine-philosophical-exemption/28079499.
- Seither R, Masalovich S, Knighton CL, Mellerson J, Singleton JA, Greby SM. Vaccination coverage among children in kindergarten—United States, 2013–14 school year. MMWR Morb Mortal Wkly Rep 2014;63:913–20.
- CDC. National, state, and local area vaccination coverage among children aged 19–35 months—United States, 2012. MMWR Morb Mortal Wkly Rep 2013;62:733–40.
- Luthy KE, Beckstrand RL, Callister LC, Cahoon S. Reasons parents exempt children from receiving immunizations. J Sch Nurs 2012;28:153–60.
* Data from Hawaii, Houston, New York City, Guam, the Commonwealth of the Northern Mariana Islands, Puerto Rico, and the U.S. Virgin Islands were not included in the coverage medians. Hawaii reported the number of children compliant with school vaccination requirements, either by being vaccinated or by having an exemption.
† Data from Illinois, Minnesota, Missouri, Wyoming, Houston, New York City, Guam, the Commonwealth of the Northern Mariana Islands, Puerto Rico, and the U.S. Virgin Islands were not included in the exemption medians. Data from Texas were included in the median for nonmedical exemptions, but not for medical or any exemptions.
§ An immunization information system is a confidential, population-based, computerized database that records all immunization doses reported by participating providers to persons residing within a given geopolitical area.
¶ A voluntary response of schools was defined as census survey with a response rate <90% of the known population of kindergartners.
** The type of sample employed by the 10 states using a sample for determining coverage rates varied, and included a stratified two-stage cluster sample (eight states), a stratified one-stage cluster sample (one), and a simple random sample (one).
†† A mix of methods includes two or more described methods (e.g., a combination of a census and voluntary response).
§§ Texas collected and reported data from a self-report census of all schools and students in the state, including Houston. However, the estimates reported separately for Houston are not from the Texas census. Houston collected data from a nonrandom sample of schools as part of a different assessment directed by the Texas Department of State Health Services, and reported these results separately to CDC.
¶¶ Most of the programs using a census or voluntary response provided CDC with data aggregated at the state level. Coverage and exemption data based on a census were adjusted for nonresponse using the inverse of the response rate, stratified by school type. Programs using complex sample surveys provided CDC with de-identified data aggregated at the school or county level for weighted analysis. Weights were calculated to account for sample design and adjusted for nonresponse for data collected by complex sample design wherever possible. Data from Houston's nonrandom sample were analyzed as a stratified simple random sample.
*** California reported data for an unspecified number of homeschooled students, and these students might be included with public and private school students. Minnesota required vaccination and exemption reporting for homeschooled students beginning at age 7 years, although the actual number of homeschooled students included in the data is not known. Oregon estimates included vaccination coverage and exemption data for children enrolled in public online homeschools. Pennsylvania included homeschooled students in their public school data. Vermont includes homeschooled students in their public and private school data if they are enrolled in one or more classes in those schools; homeschooled children who are exclusively homeschooled are not subject to vaccination requirements and are not included in these estimates.
††† Texas was unable to report the number of children with at least one medical exemption, so their data were excluded from the medical exemption and any exemption data (Table 2).
§§§ Healthy People 2020 objective IID-10.1 is based on 4 doses of DTaP vaccine. This report describes compliance with state regulations of 3, 4, or 5 doses of DTaP vaccine. Of the 50 states and DC, only Nebraska required and reported 3 doses of DTaP vaccine. IID-10.2 sets a target of ≥95% of kindergartners receiving ≥2 doses of MMR vaccine. Four states required 2 doses of measles-containing vaccine, but only 1 dose each of mumps and rubella vaccine. One state required 2 doses measles and mumps, but only 1 dose of rubella vaccine. One state required only 1 dose of MMR vaccine until age 7 years. IID-10.5 sets a target of ≥95% of kindergartners receiving ≥2 doses of varicella vaccine. State-level data with Healthy People 2020 targets are available at http://www.cdc.gov/vaccines/imz-managers/coverage/SchoolVaxView/pubs-resources.html.
¶¶¶ Among the 50 states and DC, all but New York State required 2 doses of a measles-containing vaccine, with MMR as the only measles-containing vaccine available in the United States. For local requirements for DTaP vaccine, one (Nebraska) required 3 doses, one (Virginia) required 4 doses, one (Pennsylvania) did not require pertussis, and all others required 5 doses unless the fourth dose was administered on or after the fourth birthday. For varicella vaccine, 10 areas required 1 dose, 40 required 2 doses, and one (Montana) did not require varicella vaccination.
**** States reporting estimates based on receiving all doses of all vaccines required for school entry might have actual vaccine-specific coverage estimates higher than the coverage for all required vaccines.
†††† CDC standards include use of a census or random sample of public and private schools or students, assessment using number of doses recommended by the Advisory Committee on Immunization Practices, assessment of vaccination status before December 31, collection of data by health department personnel or school nurses, validation if data are collected by school administrative staff, and documentation of vaccination from a health care provider.
§§§§ New York State reports coverage with ≥1 dose of MMR vaccine.
¶¶¶¶ Information available at http://www.cdc.gov/vaccines/imz-managers/SchoolVaxView/pubs-resources.html.
Summary
What is already known on this topic?
Annual school vaccination assessments help immunization programs protect school children from vaccine-preventable diseases by monitoring vaccination coverage based on state vaccination requirements. Although overall vaccination coverage is high and exemptions are low, undervaccination clusters geographically.
What is added by this report?
In 49 reporting states and the District of Columbia (DC), median vaccination coverage was 94.0% for measles, mumps, and rubella (MMR) vaccine and 94.2% for local requirements for diphtheria, tetanus, and acellular pertussis vaccine. Among the 39 states and DC with a 2-dose varicella vaccine requirement, varicella coverage was 93.6%. Seven areas had <90% coverage with 2 MMR doses. Median exemption levels are low overall (1.7%) but vary by state.
What are the implications for public health practice?
Monitoring and use of local data are essential to control the spread of vaccine-preventable diseases. Accurate and reliable school vaccination assessments, conducted using appropriate methods (including a census of all vaccination exemptions) can provide school and health departments with data to identify areas of undervaccination, even at a school or classroom level where the potential for disease transmission is higher, and identify areas to focus public health interventions to improve school vaccination coverage.
|
TABLE 1. (Continued) Estimated vaccination coverage* by state/area, vaccine, and survey methodology among children enrolled in kindergarten — United States, 2014–15 school year |
|||||||
|---|---|---|---|---|---|---|---|
|
Survey methodology and state/area |
Kindergarten population† |
Total surveyed |
Proportion surveyed (%) |
Type of survey conducted§ |
MMR¶ 2 doses (%) |
DTaP** 5 doses (%) |
Varicella 2 doses (%) |
|
Sample |
|||||||
|
Alaska¶¶¶ |
10,129 |
795 |
7.8 |
Stratified two-stage cluster sample |
92.7 |
92.7 |
91.6 |
|
Colorado |
70,597 |
350 |
0.5 |
Simple random sample |
86.9 |
84.3 |
85.4 |
|
Delaware |
11,476 |
901 |
7.9 |
Stratified two-stage cluster sample |
97.8 |
97.7 |
97.7 |
|
Hawaii |
20,085 |
1,121 |
5.6 |
Stratified two-stage cluster sample |
NA |
NA |
NReq |
|
Kansas§§¶¶¶ |
39,685 |
9,739 |
24.5 |
Stratified two-stage cluster sample |
89.2 |
89.6 |
88.9 |
|
Nevada |
36,755 |
1,017 |
2.8 |
Stratified two-stage cluster sample |
94.0 |
93.2 |
92.9 |
|
New Mexico¶¶¶ |
29,918 |
987 |
3.3 |
Stratified two-stage cluster sample |
97.7 |
96.4 |
97.2 |
|
South Carolina |
62,864 |
7,640 |
12.2 |
Stratified one-stage cluster sample |
96.5 |
97.2 |
95.4 |
|
Virginia |
103,821 |
4,218 |
4.1 |
Stratified two-stage cluster sample |
93.4 |
97.4 |
90.4 |
|
Wisconsin§§ |
69,335 |
1,718 |
2.5 |
Stratified two-stage cluster sample |
91.6 |
96.5 |
90.9 |
|
Median**** |
94.0 |
94.2 |
93.6 |
||||
|
Other areas |
|||||||
|
Houston, Texas††† |
45,191 |
1,734 |
3.8 |
Stratified two-stage cluster sample, nonrandom schools selection |
95.3 |
95.1 |
95.0 |
|
New York City†† |
106,922 |
106,922 |
100.0 |
Census |
98.9 |
98.3 |
97.2 |
|
Guam |
2,712 |
2,630 |
97.0 |
Census |
89.2 |
92.5 |
NReq |
|
N. Mariana Islands†† |
840 |
840 |
100.0 |
Census |
94.8 |
96.0 |
94.0 |
|
Puerto Rico |
38,151 |
1,198 |
3.1 |
Stratified two-stage cluster sample |
97.2 |
91.9 |
95.8 |
|
U.S. Virgin Islands |
1,466 |
437 |
29.8 |
Stratified two-stage cluster sample |
89.3 |
86.6 |
89.2 |
|
Abbreviations: MMR = measles, mumps, and rubella vaccine; DTaP/DT = diphtheria, tetanus, and acellular pertussis vaccine/diphtheria and tetanus vaccine; NA = not available; NReq = not required for school entry. * Estimates are adjusted for nonresponse and weighted for sampling where appropriate. Percentages for Houston are approximations. Estimates based on a completed vaccine series (i.e., not antigen-specific) are designated by use of the ≥ symbol. Coverage may include history of disease and laboratory evidence of immunity. † The kindergarten population is an approximation provided by each state/area. § Sample designs varied by state/area: census = all schools (public and private) and all children within schools were included in the assessment; simple random = a simple random sample design was used; one-stage or two-stage cluster sample = schools were randomly selected, and all children in the selected schools were assessed (one-stage) or a random sample of children within the schools were selected (two-stage); voluntary response = a census with a student response rate of <90% and does not imply that participation was optional. ¶ Most states require 2 doses of MMR vaccine; Alaska, California, and Oregon require 2 doses of measles, 1 dose of mumps, and 1 dose of rubella vaccine. Pennsylvania requires 2 doses of measles and mumps, and 1 dose of rubella vaccine. New York requires 2 doses of measles and mumps vaccine and 1 dose of rubella vaccine by age 7 years but reports ≥1 dose of MMR. ** Pertussis vaccination coverage might include some DTP (diphtheria, tetanus, and pertussis vaccine) vaccinations if administered in another country or vaccination provider continued to use after 2000. Most states require 5 doses of DTaP vaccine for school entry; Virginia requires 4 doses; Nebraska requires 3 doses. Pennsylvania requires 4 doses of diphtheria and tetanus vaccine, but pertussis vaccine is not required. Kentucky requires ≥5 but reports ≥4 doses of DTaP. †† The proportion surveyed is probably <100% but is shown as 100% based on incomplete information about the actual current enrollment. §§ Counts some or all vaccine doses received regardless of Advisory Committee on Immunization Practices recommended age and time interval; vaccination coverage rates shown might be higher than those for valid doses. ¶¶ Does not include non–district-specific, virtual, and college laboratory schools, or private schools with fewer than 10 students. *** Pertussis vaccine is not required in Pennsylvania. Coverage for diphtheria and tetanus was 93.9%. ††† Texas collected and reported data from a self-report census of all schools and students in the state, including Houston. However, the estimates reported separately in this table for Houston are not from the Texas census. Houston collected data from a nonrandom sample of schools as part of a different assessment directed by the Texas Department of State Health Services, and reported these results separately to CDC. §§§ Collected public school data only. ¶¶¶ Kindergarten coverage data were collected from a sample, and exemption data were collected from a census of kindergartners. **** The median is the center of the estimates in the distribution. The median does not include Hawaii, Houston, New York City, Guam, the Commonwealth of the Northern Mariana Islands, Puerto Rico, and the U.S. Virgin Islands. Hawaii reported the number of children compliant with school vaccination requirements, either by being vaccinated or by having an exemption. |
|||||||
|
TABLE 2. (Continued) Estimated number and percentage* of children enrolled in kindergarten with a reported exemption to vaccination, by state/area, survey methodology and type of exemption — United States, 2014-15 school year |
||||||||||
|---|---|---|---|---|---|---|---|---|---|---|
|
Survey methodology and state/area |
Medical exemptions† |
Nonmedical exemptions† |
Any exemption† |
% point difference |
||||||
|
No. |
% |
No. of religious exemptions |
No. of philosophic exemptions |
Total |
% |
Total no. |
2014–15 (%) |
2013–14 (%) |
||
|
Sample§ |
||||||||||
|
Colorado |
0 |
<0.1 |
202 |
3,631 |
3,832 |
5.4 |
3,832 |
5.4 |
4.6 |
0.8 |
|
Delaware |
46 |
0.4 |
106 |
** |
106 |
0.9 |
152 |
1.3 |
0.8 |
0.5 |
|
Hawaii |
0 |
<0.1 |
754 |
** |
754 |
3.3 |
754 |
3.3 |
3.2 |
0.1 |
|
Nevada |
92 |
0.3 |
401 |
** |
401 |
1.1 |
493 |
1.3 |
2.0 |
-0.7 |
|
South Carolina¶ |
74 |
0.1 |
648 |
** |
648 |
1.0 |
722 |
1.2 |
1.4 |
-0.2 |
|
Virginia¶ |
305 |
0.3 |
891 |
** |
891 |
0.8 |
1,195 |
1.1 |
0.6 |
0.5 |
|
Wisconsin |
301 |
0.4 |
49 |
3,319 |
3,368 |
4.9 |
3,669 |
5.3 |
4.9 |
0.4 |
|
Median¶¶¶ |
0.2 |
1.5 |
1.7 |
1.8 |
-0.1 |
|||||
|
Other areas |
||||||||||
|
Houston, Texas*** |
0 |
<0.1 |
¶¶ |
¶¶ |
145 |
0.3 |
145 |
0.3 |
0.3 |
0.0 |
|
New York City |
53 |
<0.1 |
415 |
** |
415 |
0.4 |
468 |
0.4 |
NA |
NA |
|
Guam |
0 |
0.0 |
3 |
** |
3 |
0.1 |
3 |
0.1 |
<0.1 |
0.0 |
|
N. Mariana Islands |
0 |
0.0 |
0 |
0 |
0 |
0.0 |
0 |
0.0 |
0.0 |
0.0 |
|
Puerto Rico |
21 |
0.1 |
53 |
** |
53 |
0.1 |
73 |
0.2 |
0.0 |
0.2 |
|
U.S. Virgin Islands |
0 |
<0.1 |
25 |
** |
25 |
1.7 |
25 |
1.7 |
1.1 |
0.6 |
|
Abbreviation: NA = not available (i.e., not collected or reported to CDC). * Estimates are adjusted for nonresponse and weighted for sampling where appropriate. Percentages for Houston are approximations. † Medical and nonmedical exemptions might not be mutually exclusive. Some children might have both medical and nonmedical exemptions. Temporary exemptions are included in the "any exemptions" totals for Alabama, Mississippi, New Jersey, North Carolina, North Dakota, South Carolina, South Dakota, Utah, Virginia, and Washington. § Sample designs varied by state/area: census = all schools (public and private) and all children within schools were included in the assessment; voluntary response = a census with a student response rate of <90% and does not imply that participation was optional; sample includes simple random and one-stage or two-stage cluster sample. ¶ Includes both temporary and permanent medical exemptions. ** Exemptions because of philosophic reasons are not allowed. †† Exemptions because of religious reasons are not allowed. §§ State did not report the number of children with exemptions, but instead reported the number of exemptions for each vaccine, which would count some children more than once. Lower bounds of the percentage of children with any exemptions, estimated using the individual vaccines with the highest number of exemptions are, for Illinois, 0.3% with medical exemptions, 1.1% with religious exemptions, and 1.4% for any exemptions; for Minnesota, 0.2% with medical exemptions, 2.8% with nonmedical exemptions, and 3.0% for any exemptions; for Missouri 0.2% with medical exemptions, 1.8% with religious exemptions, and 2.0% for any exemptions; for Texas, 0.1% with medical exemptions, and 1.4% for any exemptions; and for Wyoming, 0.3% with medical exemptions, 2.2% with religious exemptions, and 2.5% for any exemptions. ¶¶ Religious and philosophic exemptions are not reported separately. *** Texas collected and reported data from a self-report census of all schools and students in the state, including Houston. However, the estimates reported separately in this table for Houston are not from the Texas census. Houston collected data from a nonrandom sample of schools as part of a different assessment directed by the Texas Department of State Health Services, and reported these results separately to CDC. ¶¶¶ The median is the center of the estimates in the distribution. The medians do not include Illinois, Minnesota, Missouri, Wyoming, Houston, New York City, Guam, the Commonwealth of the Northern Mariana Islands, Puerto Rico, and the U.S. Virgin Islands. Texas is not included in the medians for medical exemptions or any exemptions. |
||||||||||
FIGURE. Estimated percentage of children enrolled in kindergarten who have been exempted from receiving one or more vaccines,* by state† — United States, 2014–15 school year
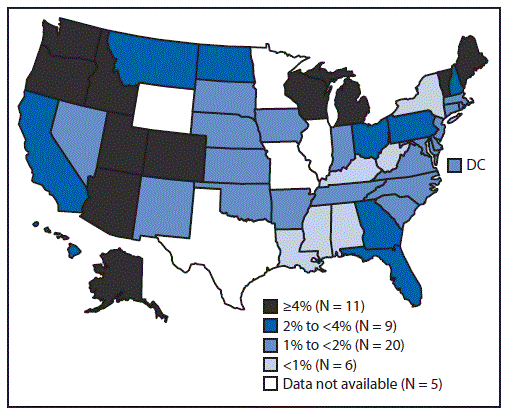
* Exemptions might not reflect a child's vaccination status. Children with an exemption who did not receive any vaccines are indistinguishable from those who have an exemption but are up-to-date for one or more vaccines.
† Seven states used a sample for exemption data: Colorado, Delaware, Hawaii, Nevada, South Carolina, Virginia, and Wisconsin.
Alternate Text: The figure above is a map of the United States showing the estimated percentage of children enrolled in kindergarten who have been exempted from receiving one or more vaccines, by state, in the United States during 2014-15 school year.
Use of trade names and commercial sources is for identification only and does not imply endorsement by the U.S. Department of
Health and Human Services.
References to non-CDC sites on the Internet are
provided as a service to MMWR readers and do not constitute or imply
endorsement of these organizations or their programs by CDC or the U.S.
Department of Health and Human Services. CDC is not responsible for the content
of pages found at these sites. URL addresses listed in MMWR were current as of
the date of publication.
All MMWR HTML versions of articles are electronic conversions from typeset documents.
This conversion might result in character translation or format errors in the HTML version.
Users are referred to the electronic PDF version (http://www.cdc.gov/mmwr)
and/or the original MMWR paper copy for printable versions of official text, figures, and tables.
An original paper copy of this issue can be obtained from the Superintendent of Documents, U.S.
Government Printing Office (GPO), Washington, DC 20402-9371;
telephone: (202) 512-1800. Contact GPO for current prices.
**Questions or messages regarding errors in formatting should be addressed to
mmwrq@cdc.gov.
