Prevalence of Smokefree Home Rules — United States, 1992–1993 and 2010–2011
, PhD1, , MPH1, , MPH1 (Author affiliations at end of text)
Exposure to secondhand smoke (SHS) from cigarettes causes an estimated 41,000 deaths among nonsmoking U.S. adults each year and an estimated $5.6 billion annually in lost productivity caused by premature death (1,2). In a 2006 report, the Surgeon General concluded that there is no risk-free level of exposure to SHS (1). Although an increasing proportion of the population is covered by state or local comprehensive smokefree laws that prohibit tobacco smoking in all indoor public places and worksites, including restaurants and bars (3,4), millions of nonsmokers continue to be exposed to SHS in areas not covered by smokefree laws or policies, including homes (5). The home is the primary source of SHS exposure for children and a major source of exposure for nonsmoking adults (1). To assess progress toward increasing the proportion of households with smokefree home rules, CDC analyzed the most recent data from the Tobacco Use Supplement to the Current Population Survey. Households were considered to have a smokefree home rule if all adult respondents aged ≥18 years in the household reported that no one was allowed to smoke anywhere inside the home at any time. The analysis found that the national prevalence of smokefree home rules increased from 43.0% during 1992–1993 to 83.0% during 2010–2011. Over the same period, the national prevalence of smokefree home rules increased from 56.7% to 91.4% among households with no adult cigarette smokers and from 9.6% to 46.1% among households with at least one adult smoker. Enhanced implementation of evidence-based interventions (e.g., comprehensive smokefree laws, voluntary smokefree home rules, smokefree multiunit housing policies, and initiatives to educate the public about the health effects of SHS) is warranted to further reduce SHS exposure in the United States (1,2).
The Current Population Survey is a household survey administered to the civilian, noninstitutionalized population by the U.S. Census Bureau.* Since 1992–1993, the Tobacco Use Supplement to the Current Population Survey (TUS-CPS) has collected national and state data regarding tobacco use and tobacco-related attitudes and policies, including home smoking rules. The TUS-CPS was conducted during 1992–1993 (293,543 respondents), 1995–1996 (247,088), 1998–1999 (239,652), 2000 (167,096), 2001–2002 (249,288), 2003 (249,620), 2006–2007 (237,119), and 2010–2011 (229,456). Eligible household members were interviewed by telephone or in their homes; the sample included persons aged ≥15 years until 2003, and those aged ≥18 years during 2006–2007 and 2010–2011. Response rates ranged from 62% (2006–2007 and 2010–2011) to 72% (1992–1993).†
Each household member aged ≥18 years was asked, "Which statement best describes the rules about smoking inside your home?" The response options were, "No one is allowed to smoke anywhere inside your home," "Smoking is allowed in some places or at some times inside your home," and "Smoking is permitted anywhere inside your home." Households were considered to have a smokefree home rule if all adult respondents aged ≥18 years in the household reported that no one was allowed to smoke anywhere inside the home at any time. Households were considered to have one or more smokers if at least one respondent aged ≥18 years had smoked ≥100 cigarettes in their lifetime and now smoked "everyday" or "some days." Data were adjusted for nonresponse and weighted using the household supplement self-response weight. To ensure comparability across surveys, analyses were restricted to respondents aged ≥18 years. Households with discrepancies in responses (i.e., one respondent reported a smokefree home rule, and another did not) were excluded (range = 1.8% during 2010–2011 to 6.9% during 1992–1993). Point estimates and 95% confidence intervals were used to describe the prevalence of smokefree home rules overall and by state. Differences between groups were assessed using chi-square tests, and logistic regression was used to assess temporal trends (Wald test; p<0.05).
The national prevalence of smokefree home rules increased from 43.0% during 1992–1993 to 83.0% during 2010–2011 (p<0.05) (Table). Prevalence ranged from 25.6% in Kentucky to 69.4% in Utah during 1992–1993, and from 69.4% in Kentucky to 93.6% in Utah during 2010–2011 (Figure).
Among households with no adult smokers, the national prevalence of smokefree home rules increased from 56.7% during 1992–1993 to 91.4% during 2010–2011 (p<0.05). Prevalence ranged from 39.2% in Kentucky to 82.8% in Utah during 1992–1993, and from 82.9% in West Virginia to 97.3% in Utah during 2010–2011.
Among households with at least one adult smoker, the national prevalence of smokefree home rules increased from 9.6% during 1992–1993 to 46.1% during 2010–2011 (p<0.05). Prevalence ranged from 3.6% in Kentucky to 20.9% in Utah during 1992–1993, and from 27.2% in West Virginia to 68.4% in Utah during 2010–2011.
Discussion
The prevalence of smokefree home rules among U.S. households increased considerably over the past 2 decades, from 43.0% during 1992–1993 to 83.0% during 2010–2011. Making homes completely smokefree reduces SHS exposure among nonsmokers, particularly children, and can help adult smokers quit (1). Despite these benefits, millions of nonsmokers in the United States remain unprotected by smokefree home rules. To continue to increase the percentage of U.S. households that are smokefree, efforts are warranted to educate the public about the dangers of SHS exposure and to encourage adoption of smokefree home rules, particularly among persons living in states with lower prevalence of these rules. Additionally, efforts to implement smokefree policies in multiunit housing, where residents who have instituted smokefree home rules can still be exposed to SHS that enters their units from other units and shared areas where smoking occurs (6), would further protect nonsmokers from SHS exposure in their homes.
The increased prevalence of smokefree home rules observed nationally and across all states might be attributable to multiple factors, including the spread of state and local comprehensive smokefree laws covering public places and worksites, and declines in cigarette smoking prevalence (1,2). Additionally, the substantial increases in the prevalence of smokefree rules in households with at least one smoker and in households in states with high cigarette smoking rates might reflect changes in public attitudes about the social acceptability of smoking around nonsmokers (1,2). Comprehensive smokefree laws can stimulate the adoption of voluntary smokefree home rules and increase support for smokefree environments among both nonsmokers and smokers (1,7). As of April 2014, 26 states, the District of Columbia, and approximately 600 local municipalities had implemented comprehensive smokefree laws (3,4); almost half (49.2%) of U.S. residents are currently covered by comprehensive smokefree laws at the state or local level.§ Despite this progress, during 2007–2008, approximately 88 million U.S. residents aged ≥3 years were exposed to SHS, and disparities in exposure exist across subpopulations (5).
The findings in this report are subject to at least five limitations. First, smokefree rules were self-reported and not validated by an objective measure. However, parental reporting of smokefree home rules strongly correlates with child cotinine levels, suggesting that self-reports of smokefree home rules are accurate (8). Second, because the 2006–2007 and 2010–2011 TUS-CPS cycles were only administered to respondents aged ≥18 years, respondents aged 15–17 years who completed the 1992–1993 through 2003 TUS-CPS were excluded. However, excluding these persons did not have a significant impact on the findings; for example, during 1992–1993, national prevalence of smokefree home rules among respondents aged ≥18 years was 43.0%, compared with 43.2% among those aged ≥15 years. Third, members of households with discrepant reports of smokefree home rules were excluded; however, the percentage of excluded respondents was small and declined over time. Fourth, the study only assessed the presence of cigarette smokers in the home and might not have captured adults who smoked other tobacco products such as cigars. Finally, response rates for TUS-CPS have declined over time (from 72% during 1992–1993 to 62% during 2010–2011). Lower response rates can increase bias; however, the data were adjusted for nonresponse, and the estimates were comparable to other studies (9).
Although substantial progress has been made in increasing the prevalence of smokefree home rules, fewer than half of households with smokers have adopted such rules. This is concerning because nearly all nonsmokers who live with someone who smokes inside the home are exposed to SHS (5). Because 100% smokefree indoor environments are the only effective way to fully eliminate SHS exposure (1), efforts are warranted to educate the public about the dangers of SHS and to promote the adoption of smokefree home rules, particularly among subpopulations at greatest risk for exposure, such as those living in households with smokers, in states with lower prevalence of smokefree home rules, and in multiunit housing (1,2,5,10). Continued adoption of smokefree home rules, in concert with intensified implementation of comprehensive smokefree laws in indoor public places and worksites, can reduce nonsmokers' exposure to this preventable health hazard (1,2,5).
1Office on Smoking and Health, National Center for Chronic Disease Prevention and Health Promotion, CDC (Corresponding author: Brian A. King, baking@cdc.gov, 770-488-5107)
References
- US Department of Health and Human Services. The health consequences of involuntary exposure to tobacco smoke: a report of the Surgeon General. Atlanta, GA: US Department of Health and Human Services, CDC; 2006. Available at http://www.surgeongeneral.gov/library/secondhandsmoke/report/fullreport.pdf.
- US Department of Health and Human Services. The health consequences of smoking—50 years of progress: a report of the Surgeon General. Atlanta, GA: US Department of Health and Human Services, CDC; 2014. Available at http://www.surgeongeneral.gov/library/reports/50-years-of-progress.
- CDC. State Activities Tracking and Evaluation (STATE) System. Atlanta, GA: US Department of Health and Human Services, CDC; 2014. Available at http://apps.nccd.cdc.gov/statesystem/default/default.aspx.
- American Nonsmokers' Rights Foundation. Chronological table of U.S. population protected by 100% smokefree state or local laws. Available at http://www.no-smoke.org/pdf/EffectivePopulationList.pdf.
- CDC. Vital signs: nonsmokers' exposure to secondhand smoke—United States, 1999–2008. MMWR 2010;59:1141–6.
- King BA, Travers MJ, Cummings KM, Mahoney MC, Hyland AJ. Secondhand smoke transfer in multiunit housing. Nicotine Tob Res 2010;12:1133–41.
- Cheng KW, Okechukwu CA, McMillen R, Glantz SA. Association between clean indoor air laws and voluntary smokefree rules in homes and cars. Tob Control 2013. Epub ahead of print.
- Spencer N, Blackburn C, Bonas S, Coe C, Dolan A. Parent reported home smoking bans and toddler (18–30 month) smoke exposure: a cross-sectional survey. Arch Dis Child 2005;90:670–4.
- King BA, Dube SR, Homa DM. Smokefree rules and secondhand smoke exposure in homes and vehicles among US adults, 2009–2010. Prev Chronic Dis 2013;10:E79.
- King BA, Babb SD, Tynan MA, Gerzoff RB. National and state estimates of secondhand smoke infiltration among U.S. multiunit housing residents. Nicotine Tob Res 2013;15:1316–21.
* Additional information available at http://www.census.gov/prod/2000pubs/tp63.pdf.
† Additional information available at http://riskfactor.cancer.gov/studies/tus-cps/info.html.
§ Additional information available at http://www.no-smoke.org/pdf/SummaryUSPopList.pdf.
What is already known on this topic?
The U.S. Surgeon General has concluded that there is no risk-free level of exposure to secondhand smoke. Although an increasing proportion of the population is protected by state or local comprehensive smokefree laws that prohibit smoking in all indoor areas of public places and worksites, millions of nonsmokers remain susceptible to secondhand smoke exposure in areas not covered by smokefree laws or policies, including homes.
What is added by this report?
The national prevalence of smokefree home rules increased significantly over the past 2 decades, from 43.0% during 1992–1993 to 83.0% during 2010–2011. During this period, the national prevalence of such rules increased from 56.7% to 91.4% among households with no adult smoker, and from 9.6% to 46.1% among households with at least one smoker.
What are the implications for public health practice?
Although the percentage of households with smokefree home rules has increased considerably since 1992–1993, by 2010–2011 fewer than half of households with a smoker had adopted such rules.
FIGURE. Percentage of households with a smokefree home rule,* by state — Tobacco Use Supplement to the Current Population Survey, 1992–1993 and 2010–2011
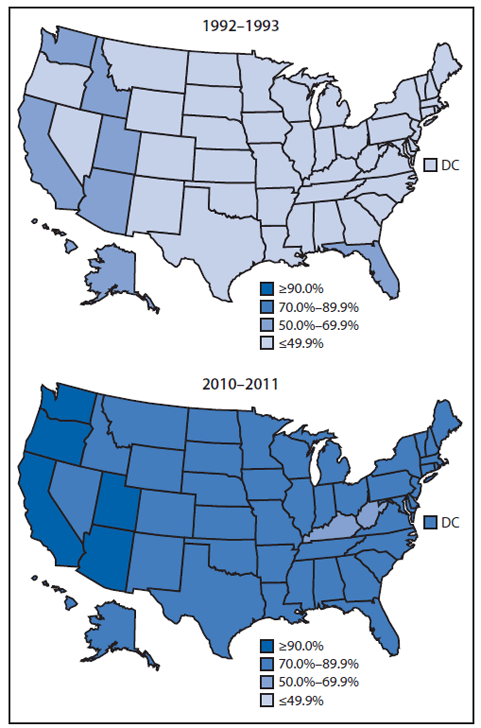
* Households were considered to have a smokefree home rule if all adult respondents aged ≥18 years in the household reported that no one was allowed to smoke anywhere inside the home at any time.
Alternate Text: The figure above shows two U.S. maps illustrating the percentage of households with a smokefree home rule, by state, during 1992-1993 and 2010-2011. Prevalence ranged from 25.6% in Kentucky to 69.4% in Utah during 1992-1993, and from 69.4% in Kentucky to 93.6% in Utah during 2010-2011.
Use of trade names and commercial sources is for identification only and does not imply endorsement by the U.S. Department of
Health and Human Services.
References to non-CDC sites on the Internet are
provided as a service to MMWR readers and do not constitute or imply
endorsement of these organizations or their programs by CDC or the U.S.
Department of Health and Human Services. CDC is not responsible for the content
of pages found at these sites. URL addresses listed in MMWR were current as of
the date of publication.
All MMWR HTML versions of articles are electronic conversions from typeset documents.
This conversion might result in character translation or format errors in the HTML version.
Users are referred to the electronic PDF version (http://www.cdc.gov/mmwr)
and/or the original MMWR paper copy for printable versions of official text, figures, and tables.
An original paper copy of this issue can be obtained from the Superintendent of Documents, U.S.
Government Printing Office (GPO), Washington, DC 20402-9371;
telephone: (202) 512-1800. Contact GPO for current prices.
**Questions or messages regarding errors in formatting should be addressed to
mmwrq@cdc.gov.
