|
TABLE I. Provisional cases of infrequently reported notifiable diseases (<1,000 cases reported during the preceding year) — United States, week ending May 24, 2014 (21st week)* (Export data) |
|||||||||
|
Disease |
Current week |
Cum 2014 |
5-year weekly average† |
Total cases reported for previous years |
States reporting cases during current week (No.) |
||||
|
2013 |
2012 |
2011 |
2010 |
2009 |
|||||
|
Anthrax |
— |
— |
— |
— |
— |
1 |
— |
1 |
|
|
Arboviral diseases§,¶: |
|||||||||
|
California serogroup virus disease |
— |
— |
0 |
85 |
81 |
137 |
75 |
55 |
|
|
Eastern equine encephalitis virus disease |
— |
— |
— |
7 |
15 |
4 |
10 |
4 |
|
|
Powassan virus disease |
— |
— |
1 |
15 |
7 |
16 |
8 |
6 |
|
|
St. Louis encephalitis virus disease |
— |
— |
0 |
1 |
3 |
6 |
10 |
12 |
|
|
Western equine encephalitis virus disease |
— |
— |
— |
— |
— |
— |
— |
— |
|
|
Botulism, total |
1 |
39 |
3 |
151 |
168 |
153 |
112 |
118 |
|
|
foodborne |
— |
— |
0 |
4 |
27 |
24 |
7 |
10 |
|
|
infant |
1 |
31 |
2 |
135 |
123 |
97 |
80 |
83 |
WA (1) |
|
other (wound and unspecified) |
— |
8 |
0 |
12 |
18 |
32 |
25 |
25 |
|
|
Brucellosis |
1 |
16 |
3 |
102 |
114 |
79 |
115 |
115 |
TX (1) |
|
Chancroid |
— |
7 |
0 |
10 |
15 |
8 |
24 |
28 |
|
|
Cholera |
— |
— |
0 |
4 |
17 |
40 |
13 |
10 |
|
|
Cyclosporiasis§ |
— |
22 |
3 |
786 |
123 |
151 |
179 |
141 |
|
|
Diphtheria |
— |
1 |
— |
— |
1 |
— |
— |
— |
|
|
Haemophilus influenzae,** invasive disease (age <5 yrs): |
|||||||||
|
serotype b |
— |
12 |
0 |
31 |
30 |
14 |
23 |
35 |
|
|
nonserotype b |
— |
68 |
4 |
222 |
205 |
145 |
200 |
236 |
|
|
unknown serotype |
3 |
116 |
4 |
185 |
210 |
226 |
223 |
178 |
FL (2), OK (1) |
|
Hansen disease§ |
— |
17 |
2 |
81 |
82 |
82 |
98 |
103 |
|
|
Hantavirus pulmonary syndrome§ |
1 |
4 |
1 |
16 |
30 |
23 |
20 |
20 |
OK (1) |
|
Hemolytic uremic syndrome, postdiarrheal§ |
1 |
33 |
5 |
326 |
274 |
290 |
266 |
242 |
MO (1) |
|
Hepatitis B, virus infection perinatal |
— |
16 |
1 |
45 |
40 |
U |
U |
U |
|
|
Influenza-associated pediatric mortality§,†† |
1 |
87 |
2 |
164 |
52 |
118 |
61 |
358 |
NJ (1) |
|
Leptospirosis |
— |
4 |
0 |
NN |
NN |
NN |
NN |
NN |
|
|
Listeriosis |
10 |
168 |
13 |
731 |
727 |
870 |
821 |
851 |
NY (2), PA (2), OH (2), MD (1), MS (1), ID (1), WA (1) |
|
Measles§§ |
87 |
307 |
6 |
185 |
55 |
220 |
63 |
71 |
OH (72), WA (14), CA (1) |
|
Meningococcal disease, invasive¶¶: |
|||||||||
|
A, C, Y, and W-135 |
— |
46 |
5 |
142 |
161 |
257 |
280 |
301 |
|
|
serogroup B |
— |
28 |
3 |
98 |
110 |
159 |
135 |
174 |
|
|
other serogroup |
— |
5 |
0 |
18 |
20 |
20 |
12 |
23 |
|
|
unknown serogroup |
1 |
123 |
6 |
301 |
260 |
323 |
406 |
482 |
MD (1) |
|
Novel influenza A virus infections*** |
— |
— |
415 |
21 |
313 |
14 |
4 |
43,774 |
|
|
Plague |
— |
1 |
0 |
4 |
4 |
3 |
2 |
8 |
|
|
Poliomyelitis, paralytic |
— |
— |
— |
1 |
— |
— |
— |
1 |
|
|
Polio virus Infection, nonparalytic§ |
— |
— |
— |
— |
— |
— |
— |
— |
|
|
Psittacosis§ |
— |
— |
0 |
6 |
2 |
2 |
4 |
9 |
|
|
Q fever, total§ |
1 |
42 |
3 |
154 |
135 |
134 |
131 |
113 |
|
|
acute |
1 |
31 |
2 |
121 |
113 |
110 |
106 |
93 |
FL (1) |
|
chronic |
— |
11 |
0 |
33 |
22 |
24 |
25 |
20 |
|
|
Rabies, human |
— |
— |
0 |
— |
1 |
6 |
2 |
4 |
|
|
Rubella††† |
— |
2 |
0 |
10 |
9 |
4 |
5 |
3 |
|
|
Rubella, congenital syndrome |
— |
— |
0 |
1 |
3 |
— |
— |
2 |
|
|
SARS-CoV§ |
— |
— |
— |
— |
— |
— |
— |
— |
|
|
Smallpox§ |
— |
— |
— |
— |
— |
— |
— |
— |
|
|
Streptococcal toxic-shock syndrome§ |
1 |
67 |
4 |
223 |
194 |
168 |
142 |
161 |
ME (1) |
|
Syphilis, congenital (age <1 yr)§§§ |
— |
68 |
6 |
341 |
322 |
360 |
377 |
423 |
|
|
Tetanus |
— |
6 |
0 |
25 |
37 |
36 |
26 |
18 |
|
|
Toxic-shock syndrome (staphylococcal)§ |
— |
18 |
2 |
72 |
65 |
78 |
82 |
74 |
|
|
Trichinellosis |
— |
2 |
0 |
20 |
18 |
15 |
7 |
13 |
|
|
Tularemia |
2 |
11 |
5 |
202 |
149 |
166 |
124 |
93 |
MO (1), OK (1) |
|
Typhoid fever |
2 |
105 |
7 |
339 |
354 |
390 |
467 |
397 |
OH (1), OK (1) |
|
Vancomycin-intermediate Staphylococcus aureus§ |
3 |
76 |
2 |
244 |
134 |
82 |
91 |
78 |
NY (1), MO (2) |
|
Vancomycin-resistant Staphylococcus aureus§ |
— |
— |
— |
— |
2 |
— |
2 |
1 |
|
|
Vibriosis (noncholera Vibrio species infections)§ |
8 |
138 |
14 |
1,199 |
1,111 |
832 |
846 |
789 |
NY (1), NC (1), SC (1), FL (3), TX (1), OR (1) |
|
Viral hemorrhagic fever¶¶¶ |
— |
— |
— |
— |
— |
— |
1 |
NN |
|
|
Yellow fever |
— |
— |
— |
— |
— |
— |
— |
— |
|
|
See Table 1 footnotes on next page. |
|||||||||
Notifiable Diseases and Mortality Tables
Table I Summary of provisional cases of selected notifiable diseases, United States, cumulative, week ending May 24, 2014 (21st Week)
Figure I Selected notifiable disease reports, United States, comparison of provisional 4-week totals ending May 24, 2014, with historical data
Table II Provisional cases of selected notifiable diseases, United States, weeks ending May 24, 2014 and May 25, 2013 (21st Week)
Table III Deaths in 122 U.S. cities, week ending May 24, 2014 (21st Week)
|
TABLE I. (Continued) Provisional cases of infrequently reported notifiable diseases (<1,000 cases reported during the preceding year) — United States, week ending May 24, 2014 (21st week)* |
|---|
|
—: No reported cases. N: Not reportable. NN: Not Nationally Notifiable. Cum: Cumulative year-to-date counts. * Case counts for reporting years 2013 and 2014 are provisional and subject to change. For further information on interpretation of these data, see http://wwwn.cdc.gov/nndss/document/ProvisionalNationaNotifiableDiseasesSurveillanceData20100927.pdf. † Calculated by summing the incidence counts for the current week, the 2 weeks preceding the current week, and the 2 weeks following the current week, for a total of 5 preceding years. Additional information is available at http://wwwn.cdc.gov/nndss/document/5yearweeklyaverage.pdf. § Not reportable in all states. Data from states where the condition is not reportable are excluded from this table except starting in 2007 for the arboviral diseases, STD data, TB data, and influenza-associated pediatric mortality, and in 2003 for SARS-CoV. Reporting exceptions are available at http://wwwn.cdc.gov/nndss/document/SRCA_FINAL_REPORT_2006-2012_final.xlsx. ¶ Includes both neuroinvasive and nonneuroinvasive. Updated weekly from reports to the Division of Vector-Borne Infectious Diseases, National Center for Zoonotic, Vector-Borne, and Enteric Diseases (ArboNET Surveillance). Data for West Nile virus are available in Table II. ** Data for H. influenzae (all ages, all serotypes) are available in Table II. †† Updated weekly from reports to the Influenza Division, National Center for Immunization and Respiratory Diseases. Since September 29, 2013, 96 influenza-associated pediatric deaths occurring during the 2013-14 influenza season have been reported. §§ Of the 87 measles cases reported for the current week, 16 were indigenous and 71 were imported. ¶¶ Data for meningococcal disease (all serogroups) are available in Table II. *** CDC discontinued reporting of individual confirmed and probable cases of influenza A (H1N1)pdm09 virus infections on July 24, 2009. During 2009, four cases of human infection with novel influenza A viruses, different from the influenza A (H1N1)pdm09 virus, were reported to CDC. The four cases of novel influenza A virus infection reported to CDC during 2010, the fourteen cases reported during 2011, the 313 cases reported in 2012, and the 21 cases reported during 2013 are different from the influenza A (H1N1)pdm09 virus. Total case counts are provided by the Influenza Division, National Center for Immunization and Respiratory Diseases (NCIRD). ††† No rubella cases were reported for the current week. §§§ Updated weekly from reports to the Division of STD Prevention, National Center for HIV/AIDS, Viral Hepatitis, STD, and TB Prevention. ¶¶¶ There were no cases of viral hemorrhagic fever reported during the current week. See Table II for dengue hemorrhagic fever. |
FIGURE I. Selected notifiable disease reports, United States, comparison of provisional 4-week totals May 24, 2014, with historical data
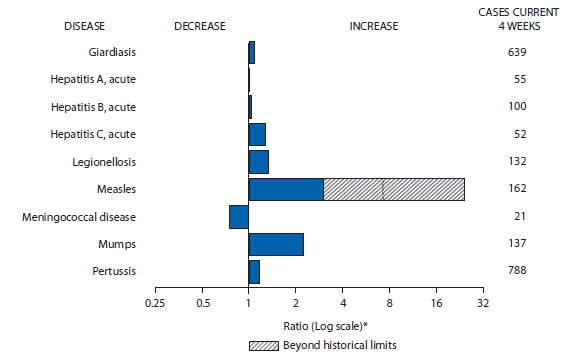
* Ratio of current 4-week total to mean of 15 4-week totals (from previous, comparable, and subsequent 4-week periods for the past 5 years). The point where the hatched area begins is based on the mean and two standard deviations of these 4-week totals.
Alternate Text: The figure above shows selected notifiable disease reports for the United States, with comparison of provisional 4-week totals through May 24, 2014, with historical data. Reports of giardiasis, acute hepatitis A, acute hepatitis B, acute hepatitis C, legionellosis, measles, mumps, and pertussis all increased, with measles increasing beyond historical limits. Reports of meningococcal disease decreased.
|
TABLE II. Provisional cases of selected notifiable diseases, United States, weeks ending May 24, 2014, and May 25, 2013 (21st week)* (Export data) |
|||||||||||||||
|---|---|---|---|---|---|---|---|---|---|---|---|---|---|---|---|
|
Reporting area |
Babesiosis |
Chlamydia trachomatis infection |
Coccidioidomycosis |
||||||||||||
|
Current week |
Previous 52 weeks |
Cum 2014 |
Cum 2013 |
Current week |
Previous 52 weeks |
Cum 2014 |
Cum 2013 |
Current week |
Previous 52 weeks |
Cum 2014 |
Cum 2013 |
||||
|
Med |
Max |
Med |
Max |
Med |
Max |
||||||||||
|
United States |
2 |
18 |
148 |
34 |
57 |
10,328 |
26,524 |
29,492 |
495,532 |
567,172 |
136 |
184 |
291 |
3,604 |
3,659 |
|
New England |
1 |
4 |
83 |
19 |
34 |
462 |
880 |
1,157 |
15,401 |
19,427 |
— |
0 |
1 |
1 |
1 |
|
Connecticut |
— |
1 |
36 |
3 |
20 |
92 |
237 |
388 |
5,021 |
5,330 |
N |
0 |
0 |
N |
N |
|
Maine |
— |
0 |
6 |
2 |
— |
— |
68 |
106 |
1,015 |
1,276 |
N |
0 |
0 |
N |
N |
|
Massachusetts |
— |
1 |
48 |
8 |
12 |
368 |
423 |
679 |
7,034 |
9,113 |
— |
0 |
0 |
— |
— |
|
New Hampshire |
— |
0 |
4 |
3 |
2 |
2 |
52 |
76 |
363 |
1,287 |
— |
0 |
1 |
1 |
1 |
|
Rhode Island |
— |
0 |
27 |
2 |
— |
— |
79 |
147 |
1,271 |
1,755 |
— |
0 |
0 |
— |
— |
|
Vermont |
1 |
0 |
2 |
1 |
— |
— |
35 |
98 |
697 |
666 |
N |
0 |
0 |
N |
N |
|
Mid. Atlantic |
1 |
8 |
57 |
13 |
14 |
1,999 |
3,390 |
3,782 |
66,671 |
71,272 |
— |
0 |
0 |
— |
— |
|
New Jersey |
— |
1 |
25 |
3 |
7 |
179 |
563 |
689 |
10,925 |
11,322 |
N |
0 |
0 |
N |
N |
|
New York (Upstate) |
1 |
3 |
52 |
7 |
7 |
842 |
720 |
1,866 |
14,462 |
14,151 |
N |
0 |
0 |
N |
N |
|
New York City |
— |
0 |
11 |
3 |
— |
270 |
1,110 |
1,283 |
22,612 |
24,404 |
N |
0 |
0 |
N |
N |
|
Pennsylvania |
N |
0 |
0 |
N |
N |
708 |
947 |
1,324 |
18,672 |
21,395 |
N |
0 |
0 |
N |
N |
|
E.N. Central |
— |
0 |
11 |
1 |
2 |
1,136 |
4,005 |
4,785 |
70,049 |
86,719 |
1 |
1 |
3 |
22 |
8 |
|
Illinois |
— |
0 |
0 |
— |
— |
57 |
1,116 |
1,441 |
15,361 |
25,489 |
N |
0 |
0 |
N |
N |
|
Indiana |
— |
0 |
1 |
— |
1 |
130 |
551 |
685 |
10,410 |
11,525 |
N |
0 |
0 |
N |
N |
|
Michigan |
— |
0 |
1 |
— |
— |
386 |
805 |
1,091 |
15,659 |
18,467 |
— |
0 |
3 |
16 |
3 |
|
Ohio |
N |
0 |
0 |
N |
N |
332 |
1,029 |
1,164 |
20,071 |
21,778 |
1 |
0 |
1 |
6 |
3 |
|
Wisconsin |
— |
0 |
11 |
1 |
1 |
231 |
448 |
549 |
8,548 |
9,460 |
— |
0 |
1 |
— |
2 |
|
W.N. Central |
— |
0 |
10 |
— |
4 |
152 |
1,596 |
1,826 |
27,858 |
32,822 |
— |
2 |
7 |
48 |
32 |
|
Iowa |
N |
0 |
0 |
N |
N |
17 |
220 |
263 |
4,225 |
4,364 |
N |
0 |
0 |
N |
N |
|
Kansas |
N |
0 |
0 |
N |
N |
18 |
217 |
282 |
3,938 |
4,340 |
N |
0 |
0 |
N |
N |
|
Minnesota |
— |
0 |
10 |
— |
4 |
— |
343 |
419 |
4,335 |
7,636 |
— |
1 |
6 |
38 |
24 |
|
Missouri |
N |
0 |
0 |
N |
N |
— |
543 |
627 |
9,873 |
10,905 |
— |
0 |
3 |
4 |
4 |
|
Nebraska |
— |
0 |
1 |
— |
— |
117 |
148 |
231 |
3,097 |
2,761 |
— |
0 |
1 |
1 |
— |
|
North Dakota |
— |
0 |
1 |
— |
— |
— |
59 |
82 |
1,160 |
1,149 |
— |
0 |
2 |
5 |
4 |
|
South Dakota |
— |
0 |
1 |
— |
— |
— |
74 |
99 |
1,230 |
1,667 |
N |
0 |
0 |
N |
N |
|
S. Atlantic |
— |
0 |
2 |
— |
3 |
3,699 |
5,407 |
6,919 |
107,901 |
115,082 |
— |
0 |
1 |
2 |
3 |
|
Delaware |
— |
0 |
1 |
— |
1 |
51 |
85 |
220 |
1,584 |
2,175 |
— |
0 |
1 |
— |
— |
|
District of Columbia |
N |
0 |
0 |
N |
N |
— |
66 |
190 |
— |
3,113 |
— |
0 |
1 |
— |
— |
|
Florida |
N |
0 |
0 |
N |
N |
1,000 |
1,592 |
1,779 |
32,509 |
32,244 |
N |
0 |
0 |
N |
N |
|
Georgia |
N |
0 |
0 |
N |
N |
936 |
984 |
2,050 |
19,211 |
20,339 |
N |
0 |
0 |
N |
N |
|
Maryland |
— |
0 |
1 |
— |
2 |
— |
463 |
881 |
8,160 |
9,598 |
— |
0 |
1 |
2 |
3 |
|
North Carolina |
N |
0 |
0 |
N |
N |
733 |
937 |
1,835 |
20,405 |
20,621 |
N |
0 |
0 |
N |
N |
|
South Carolina |
— |
0 |
1 |
— |
— |
— |
511 |
927 |
10,107 |
10,883 |
N |
0 |
0 |
N |
N |
|
Virginia |
N |
0 |
0 |
N |
N |
949 |
660 |
1,267 |
14,174 |
14,075 |
N |
0 |
0 |
N |
N |
|
West Virginia |
— |
0 |
0 |
— |
— |
30 |
97 |
127 |
1,751 |
2,034 |
N |
0 |
0 |
N |
N |
|
E.S. Central |
— |
0 |
0 |
— |
— |
403 |
1,832 |
2,209 |
34,152 |
39,140 |
— |
0 |
0 |
— |
— |
|
Alabama |
— |
0 |
0 |
— |
— |
— |
559 |
735 |
10,017 |
12,100 |
N |
0 |
0 |
N |
N |
|
Kentucky |
N |
0 |
0 |
N |
N |
253 |
317 |
465 |
6,198 |
6,834 |
N |
0 |
0 |
N |
N |
|
Mississippi |
N |
0 |
0 |
N |
N |
— |
314 |
987 |
7,319 |
7,881 |
N |
0 |
0 |
N |
N |
|
Tennessee |
— |
0 |
0 |
— |
— |
150 |
583 |
843 |
10,618 |
12,325 |
N |
0 |
0 |
N |
N |
|
W.S. Central |
— |
0 |
1 |
— |
— |
374 |
3,480 |
4,557 |
59,012 |
78,560 |
— |
0 |
1 |
— |
2 |
|
Arkansas |
N |
0 |
0 |
N |
N |
225 |
287 |
424 |
5,981 |
6,694 |
N |
0 |
0 |
N |
N |
|
Louisiana |
— |
0 |
1 |
— |
— |
101 |
483 |
1,359 |
5,358 |
9,897 |
— |
0 |
1 |
— |
2 |
|
Oklahoma |
N |
0 |
0 |
N |
N |
48 |
323 |
532 |
2,494 |
7,330 |
N |
0 |
0 |
N |
N |
|
Texas |
N |
0 |
0 |
N |
N |
— |
2,371 |
2,991 |
45,179 |
54,639 |
N |
0 |
0 |
N |
N |
|
Mountain |
— |
0 |
0 |
— |
— |
298 |
1,818 |
2,764 |
37,554 |
36,548 |
113 |
118 |
209 |
2,686 |
2,297 |
|
Arizona |
N |
0 |
0 |
N |
N |
— |
611 |
1,348 |
15,029 |
10,254 |
113 |
114 |
208 |
2,635 |
2,242 |
|
Colorado |
N |
0 |
0 |
N |
N |
— |
366 |
569 |
7,704 |
8,821 |
N |
0 |
0 |
N |
N |
|
Idaho |
N |
0 |
0 |
N |
N |
— |
101 |
225 |
1,683 |
2,002 |
N |
0 |
0 |
N |
N |
|
Montana |
— |
0 |
0 |
— |
— |
56 |
75 |
104 |
1,574 |
1,502 |
— |
0 |
1 |
3 |
1 |
|
Nevada |
N |
0 |
0 |
N |
N |
— |
215 |
339 |
3,857 |
4,652 |
— |
2 |
5 |
30 |
28 |
|
New Mexico |
N |
0 |
0 |
N |
N |
162 |
211 |
353 |
4,272 |
5,406 |
— |
0 |
2 |
2 |
13 |
|
Utah |
— |
0 |
0 |
— |
— |
80 |
147 |
176 |
2,999 |
3,049 |
— |
1 |
4 |
15 |
11 |
|
Wyoming |
— |
0 |
0 |
— |
— |
— |
31 |
67 |
436 |
862 |
— |
0 |
1 |
1 |
2 |
|
Pacific |
— |
0 |
2 |
1 |
— |
1,805 |
4,065 |
4,479 |
76,934 |
87,602 |
22 |
65 |
95 |
845 |
1,316 |
|
Alaska |
N |
0 |
0 |
N |
N |
37 |
112 |
147 |
2,203 |
2,330 |
— |
0 |
0 |
— |
— |
|
California |
— |
0 |
2 |
1 |
— |
1,113 |
3,080 |
3,390 |
59,214 |
66,393 |
22 |
65 |
95 |
845 |
1,315 |
|
Hawaii |
N |
0 |
0 |
N |
N |
— |
126 |
158 |
2,139 |
2,718 |
N |
0 |
0 |
N |
N |
|
Oregon |
— |
0 |
0 |
— |
— |
272 |
284 |
395 |
6,292 |
5,963 |
— |
0 |
1 |
— |
1 |
|
Washington |
— |
0 |
1 |
— |
— |
383 |
443 |
596 |
7,086 |
10,198 |
N |
0 |
0 |
N |
N |
|
Territories |
|||||||||||||||
|
American Samoa |
N |
— |
— |
N |
N |
— |
— |
— |
— |
— |
N |
— |
— |
N |
N |
|
C.N.M.I. |
— |
— |
— |
— |
— |
— |
— |
— |
— |
— |
— |
— |
— |
— |
— |
|
Guam |
— |
— |
— |
— |
— |
— |
— |
— |
— |
— |
— |
— |
— |
— |
— |
|
Puerto Rico |
N |
0 |
0 |
N |
N |
83 |
101 |
277 |
2,270 |
2,470 |
N |
0 |
0 |
N |
N |
|
U.S. Virgin Islands |
N |
0 |
0 |
N |
N |
— |
15 |
25 |
253 |
304 |
— |
0 |
0 |
— |
— |
|
C.N.M.I.: Commonwealth of Northern Mariana Islands. U: Unavailable. —: No reported cases. N: Not reportable. NN: Not Nationally Notifiable. Cum: Cumulative year-to-date counts. Med: Median. Max: Maximum. * Case counts for reporting year 2013 and 2014 are provisional and subject to change. For further information on interpretation of these data, see http://wwwn.cdc.gov/nndss/document/ProvisionalNationaNotifiableDiseasesSurveillanceData20100927.pdf. Data for TB are displayed in Table IV, which appears quarterly. |
|||||||||||||||
|
TABLE II. (Continued) Provisional cases of selected notifiable diseases, United States, weeks ending May 24, 2014, and May 25, 2013 (21st week)* |
|||||||||||||||
|---|---|---|---|---|---|---|---|---|---|---|---|---|---|---|---|
|
Reporting area |
Cryptosporidiosis |
Dengue Virus Infection |
|||||||||||||
|
Dengue Fever† |
Dengue Hemorrhagic Fever§ |
||||||||||||||
|
Current week |
Previous 52 weeks |
Cum 2014 |
Cum 2013 |
Current week |
Previous 52 weeks |
Cum 2014 |
Cum 2013 |
Current week |
Previous 52 weeks |
Cum 2014 |
Cum 2013 |
||||
|
Med |
Max |
Med |
Max |
Med |
Max |
||||||||||
|
United States |
55 |
112 |
475 |
1,795 |
2,019 |
— |
11 |
49 |
46 |
210 |
— |
0 |
2 |
— |
1 |
|
New England |
— |
5 |
14 |
88 |
80 |
— |
0 |
3 |
3 |
10 |
— |
0 |
0 |
— |
— |
|
Connecticut |
— |
0 |
5 |
12 |
7 |
— |
0 |
2 |
— |
3 |
— |
0 |
0 |
— |
— |
|
Maine |
— |
0 |
4 |
19 |
11 |
— |
0 |
0 |
— |
1 |
— |
0 |
0 |
— |
— |
|
Massachusetts |
— |
2 |
7 |
38 |
42 |
— |
0 |
0 |
— |
— |
— |
0 |
0 |
— |
— |
|
New Hampshire |
— |
1 |
4 |
9 |
12 |
— |
0 |
1 |
— |
3 |
— |
0 |
0 |
— |
— |
|
Rhode Island |
— |
0 |
3 |
5 |
2 |
— |
0 |
1 |
1 |
2 |
— |
0 |
0 |
— |
— |
|
Vermont |
— |
0 |
3 |
5 |
6 |
— |
0 |
2 |
2 |
1 |
— |
0 |
0 |
— |
— |
|
Mid. Atlantic |
10 |
12 |
42 |
192 |
195 |
— |
2 |
12 |
11 |
63 |
— |
0 |
1 |
— |
— |
|
New Jersey |
— |
1 |
5 |
10 |
22 |
— |
0 |
0 |
— |
— |
— |
0 |
0 |
— |
— |
|
New York (Upstate) |
3 |
4 |
16 |
56 |
49 |
— |
0 |
3 |
— |
24 |
— |
0 |
1 |
— |
— |
|
New York City |
— |
2 |
6 |
25 |
19 |
— |
2 |
9 |
6 |
28 |
— |
0 |
1 |
— |
— |
|
Pennsylvania |
7 |
6 |
30 |
101 |
105 |
— |
0 |
3 |
5 |
11 |
— |
0 |
0 |
— |
— |
|
E.N. Central |
6 |
21 |
64 |
341 |
438 |
— |
1 |
6 |
7 |
23 |
— |
0 |
0 |
— |
— |
|
Illinois |
— |
4 |
16 |
55 |
64 |
— |
0 |
3 |
1 |
6 |
— |
0 |
0 |
— |
— |
|
Indiana |
— |
2 |
7 |
31 |
48 |
— |
0 |
1 |
— |
3 |
— |
0 |
0 |
— |
— |
|
Michigan |
— |
4 |
15 |
56 |
81 |
— |
0 |
3 |
— |
6 |
— |
0 |
0 |
— |
— |
|
Ohio |
3 |
6 |
17 |
105 |
118 |
— |
0 |
2 |
5 |
3 |
— |
0 |
0 |
— |
— |
|
Wisconsin |
3 |
7 |
25 |
94 |
127 |
— |
0 |
1 |
1 |
5 |
— |
0 |
0 |
— |
— |
|
W.N. Central |
1 |
19 |
200 |
182 |
365 |
— |
0 |
3 |
2 |
9 |
— |
0 |
1 |
— |
1 |
|
Iowa |
— |
6 |
160 |
65 |
92 |
— |
0 |
0 |
— |
— |
— |
0 |
1 |
— |
1 |
|
Kansas |
— |
1 |
7 |
18 |
34 |
— |
0 |
1 |
— |
1 |
— |
0 |
0 |
— |
— |
|
Minnesota |
— |
4 |
17 |
— |
85 |
— |
0 |
2 |
— |
6 |
— |
0 |
1 |
— |
— |
|
Missouri |
1 |
3 |
11 |
42 |
63 |
— |
0 |
2 |
2 |
— |
— |
0 |
0 |
— |
— |
|
Nebraska |
— |
2 |
11 |
19 |
36 |
— |
0 |
0 |
— |
— |
— |
0 |
0 |
— |
— |
|
North Dakota |
— |
1 |
7 |
11 |
16 |
— |
0 |
1 |
— |
1 |
— |
0 |
0 |
— |
— |
|
South Dakota |
— |
2 |
17 |
27 |
39 |
— |
0 |
1 |
— |
1 |
— |
0 |
0 |
— |
— |
|
S. Atlantic |
25 |
21 |
54 |
426 |
357 |
— |
2 |
16 |
16 |
57 |
— |
0 |
1 |
— |
— |
|
Delaware |
— |
0 |
2 |
2 |
3 |
— |
0 |
1 |
— |
— |
— |
0 |
0 |
— |
— |
|
District of Columbia |
N |
0 |
0 |
N |
N |
— |
0 |
0 |
— |
— |
— |
0 |
0 |
— |
— |
|
Florida |
8 |
8 |
23 |
168 |
115 |
— |
1 |
13 |
5 |
39 |
— |
0 |
0 |
— |
— |
|
Georgia |
14 |
6 |
15 |
102 |
90 |
— |
0 |
2 |
1 |
2 |
— |
0 |
0 |
— |
— |
|
Maryland |
— |
1 |
4 |
18 |
22 |
— |
0 |
2 |
3 |
4 |
— |
0 |
0 |
— |
— |
|
North Carolina |
1 |
0 |
28 |
55 |
50 |
— |
0 |
2 |
2 |
6 |
— |
0 |
0 |
— |
— |
|
South Carolina |
— |
1 |
8 |
30 |
27 |
— |
0 |
4 |
— |
1 |
— |
0 |
0 |
— |
— |
|
Virginia |
2 |
3 |
9 |
49 |
42 |
— |
0 |
3 |
5 |
5 |
— |
0 |
1 |
— |
— |
|
West Virginia |
— |
0 |
2 |
2 |
8 |
— |
0 |
1 |
— |
— |
— |
0 |
0 |
— |
— |
|
E.S. Central |
2 |
6 |
19 |
106 |
95 |
— |
0 |
2 |
1 |
7 |
— |
0 |
0 |
— |
— |
|
Alabama |
1 |
2 |
9 |
38 |
42 |
— |
0 |
2 |
— |
1 |
— |
0 |
0 |
— |
— |
|
Kentucky |
1 |
1 |
5 |
19 |
24 |
— |
0 |
0 |
— |
— |
— |
0 |
0 |
— |
— |
|
Mississippi |
— |
1 |
5 |
19 |
12 |
— |
0 |
1 |
1 |
1 |
— |
0 |
0 |
— |
— |
|
Tennessee |
— |
2 |
6 |
30 |
17 |
— |
0 |
2 |
— |
5 |
— |
0 |
0 |
— |
— |
|
W.S. Central |
3 |
13 |
47 |
156 |
181 |
— |
1 |
11 |
1 |
9 |
— |
0 |
0 |
— |
— |
|
Arkansas |
— |
1 |
12 |
8 |
8 |
— |
0 |
1 |
— |
— |
— |
0 |
0 |
— |
— |
|
Louisiana |
— |
4 |
33 |
44 |
70 |
— |
0 |
1 |
— |
3 |
— |
0 |
0 |
— |
— |
|
Oklahoma |
1 |
1 |
4 |
18 |
20 |
— |
0 |
2 |
— |
— |
— |
0 |
0 |
— |
— |
|
Texas |
2 |
6 |
37 |
86 |
83 |
— |
1 |
11 |
1 |
6 |
— |
0 |
0 |
— |
— |
|
Mountain |
1 |
8 |
61 |
120 |
148 |
— |
0 |
1 |
2 |
2 |
— |
0 |
0 |
— |
— |
|
Arizona |
— |
1 |
6 |
19 |
11 |
— |
0 |
1 |
— |
— |
— |
0 |
0 |
— |
— |
|
Colorado |
— |
1 |
7 |
15 |
24 |
— |
0 |
0 |
— |
— |
— |
0 |
0 |
— |
— |
|
Idaho |
1 |
2 |
22 |
23 |
38 |
— |
0 |
1 |
— |
— |
— |
0 |
0 |
— |
— |
|
Montana |
— |
1 |
23 |
17 |
23 |
— |
0 |
1 |
— |
— |
— |
0 |
0 |
— |
— |
|
Nevada |
— |
0 |
2 |
6 |
7 |
— |
0 |
1 |
2 |
2 |
— |
0 |
0 |
— |
— |
|
New Mexico |
— |
1 |
4 |
20 |
11 |
— |
0 |
0 |
— |
— |
— |
0 |
0 |
— |
— |
|
Utah |
— |
1 |
8 |
16 |
33 |
— |
0 |
0 |
— |
— |
— |
0 |
0 |
— |
— |
|
Wyoming |
— |
0 |
25 |
4 |
1 |
— |
0 |
1 |
— |
— |
— |
0 |
0 |
— |
— |
|
Pacific |
7 |
11 |
76 |
184 |
160 |
— |
1 |
9 |
3 |
30 |
— |
0 |
0 |
— |
— |
|
Alaska |
— |
0 |
1 |
1 |
— |
— |
0 |
0 |
— |
1 |
— |
0 |
0 |
— |
— |
|
California |
4 |
6 |
15 |
124 |
93 |
— |
1 |
9 |
— |
21 |
— |
0 |
0 |
— |
— |
|
Hawaii |
— |
0 |
0 |
— |
1 |
— |
0 |
2 |
2 |
4 |
— |
0 |
0 |
— |
— |
|
Oregon |
3 |
3 |
58 |
39 |
45 |
— |
0 |
0 |
— |
— |
— |
0 |
0 |
— |
— |
|
Washington |
— |
0 |
11 |
20 |
21 |
— |
0 |
2 |
1 |
4 |
— |
0 |
0 |
— |
— |
|
Territories |
|||||||||||||||
|
American Samoa |
N |
— |
— |
N |
N |
— |
— |
— |
— |
— |
— |
— |
— |
— |
— |
|
C.N.M.I. |
— |
— |
— |
— |
— |
— |
— |
— |
— |
— |
— |
— |
— |
— |
— |
|
Guam |
— |
— |
— |
— |
— |
— |
— |
— |
— |
— |
— |
— |
— |
— |
— |
|
Puerto Rico |
N |
0 |
0 |
N |
N |
— |
39 |
424 |
313 |
2,890 |
— |
0 |
5 |
2 |
22 |
|
U.S. Virgin Islands |
— |
0 |
0 |
— |
— |
— |
0 |
0 |
— |
— |
— |
0 |
0 |
— |
— |
|
C.N.M.I.: Commonwealth of Northern Mariana Islands. U: Unavailable. —: No reported cases. N: Not reportable. NN: Not Nationally Notifiable. Cum: Cumulative year-to-date counts. Med: Median. Max: Maximum. * Case counts for reporting year 2013 and 2014 are provisional and subject to change. For further information on interpretation of these data, see http://wwwn.cdc.gov/nndss/document/ProvisionalNationaNotifiableDiseasesSurveillanceData20100927.pdf. Data for TB are displayed in Table IV, which appears quarterly. † Dengue Fever includes cases that meet criteria for Dengue Fever with hemorrhage, other clinical and unknown case classifications. § DHF includes cases that meet criteria for dengue shock syndrome (DSS), a more severe form of DHF. |
|||||||||||||||
|
TABLE II. (Continued) Provisional cases of selected notifiable diseases, United States, weeks ending May 24, 2014, and May 25, 2013 (21st week)* (Export data) |
|||||||||||||||
|---|---|---|---|---|---|---|---|---|---|---|---|---|---|---|---|
|
Reporting area |
Ehrlichiosis/Anaplasmosis† |
||||||||||||||
|
Ehrlichia chaffeensis |
Anaplasma phagocytophilum |
Undetermined |
|||||||||||||
|
Current week |
Previous 52 weeks |
Cum 2014 |
Cum 2013 |
Current week |
Previous 52 weeks |
Cum 2014 |
Cum 2013 |
Current week |
Previous 52 weeks |
Cum 2014 |
Cum 2013 |
||||
|
Med |
Max |
Med |
Max |
Med |
Max |
||||||||||
|
United States |
10 |
14 |
107 |
95 |
111 |
9 |
33 |
176 |
94 |
204 |
2 |
3 |
14 |
6 |
18 |
|
New England |
— |
0 |
9 |
3 |
6 |
1 |
5 |
32 |
21 |
46 |
— |
0 |
1 |
— |
— |
|
Connecticut |
— |
0 |
0 |
— |
— |
— |
0 |
17 |
— |
21 |
— |
0 |
0 |
— |
— |
|
Maine |
— |
0 |
2 |
2 |
— |
1 |
2 |
8 |
15 |
7 |
— |
0 |
1 |
— |
— |
|
Massachusetts |
— |
0 |
0 |
— |
— |
— |
0 |
0 |
— |
— |
— |
0 |
0 |
— |
— |
|
New Hampshire |
— |
0 |
1 |
— |
1 |
— |
0 |
8 |
1 |
14 |
— |
0 |
1 |
— |
— |
|
Rhode Island |
— |
0 |
9 |
1 |
4 |
— |
0 |
16 |
2 |
2 |
— |
0 |
0 |
— |
— |
|
Vermont |
— |
0 |
2 |
— |
1 |
— |
1 |
4 |
3 |
2 |
— |
0 |
1 |
— |
— |
|
Mid. Atlantic |
2 |
2 |
17 |
12 |
6 |
8 |
9 |
33 |
36 |
42 |
1 |
0 |
3 |
1 |
5 |
|
New Jersey |
— |
0 |
6 |
3 |
4 |
— |
0 |
9 |
3 |
19 |
— |
0 |
1 |
— |
1 |
|
New York (Upstate) |
2 |
1 |
17 |
8 |
1 |
8 |
7 |
27 |
33 |
20 |
1 |
0 |
3 |
1 |
1 |
|
New York City |
— |
0 |
3 |
1 |
1 |
— |
0 |
3 |
— |
2 |
— |
0 |
0 |
— |
— |
|
Pennsylvania |
— |
0 |
2 |
— |
— |
— |
0 |
5 |
— |
1 |
— |
0 |
2 |
— |
3 |
|
E.N. Central |
— |
1 |
9 |
5 |
17 |
— |
5 |
48 |
21 |
78 |
— |
0 |
9 |
2 |
5 |
|
Illinois |
— |
0 |
7 |
3 |
7 |
— |
0 |
2 |
1 |
1 |
— |
0 |
0 |
— |
— |
|
Indiana |
— |
0 |
0 |
— |
— |
— |
0 |
0 |
— |
— |
— |
0 |
8 |
— |
2 |
|
Michigan |
— |
0 |
0 |
— |
1 |
— |
0 |
2 |
— |
1 |
— |
0 |
1 |
— |
— |
|
Ohio |
— |
0 |
1 |
— |
2 |
— |
0 |
1 |
— |
2 |
— |
0 |
1 |
— |
— |
|
Wisconsin |
— |
0 |
6 |
2 |
7 |
— |
5 |
48 |
20 |
74 |
— |
0 |
5 |
2 |
3 |
|
W.N. Central |
2 |
2 |
48 |
16 |
23 |
— |
3 |
70 |
4 |
24 |
1 |
0 |
6 |
2 |
4 |
|
Iowa |
N |
0 |
0 |
N |
N |
N |
0 |
0 |
N |
N |
N |
0 |
0 |
N |
N |
|
Kansas |
— |
0 |
11 |
2 |
9 |
— |
0 |
2 |
1 |
1 |
— |
0 |
0 |
— |
— |
|
Minnesota |
— |
0 |
2 |
— |
1 |
— |
3 |
70 |
— |
22 |
— |
0 |
6 |
— |
2 |
|
Missouri |
2 |
2 |
39 |
14 |
11 |
— |
0 |
2 |
3 |
1 |
1 |
0 |
2 |
2 |
2 |
|
Nebraska |
— |
0 |
1 |
— |
1 |
— |
0 |
1 |
— |
— |
— |
0 |
0 |
— |
— |
|
North Dakota |
— |
0 |
0 |
— |
— |
— |
0 |
2 |
— |
— |
— |
0 |
1 |
— |
— |
|
South Dakota |
— |
0 |
0 |
— |
1 |
— |
0 |
0 |
— |
— |
— |
0 |
0 |
— |
— |
|
S. Atlantic |
2 |
4 |
29 |
32 |
21 |
— |
0 |
5 |
8 |
9 |
— |
0 |
2 |
1 |
— |
|
Delaware |
— |
0 |
2 |
1 |
1 |
— |
0 |
1 |
1 |
— |
— |
0 |
1 |
— |
— |
|
District of Columbia |
N |
0 |
0 |
N |
N |
N |
0 |
0 |
N |
N |
N |
0 |
0 |
N |
N |
|
Florida |
2 |
0 |
3 |
10 |
2 |
— |
0 |
1 |
— |
1 |
— |
0 |
0 |
— |
— |
|
Georgia |
— |
0 |
5 |
13 |
6 |
— |
0 |
0 |
— |
— |
— |
0 |
0 |
— |
— |
|
Maryland |
— |
0 |
5 |
3 |
— |
— |
0 |
2 |
5 |
1 |
— |
0 |
1 |
— |
— |
|
North Carolina |
— |
0 |
12 |
5 |
2 |
— |
0 |
3 |
1 |
1 |
— |
0 |
0 |
— |
— |
|
South Carolina |
— |
0 |
2 |
— |
— |
— |
0 |
0 |
— |
— |
— |
0 |
0 |
— |
— |
|
Virginia |
— |
1 |
8 |
— |
10 |
— |
0 |
3 |
1 |
4 |
— |
0 |
1 |
1 |
— |
|
West Virginia |
— |
0 |
1 |
— |
— |
— |
0 |
1 |
— |
2 |
— |
0 |
1 |
— |
— |
|
E.S. Central |
2 |
2 |
16 |
14 |
14 |
— |
0 |
1 |
1 |
2 |
— |
0 |
3 |
— |
1 |
|
Alabama |
— |
0 |
2 |
2 |
2 |
— |
0 |
1 |
1 |
— |
— |
0 |
1 |
— |
— |
|
Kentucky |
1 |
1 |
7 |
3 |
4 |
— |
0 |
0 |
— |
— |
— |
0 |
0 |
— |
— |
|
Mississippi |
— |
0 |
1 |
— |
— |
— |
0 |
0 |
— |
1 |
— |
0 |
0 |
— |
1 |
|
Tennessee |
1 |
1 |
10 |
9 |
8 |
— |
0 |
1 |
— |
1 |
— |
0 |
3 |
— |
— |
|
W.S. Central |
2 |
2 |
63 |
13 |
24 |
— |
0 |
8 |
3 |
3 |
— |
0 |
0 |
— |
— |
|
Arkansas |
2 |
1 |
16 |
9 |
20 |
— |
0 |
2 |
2 |
2 |
— |
0 |
0 |
— |
— |
|
Louisiana |
— |
0 |
1 |
— |
— |
— |
0 |
1 |
— |
— |
— |
0 |
0 |
— |
— |
|
Oklahoma |
— |
0 |
62 |
3 |
4 |
— |
0 |
8 |
1 |
1 |
— |
0 |
0 |
— |
— |
|
Texas |
— |
0 |
1 |
1 |
— |
— |
0 |
0 |
— |
— |
— |
0 |
0 |
— |
— |
|
Mountain |
— |
0 |
1 |
— |
— |
— |
0 |
1 |
— |
— |
— |
0 |
1 |
— |
— |
|
Arizona |
— |
0 |
0 |
— |
— |
— |
0 |
0 |
— |
— |
— |
0 |
1 |
— |
— |
|
Colorado |
N |
0 |
0 |
N |
N |
N |
0 |
0 |
N |
N |
N |
0 |
0 |
N |
N |
|
Idaho |
N |
0 |
0 |
N |
N |
N |
0 |
0 |
N |
N |
N |
0 |
0 |
N |
N |
|
Montana |
— |
0 |
1 |
— |
— |
— |
0 |
0 |
— |
— |
— |
0 |
0 |
— |
— |
|
Nevada |
— |
0 |
0 |
— |
— |
— |
0 |
1 |
— |
— |
— |
0 |
0 |
— |
— |
|
New Mexico |
N |
0 |
0 |
N |
N |
N |
0 |
0 |
N |
N |
N |
0 |
0 |
N |
N |
|
Utah |
— |
0 |
1 |
— |
— |
— |
0 |
0 |
— |
— |
— |
0 |
0 |
— |
— |
|
Wyoming |
— |
0 |
0 |
— |
— |
— |
0 |
0 |
— |
— |
— |
0 |
0 |
— |
— |
|
Pacific |
— |
0 |
0 |
— |
— |
— |
0 |
2 |
— |
— |
— |
0 |
1 |
— |
3 |
|
Alaska |
N |
0 |
0 |
N |
N |
N |
0 |
0 |
N |
N |
N |
0 |
0 |
N |
N |
|
California |
— |
0 |
0 |
— |
— |
— |
0 |
0 |
— |
— |
— |
0 |
1 |
— |
3 |
|
Hawaii |
N |
0 |
0 |
N |
N |
N |
0 |
0 |
N |
N |
N |
0 |
0 |
N |
N |
|
Oregon |
— |
0 |
0 |
— |
— |
— |
0 |
1 |
— |
— |
— |
0 |
0 |
— |
— |
|
Washington |
— |
0 |
0 |
— |
— |
— |
0 |
2 |
— |
— |
— |
0 |
0 |
— |
— |
|
Territories |
|||||||||||||||
|
American Samoa |
N |
— |
— |
N |
N |
N |
— |
— |
N |
N |
N |
— |
— |
N |
N |
|
C.N.M.I. |
— |
— |
— |
— |
— |
— |
— |
— |
— |
— |
— |
— |
— |
— |
— |
|
Guam |
N |
— |
— |
N |
N |
N |
— |
— |
N |
N |
N |
— |
— |
N |
N |
|
Puerto Rico |
N |
0 |
0 |
N |
N |
N |
0 |
0 |
N |
N |
N |
0 |
0 |
N |
N |
|
U.S. Virgin Islands |
— |
0 |
0 |
— |
— |
— |
0 |
0 |
— |
— |
— |
0 |
0 |
— |
— |
|
C.N.M.I.: Commonwealth of Northern Mariana Islands. U: Unavailable. —: No reported cases. N: Not reportable. NN: Not Nationally Notifiable. Cum: Cumulative year-to-date counts. Med: Median. Max: Maximum. * Case counts for reporting year 2013 and 2014 are provisional and subject to change. For further information on interpretation of these data, see http://wwwn.cdc.gov/nndss/document/ProvisionalNationaNotifiableDiseasesSurveillanceData20100927.pdf. Data for TB are displayed in Table IV, which appears quarterly. † Cumulative total E. ewingii cases reported for year 2013 = 31, and 0 cases reported for 2014. |
|||||||||||||||
|
TABLE II. (Continued) Provisional cases of selected notifiable diseases, United States, weeks ending May 24, 2014, and May 25, 2013 (21st week)* (Export data) |
|||||||||||||||
|
Reporting area |
Giardiasis |
Gonorrhea |
Haemophilus influenzae, invasive† All ages, all serotypes |
||||||||||||
|
Current week |
Previous 52 weeks |
Cum 2014 |
Cum 2013 |
Current week |
Previous 52 weeks |
Cum 2014 |
Cum 2013 |
Current week |
Previous 52 weeks |
Cum 2014 |
Cum 2013 |
||||
|
Med |
Max |
Med |
Max |
Med |
Max |
||||||||||
|
United States |
124 |
246 |
442 |
4,173 |
5,030 |
2,429 |
6,291 |
7,226 |
115,854 |
129,430 |
33 |
62 |
106 |
1,313 |
1,674 |
|
New England |
9 |
25 |
59 |
445 |
432 |
101 |
131 |
192 |
2,409 |
2,403 |
— |
4 |
11 |
76 |
96 |
|
Connecticut |
1 |
5 |
11 |
79 |
74 |
34 |
51 |
116 |
911 |
955 |
— |
1 |
5 |
13 |
20 |
|
Maine |
3 |
4 |
12 |
71 |
61 |
— |
5 |
10 |
87 |
104 |
— |
0 |
2 |
8 |
13 |
|
Massachusetts |
4 |
12 |
26 |
230 |
231 |
63 |
63 |
100 |
1,192 |
1,113 |
— |
2 |
7 |
39 |
48 |
|
New Hampshire |
— |
1 |
7 |
16 |
25 |
4 |
2 |
8 |
61 |
50 |
— |
0 |
3 |
10 |
10 |
|
Rhode Island |
— |
0 |
7 |
17 |
12 |
— |
5 |
42 |
135 |
142 |
— |
0 |
9 |
3 |
— |
|
Vermont |
1 |
3 |
16 |
32 |
29 |
— |
1 |
6 |
23 |
39 |
— |
0 |
2 |
3 |
5 |
|
Mid. Atlantic |
26 |
51 |
94 |
874 |
909 |
419 |
759 |
926 |
14,379 |
16,130 |
9 |
11 |
24 |
221 |
260 |
|
New Jersey |
— |
5 |
14 |
45 |
123 |
38 |
132 |
164 |
2,402 |
2,718 |
— |
2 |
7 |
55 |
51 |
|
New York (Upstate) |
16 |
18 |
61 |
328 |
257 |
124 |
117 |
339 |
2,222 |
2,524 |
4 |
3 |
17 |
58 |
65 |
|
New York City |
— |
14 |
26 |
274 |
299 |
64 |
251 |
324 |
4,946 |
5,555 |
— |
2 |
7 |
44 |
45 |
|
Pennsylvania |
10 |
14 |
28 |
227 |
230 |
193 |
257 |
326 |
4,809 |
5,333 |
5 |
3 |
7 |
64 |
99 |
|
E.N. Central |
15 |
34 |
65 |
454 |
679 |
280 |
1,023 |
1,240 |
16,554 |
22,310 |
1 |
10 |
19 |
161 |
266 |
|
Illinois |
— |
4 |
22 |
23 |
99 |
12 |
278 |
375 |
3,161 |
6,488 |
— |
3 |
6 |
43 |
64 |
|
Indiana |
— |
3 |
11 |
31 |
71 |
37 |
142 |
191 |
2,571 |
2,883 |
— |
2 |
6 |
26 |
56 |
|
Michigan |
1 |
10 |
27 |
149 |
164 |
86 |
184 |
271 |
3,445 |
4,411 |
— |
2 |
5 |
30 |
40 |
|
Ohio |
10 |
8 |
25 |
137 |
204 |
110 |
311 |
391 |
5,875 |
6,715 |
1 |
2 |
9 |
50 |
69 |
|
Wisconsin |
4 |
7 |
15 |
114 |
141 |
35 |
84 |
123 |
1,502 |
1,813 |
— |
1 |
5 |
12 |
37 |
|
W.N. Central |
4 |
22 |
65 |
222 |
494 |
24 |
339 |
421 |
5,985 |
6,670 |
— |
4 |
14 |
101 |
123 |
|
Iowa |
2 |
5 |
15 |
72 |
65 |
— |
28 |
42 |
532 |
592 |
— |
0 |
1 |
— |
— |
|
Kansas |
— |
2 |
7 |
18 |
27 |
7 |
45 |
69 |
891 |
731 |
— |
0 |
3 |
12 |
25 |
|
Minnesota |
— |
10 |
24 |
— |
186 |
— |
71 |
107 |
1,107 |
1,472 |
— |
2 |
8 |
43 |
32 |
|
Missouri |
1 |
4 |
15 |
51 |
112 |
— |
144 |
180 |
2,506 |
2,882 |
— |
2 |
6 |
35 |
47 |
|
Nebraska |
— |
3 |
9 |
37 |
62 |
17 |
25 |
41 |
528 |
538 |
— |
0 |
3 |
8 |
14 |
|
North Dakota |
— |
0 |
4 |
8 |
13 |
— |
10 |
21 |
193 |
172 |
— |
0 |
2 |
3 |
4 |
|
South Dakota |
1 |
2 |
9 |
36 |
29 |
— |
15 |
27 |
228 |
283 |
— |
0 |
1 |
— |
1 |
|
S. Atlantic |
32 |
45 |
73 |
812 |
883 |
969 |
1,402 |
1,750 |
27,547 |
29,244 |
15 |
17 |
30 |
384 |
439 |
|
Delaware |
— |
0 |
3 |
6 |
3 |
11 |
25 |
65 |
465 |
483 |
— |
0 |
3 |
9 |
5 |
|
District of Columbia |
— |
0 |
4 |
4 |
33 |
— |
31 |
82 |
— |
1,039 |
— |
0 |
1 |
1 |
7 |
|
Florida |
20 |
20 |
36 |
395 |
411 |
235 |
407 |
525 |
8,169 |
8,166 |
10 |
5 |
13 |
152 |
128 |
|
Georgia |
6 |
12 |
26 |
199 |
225 |
227 |
259 |
612 |
4,815 |
5,864 |
— |
2 |
8 |
58 |
79 |
|
Maryland |
3 |
4 |
9 |
81 |
88 |
— |
108 |
175 |
1,714 |
2,055 |
2 |
2 |
5 |
31 |
43 |
|
North Carolina |
N |
0 |
0 |
N |
N |
202 |
267 |
508 |
6,077 |
5,636 |
3 |
2 |
8 |
64 |
69 |
|
South Carolina |
2 |
3 |
8 |
51 |
37 |
— |
146 |
279 |
2,929 |
2,880 |
— |
1 |
7 |
27 |
49 |
|
Virginia |
1 |
5 |
13 |
64 |
72 |
274 |
126 |
372 |
3,067 |
2,757 |
— |
2 |
7 |
30 |
41 |
|
West Virginia |
— |
1 |
4 |
12 |
14 |
20 |
19 |
34 |
311 |
364 |
— |
0 |
3 |
12 |
18 |
|
E.S. Central |
— |
3 |
8 |
60 |
68 |
90 |
455 |
572 |
8,399 |
10,682 |
4 |
5 |
9 |
99 |
133 |
|
Alabama |
— |
3 |
8 |
60 |
68 |
— |
152 |
216 |
2,559 |
3,456 |
1 |
1 |
4 |
31 |
40 |
|
Kentucky |
N |
0 |
0 |
N |
N |
58 |
80 |
125 |
1,433 |
1,719 |
— |
1 |
4 |
17 |
21 |
|
Mississippi |
N |
0 |
0 |
N |
N |
— |
97 |
276 |
2,028 |
2,335 |
— |
0 |
2 |
13 |
13 |
|
Tennessee |
N |
0 |
0 |
N |
N |
32 |
135 |
210 |
2,379 |
3,172 |
3 |
2 |
5 |
38 |
59 |
|
W.S. Central |
— |
6 |
15 |
80 |
118 |
87 |
975 |
1,327 |
15,538 |
19,982 |
4 |
4 |
11 |
80 |
86 |
|
Arkansas |
— |
2 |
8 |
30 |
31 |
54 |
77 |
143 |
1,734 |
1,612 |
— |
0 |
3 |
19 |
12 |
|
Louisiana |
— |
4 |
12 |
50 |
87 |
20 |
153 |
397 |
1,479 |
2,790 |
1 |
1 |
6 |
20 |
26 |
|
Oklahoma |
— |
0 |
0 |
— |
— |
13 |
97 |
151 |
783 |
1,837 |
3 |
2 |
9 |
36 |
47 |
|
Texas |
N |
0 |
0 |
N |
N |
— |
641 |
802 |
11,542 |
13,743 |
— |
0 |
1 |
5 |
1 |
|
Mountain |
4 |
21 |
41 |
343 |
369 |
25 |
312 |
469 |
6,454 |
5,225 |
— |
5 |
12 |
110 |
177 |
|
Arizona |
— |
2 |
7 |
30 |
32 |
— |
134 |
262 |
3,167 |
2,026 |
— |
1 |
4 |
20 |
70 |
|
Colorado |
— |
6 |
22 |
113 |
103 |
— |
54 |
90 |
1,085 |
1,152 |
— |
1 |
6 |
19 |
49 |
|
Idaho |
2 |
2 |
9 |
44 |
42 |
— |
4 |
15 |
82 |
40 |
— |
0 |
3 |
9 |
7 |
|
Montana |
— |
2 |
6 |
27 |
20 |
5 |
5 |
11 |
123 |
71 |
— |
0 |
1 |
5 |
1 |
|
Nevada |
— |
1 |
6 |
17 |
32 |
— |
54 |
85 |
903 |
964 |
— |
0 |
2 |
6 |
10 |
|
New Mexico |
— |
2 |
6 |
23 |
45 |
8 |
37 |
81 |
653 |
693 |
— |
1 |
3 |
24 |
21 |
|
Utah |
2 |
4 |
9 |
81 |
74 |
12 |
21 |
31 |
422 |
253 |
— |
1 |
4 |
26 |
18 |
|
Wyoming |
— |
0 |
2 |
8 |
21 |
— |
1 |
5 |
19 |
26 |
— |
0 |
1 |
1 |
1 |
|
Pacific |
34 |
51 |
123 |
883 |
1,078 |
434 |
910 |
1,102 |
18,589 |
16,784 |
— |
3 |
8 |
81 |
94 |
|
Alaska |
— |
1 |
7 |
28 |
21 |
2 |
24 |
42 |
478 |
374 |
— |
0 |
3 |
7 |
6 |
|
California |
28 |
31 |
102 |
641 |
760 |
330 |
740 |
922 |
15,553 |
13,824 |
— |
1 |
2 |
17 |
19 |
|
Hawaii |
1 |
0 |
4 |
7 |
23 |
1 |
13 |
22 |
248 |
315 |
— |
0 |
2 |
15 |
15 |
|
Oregon |
1 |
7 |
17 |
113 |
122 |
20 |
36 |
59 |
774 |
648 |
— |
1 |
4 |
39 |
51 |
|
Washington |
4 |
9 |
66 |
94 |
152 |
81 |
84 |
121 |
1,536 |
1,623 |
— |
0 |
3 |
3 |
3 |
|
Territories |
|||||||||||||||
|
American Samoa |
— |
— |
— |
— |
— |
— |
— |
— |
— |
— |
— |
— |
— |
— |
— |
|
C.N.M.I. |
— |
— |
— |
— |
— |
— |
— |
— |
— |
— |
— |
— |
— |
— |
— |
|
Guam |
— |
— |
— |
— |
— |
— |
— |
— |
— |
— |
— |
— |
— |
— |
— |
|
Puerto Rico |
— |
1 |
3 |
5 |
19 |
9 |
7 |
21 |
157 |
135 |
— |
0 |
1 |
— |
— |
|
U.S. Virgin Islands |
— |
0 |
0 |
— |
— |
— |
1 |
5 |
25 |
27 |
— |
0 |
0 |
— |
— |
|
C.N.M.I.: Commonwealth of Northern Mariana Islands. U: Unavailable. —: No reported cases. N: Not reportable. NN: Not Nationally Notifiable. Cum: Cumulative year-to-date counts. Med: Median. Max: Maximum. * Case counts for reporting year 2013 and 2014 are provisional and subject to change. For further information on interpretation of these data, see http://wwwn.cdc.gov/nndss/document/ProvisionalNationaNotifiableDiseasesSurveillanceData20100927.pdf. Data for TB are displayed in Table IV, which appears quarterly. † Data for H. influenzae (age <5 yrs for serotype b, nonserotype b, and unknown serotype) are available in Table I. |
|||||||||||||||
|
TABLE II. (Continued) Provisional cases of selected notifiable diseases, United States, weeks ending May 24, 2014, and May 25, 2013 (21st week)* (Export data) |
|||||||||||||||
|---|---|---|---|---|---|---|---|---|---|---|---|---|---|---|---|
|
Reporting area |
Hepatitis (viral, acute), by type |
||||||||||||||
|
A |
B |
C |
|||||||||||||
|
Current week |
Previous 52 weeks |
Cum 2014 |
Cum 2013 |
Current week |
Previous 52 weeks |
Cum 2014 |
Cum 2013 |
Current week |
Previous 52 weeks |
Cum 2014 |
Cum 2013 |
||||
|
Med |
Max |
Med |
Max |
Med |
Max |
||||||||||
|
United States |
15 |
28 |
56 |
383 |
627 |
19 |
55 |
76 |
950 |
1,143 |
14 |
36 |
67 |
596 |
799 |
|
New England |
— |
1 |
6 |
27 |
34 |
— |
1 |
7 |
23 |
31 |
— |
3 |
8 |
47 |
85 |
|
Connecticut |
— |
0 |
3 |
10 |
7 |
— |
0 |
2 |
6 |
— |
— |
0 |
1 |
3 |
— |
|
Maine |
— |
0 |
2 |
1 |
3 |
— |
0 |
1 |
4 |
8 |
— |
0 |
2 |
14 |
2 |
|
Massachusetts |
— |
0 |
3 |
9 |
17 |
— |
1 |
7 |
10 |
23 |
— |
3 |
7 |
30 |
81 |
|
New Hampshire |
— |
0 |
1 |
2 |
3 |
— |
0 |
2 |
— |
— |
N |
0 |
0 |
N |
N |
|
Rhode Island |
— |
0 |
1 |
3 |
1 |
U |
0 |
0 |
U |
U |
U |
0 |
0 |
U |
U |
|
Vermont |
— |
0 |
2 |
2 |
3 |
— |
0 |
2 |
3 |
— |
— |
0 |
1 |
— |
2 |
|
Mid. Atlantic |
4 |
4 |
16 |
47 |
99 |
2 |
3 |
11 |
60 |
97 |
6 |
5 |
15 |
91 |
124 |
|
New Jersey |
— |
1 |
6 |
4 |
24 |
— |
0 |
4 |
1 |
29 |
— |
1 |
4 |
9 |
52 |
|
New York (Upstate) |
4 |
1 |
5 |
11 |
25 |
1 |
1 |
3 |
13 |
18 |
6 |
2 |
11 |
41 |
39 |
|
New York City |
— |
2 |
7 |
20 |
24 |
— |
1 |
4 |
18 |
31 |
— |
0 |
4 |
9 |
4 |
|
Pennsylvania |
— |
1 |
3 |
12 |
26 |
1 |
1 |
4 |
28 |
19 |
— |
1 |
6 |
32 |
29 |
|
E.N. Central |
1 |
4 |
12 |
58 |
125 |
2 |
10 |
16 |
189 |
187 |
— |
7 |
35 |
122 |
133 |
|
Illinois |
— |
1 |
5 |
16 |
21 |
— |
1 |
5 |
15 |
42 |
— |
0 |
3 |
5 |
17 |
|
Indiana |
— |
0 |
3 |
10 |
12 |
— |
2 |
6 |
38 |
37 |
— |
3 |
8 |
26 |
56 |
|
Michigan |
— |
1 |
5 |
16 |
51 |
— |
1 |
4 |
23 |
26 |
— |
1 |
5 |
29 |
26 |
|
Ohio |
1 |
0 |
4 |
12 |
28 |
2 |
5 |
12 |
103 |
77 |
— |
1 |
30 |
57 |
14 |
|
Wisconsin |
— |
0 |
3 |
4 |
13 |
— |
0 |
3 |
10 |
5 |
— |
0 |
3 |
5 |
20 |
|
W.N. Central |
— |
1 |
6 |
18 |
23 |
— |
2 |
5 |
24 |
52 |
— |
1 |
5 |
14 |
38 |
|
Iowa |
— |
0 |
3 |
2 |
1 |
— |
0 |
2 |
3 |
5 |
— |
0 |
0 |
— |
— |
|
Kansas |
— |
0 |
3 |
3 |
1 |
— |
0 |
1 |
2 |
7 |
— |
0 |
3 |
10 |
7 |
|
Minnesota |
— |
0 |
2 |
— |
10 |
— |
0 |
2 |
— |
9 |
— |
0 |
3 |
— |
24 |
|
Missouri |
— |
0 |
2 |
9 |
4 |
— |
1 |
4 |
15 |
28 |
— |
0 |
4 |
3 |
4 |
|
Nebraska |
— |
0 |
2 |
1 |
5 |
— |
0 |
2 |
3 |
— |
— |
0 |
1 |
1 |
1 |
|
North Dakota |
— |
0 |
2 |
3 |
2 |
— |
0 |
0 |
— |
— |
— |
0 |
1 |
— |
2 |
|
South Dakota |
— |
0 |
1 |
— |
— |
— |
0 |
1 |
1 |
3 |
— |
0 |
1 |
— |
— |
|
S. Atlantic |
4 |
5 |
11 |
91 |
95 |
8 |
18 |
26 |
328 |
310 |
3 |
7 |
21 |
115 |
143 |
|
Delaware |
— |
0 |
1 |
— |
1 |
— |
0 |
1 |
2 |
6 |
U |
0 |
0 |
U |
U |
|
District of Columbia |
— |
0 |
0 |
— |
— |
— |
0 |
0 |
— |
— |
— |
0 |
0 |
— |
— |
|
Florida |
2 |
2 |
6 |
40 |
23 |
6 |
7 |
13 |
128 |
107 |
2 |
2 |
6 |
37 |
53 |
|
Georgia |
— |
1 |
3 |
17 |
14 |
1 |
2 |
6 |
44 |
48 |
— |
0 |
4 |
8 |
23 |
|
Maryland |
1 |
0 |
3 |
9 |
12 |
1 |
1 |
2 |
11 |
21 |
1 |
1 |
3 |
18 |
25 |
|
North Carolina |
1 |
0 |
2 |
10 |
25 |
— |
1 |
16 |
47 |
19 |
— |
1 |
15 |
15 |
15 |
|
South Carolina |
— |
0 |
1 |
2 |
4 |
— |
1 |
3 |
10 |
18 |
— |
0 |
1 |
1 |
— |
|
Virginia |
— |
0 |
3 |
11 |
15 |
— |
1 |
5 |
22 |
28 |
— |
1 |
5 |
18 |
10 |
|
West Virginia |
— |
0 |
1 |
2 |
1 |
— |
4 |
8 |
64 |
63 |
— |
1 |
6 |
18 |
17 |
|
E.S. Central |
— |
1 |
4 |
15 |
24 |
4 |
12 |
17 |
197 |
239 |
4 |
6 |
13 |
101 |
153 |
|
Alabama |
— |
0 |
2 |
4 |
1 |
— |
2 |
5 |
42 |
34 |
1 |
0 |
5 |
10 |
9 |
|
Kentucky |
— |
0 |
2 |
3 |
14 |
— |
4 |
8 |
37 |
71 |
— |
4 |
10 |
50 |
95 |
|
Mississippi |
— |
0 |
1 |
2 |
1 |
1 |
1 |
4 |
14 |
23 |
U |
0 |
0 |
U |
U |
|
Tennessee |
— |
0 |
2 |
6 |
8 |
3 |
5 |
10 |
104 |
111 |
3 |
2 |
4 |
41 |
49 |
|
W.S. Central |
5 |
3 |
12 |
48 |
38 |
1 |
5 |
18 |
61 |
119 |
— |
2 |
9 |
31 |
43 |
|
Arkansas |
— |
0 |
1 |
1 |
3 |
— |
0 |
4 |
5 |
31 |
— |
0 |
5 |
4 |
11 |
|
Louisiana |
— |
0 |
3 |
3 |
5 |
— |
1 |
8 |
17 |
20 |
— |
0 |
2 |
9 |
9 |
|
Oklahoma |
3 |
0 |
4 |
7 |
— |
— |
0 |
4 |
5 |
13 |
— |
0 |
5 |
8 |
12 |
|
Texas |
2 |
2 |
8 |
37 |
30 |
1 |
2 |
10 |
34 |
55 |
— |
0 |
4 |
10 |
11 |
|
Mountain |
— |
2 |
16 |
25 |
65 |
— |
1 |
5 |
19 |
39 |
— |
1 |
5 |
24 |
26 |
|
Arizona |
— |
1 |
6 |
7 |
22 |
— |
0 |
2 |
5 |
8 |
U |
0 |
0 |
U |
U |
|
Colorado |
— |
0 |
8 |
4 |
21 |
— |
0 |
2 |
1 |
10 |
— |
0 |
2 |
4 |
8 |
|
Idaho |
— |
0 |
1 |
— |
4 |
— |
0 |
2 |
3 |
3 |
— |
0 |
1 |
2 |
5 |
|
Montana |
— |
0 |
1 |
4 |
1 |
— |
0 |
1 |
— |
— |
— |
0 |
2 |
3 |
4 |
|
Nevada |
— |
0 |
3 |
3 |
5 |
— |
0 |
3 |
8 |
15 |
— |
0 |
1 |
2 |
5 |
|
New Mexico |
— |
0 |
2 |
4 |
7 |
— |
0 |
1 |
— |
1 |
— |
0 |
2 |
2 |
1 |
|
Utah |
— |
0 |
2 |
3 |
5 |
— |
0 |
1 |
2 |
2 |
— |
0 |
2 |
11 |
3 |
|
Wyoming |
— |
0 |
0 |
— |
— |
— |
0 |
0 |
— |
— |
— |
0 |
0 |
— |
— |
|
Pacific |
1 |
4 |
19 |
54 |
124 |
2 |
4 |
12 |
49 |
69 |
1 |
3 |
10 |
51 |
54 |
|
Alaska |
— |
0 |
1 |
1 |
1 |
— |
0 |
0 |
— |
1 |
— |
0 |
0 |
— |
— |
|
California |
— |
3 |
18 |
45 |
94 |
— |
2 |
6 |
24 |
46 |
— |
1 |
4 |
13 |
31 |
|
Hawaii |
— |
0 |
2 |
— |
10 |
— |
0 |
1 |
1 |
3 |
— |
0 |
0 |
— |
— |
|
Oregon |
— |
0 |
3 |
4 |
7 |
— |
0 |
4 |
15 |
12 |
— |
0 |
2 |
7 |
6 |
|
Washington |
1 |
0 |
4 |
4 |
12 |
2 |
0 |
7 |
9 |
7 |
1 |
1 |
9 |
31 |
17 |
|
Territories |
|||||||||||||||
|
American Samoa |
— |
— |
— |
— |
— |
— |
— |
— |
— |
— |
— |
— |
— |
— |
— |
|
C.N.M.I. |
— |
— |
— |
— |
— |
— |
— |
— |
— |
— |
— |
— |
— |
— |
— |
|
Guam |
— |
— |
— |
— |
— |
— |
— |
— |
— |
— |
— |
— |
— |
— |
— |
|
Puerto Rico |
— |
0 |
1 |
1 |
7 |
— |
0 |
2 |
5 |
23 |
N |
0 |
0 |
N |
N |
|
U.S. Virgin Islands |
— |
0 |
0 |
— |
— |
— |
0 |
0 |
— |
— |
— |
0 |
0 |
— |
— |
|
C.N.M.I.: Commonwealth of Northern Mariana Islands. U: Unavailable. —: No reported cases. N: Not reportable. NN: Not Nationally Notifiable. Cum: Cumulative year-to-date counts. Med: Median. Max: Maximum. * Case counts for reporting year 2013 and 2014 are provisional and subject to change. For further information on interpretation of these data, see http://wwwn.cdc.gov/nndss/document/ProvisionalNationaNotifiableDiseasesSurveillanceData20100927.pdf. Data for TB are displayed in Table IV, which appears quarterly. |
|||||||||||||||
|
TABLE II. (Continued) Provisional cases of selected notifiable diseases, United States, weeks ending May 24, 2014, and May 25, 2013 (21st week)* (Export data) |
|||||||||||||||
|
Reporting area |
Invasive Pneumococcal disease† |
Legionellosis |
|||||||||||||
|
All ages |
Age <5 |
||||||||||||||
|
Current week |
Previous 52 weeks |
Cum 2014 |
Cum 2013 |
Current week |
Previous 52 weeks |
Cum 2014 |
Cum 2013 |
Current week |
Previous 52 weeks |
Cum 2014 |
Cum 2013 |
||||
|
Med |
Max |
Med |
Max |
Med |
Max |
||||||||||
|
United States |
119 |
264 |
716 |
6,627 |
9,282 |
8 |
19 |
52 |
427 |
593 |
27 |
72 |
285 |
946 |
927 |
|
New England |
6 |
11 |
34 |
252 |
392 |
— |
1 |
3 |
15 |
20 |
1 |
6 |
25 |
71 |
49 |
|
Connecticut |
— |
4 |
10 |
78 |
202 |
— |
0 |
2 |
5 |
8 |
— |
1 |
10 |
17 |
5 |
|
Maine |
5 |
2 |
6 |
74 |
66 |
— |
0 |
1 |
2 |
3 |
— |
0 |
3 |
5 |
5 |
|
Massachusetts |
1 |
0 |
2 |
11 |
8 |
— |
0 |
2 |
6 |
7 |
1 |
3 |
20 |
35 |
26 |
|
New Hampshire |
— |
1 |
6 |
31 |
46 |
— |
0 |
1 |
1 |
2 |
— |
0 |
3 |
3 |
2 |
|
Rhode Island |
— |
1 |
18 |
27 |
36 |
— |
0 |
1 |
1 |
— |
— |
0 |
10 |
10 |
7 |
|
Vermont |
— |
1 |
4 |
31 |
34 |
— |
0 |
0 |
— |
— |
— |
0 |
2 |
1 |
4 |
|
Mid. Atlantic |
19 |
34 |
115 |
702 |
1,247 |
2 |
2 |
10 |
28 |
63 |
8 |
18 |
130 |
193 |
212 |
|
New Jersey |
— |
5 |
19 |
24 |
350 |
— |
0 |
2 |
2 |
20 |
— |
2 |
25 |
10 |
44 |
|
New York (Upstate) |
19 |
15 |
76 |
392 |
516 |
2 |
1 |
6 |
16 |
25 |
4 |
7 |
40 |
86 |
62 |
|
New York City |
— |
11 |
25 |
286 |
381 |
— |
0 |
4 |
10 |
18 |
— |
3 |
50 |
32 |
36 |
|
Pennsylvania |
N |
— |
— |
N |
N |
N |
0 |
0 |
N |
N |
4 |
6 |
26 |
65 |
70 |
|
E.N. Central |
23 |
47 |
82 |
1,123 |
1,750 |
2 |
3 |
9 |
62 |
96 |
5 |
16 |
102 |
182 |
191 |
|
Illinois |
N |
0 |
0 |
N |
N |
— |
1 |
2 |
13 |
24 |
— |
4 |
32 |
38 |
37 |
|
Indiana |
— |
9 |
23 |
196 |
370 |
— |
0 |
3 |
10 |
14 |
— |
2 |
6 |
23 |
23 |
|
Michigan |
1 |
11 |
21 |
250 |
417 |
— |
0 |
4 |
12 |
25 |
— |
3 |
21 |
20 |
38 |
|
Ohio |
20 |
19 |
38 |
502 |
710 |
2 |
1 |
4 |
21 |
23 |
5 |
6 |
66 |
97 |
79 |
|
Wisconsin |
2 |
7 |
16 |
175 |
253 |
— |
0 |
3 |
6 |
10 |
— |
2 |
12 |
4 |
14 |
|
W.N. Central |
4 |
16 |
37 |
307 |
582 |
— |
1 |
4 |
21 |
56 |
— |
3 |
16 |
41 |
43 |
|
Iowa |
N |
0 |
0 |
N |
N |
N |
0 |
0 |
N |
N |
— |
0 |
2 |
4 |
3 |
|
Kansas |
— |
2 |
9 |
65 |
86 |
N |
0 |
0 |
N |
N |
— |
0 |
3 |
4 |
2 |
|
Minnesota |
— |
6 |
18 |
109 |
306 |
— |
0 |
3 |
6 |
21 |
— |
1 |
3 |
16 |
11 |
|
Missouri |
N |
0 |
0 |
N |
N |
— |
0 |
2 |
9 |
22 |
— |
1 |
11 |
12 |
15 |
|
Nebraska |
— |
3 |
8 |
59 |
76 |
— |
0 |
2 |
5 |
7 |
— |
0 |
2 |
1 |
10 |
|
North Dakota |
— |
1 |
4 |
24 |
58 |
— |
0 |
1 |
1 |
6 |
— |
0 |
1 |
2 |
— |
|
South Dakota |
4 |
2 |
5 |
50 |
56 |
N |
0 |
0 |
N |
N |
— |
0 |
1 |
2 |
2 |
|
S. Atlantic |
29 |
57 |
133 |
1,601 |
2,053 |
— |
5 |
12 |
113 |
153 |
7 |
14 |
44 |
220 |
158 |
|
Delaware |
— |
0 |
5 |
18 |
17 |
— |
0 |
1 |
1 |
— |
— |
0 |
4 |
2 |
3 |
|
District of Columbia |
— |
1 |
6 |
28 |
42 |
— |
0 |
1 |
1 |
— |
N |
0 |
0 |
N |
N |
|
Florida |
13 |
17 |
45 |
549 |
608 |
— |
2 |
5 |
43 |
45 |
3 |
4 |
15 |
93 |
59 |
|
Georgia |
9 |
15 |
61 |
442 |
630 |
— |
1 |
5 |
24 |
47 |
— |
1 |
6 |
14 |
19 |
|
Maryland |
6 |
7 |
21 |
227 |
278 |
— |
0 |
4 |
14 |
19 |
2 |
3 |
14 |
38 |
28 |
|
North Carolina |
— |
0 |
0 |
— |
— |
N |
0 |
0 |
N |
N |
1 |
2 |
9 |
34 |
16 |
|
South Carolina |
1 |
7 |
27 |
228 |
255 |
— |
0 |
2 |
15 |
11 |
— |
0 |
3 |
14 |
6 |
|
Virginia |
— |
0 |
3 |
9 |
20 |
— |
0 |
3 |
9 |
20 |
1 |
2 |
9 |
19 |
24 |
|
West Virginia |
— |
4 |
14 |
100 |
203 |
— |
0 |
2 |
6 |
11 |
— |
0 |
4 |
6 |
3 |
|
E.S. Central |
10 |
24 |
51 |
691 |
832 |
1 |
2 |
6 |
47 |
50 |
1 |
4 |
13 |
61 |
44 |
|
Alabama |
1 |
3 |
10 |
107 |
100 |
— |
0 |
2 |
7 |
8 |
— |
0 |
10 |
11 |
8 |
|
Kentucky |
1 |
4 |
10 |
101 |
156 |
— |
0 |
2 |
7 |
7 |
— |
1 |
4 |
17 |
9 |
|
Mississippi |
— |
3 |
13 |
104 |
135 |
— |
0 |
2 |
9 |
11 |
— |
0 |
2 |
6 |
8 |
|
Tennessee |
8 |
15 |
28 |
379 |
441 |
1 |
1 |
4 |
24 |
24 |
1 |
1 |
7 |
27 |
19 |
|
W.S. Central |
20 |
35 |
305 |
997 |
1,173 |
3 |
4 |
20 |
88 |
80 |
5 |
4 |
28 |
68 |
67 |
|
Arkansas |
— |
4 |
30 |
93 |
115 |
— |
0 |
2 |
3 |
4 |
1 |
0 |
3 |
7 |
7 |
|
Louisiana |
1 |
6 |
23 |
192 |
193 |
— |
0 |
2 |
12 |
10 |
— |
0 |
2 |
10 |
11 |
|
Oklahoma |
— |
0 |
0 |
— |
— |
2 |
0 |
2 |
11 |
10 |
— |
0 |
4 |
3 |
— |
|
Texas |
19 |
26 |
263 |
712 |
865 |
1 |
2 |
18 |
62 |
56 |
4 |
3 |
23 |
48 |
49 |
|
Mountain |
6 |
30 |
82 |
868 |
1,169 |
— |
2 |
5 |
43 |
63 |
— |
3 |
9 |
38 |
61 |
|
Arizona |
6 |
11 |
40 |
411 |
481 |
— |
0 |
4 |
17 |
24 |
— |
1 |
5 |
10 |
26 |
|
Colorado |
— |
8 |
24 |
187 |
288 |
— |
0 |
1 |
7 |
14 |
— |
0 |
7 |
7 |
10 |
|
Idaho |
N |
0 |
0 |
N |
N |
— |
0 |
1 |
2 |
3 |
— |
0 |
2 |
5 |
3 |
|
Montana |
— |
0 |
4 |
18 |
16 |
— |
0 |
0 |
— |
1 |
— |
0 |
1 |
2 |
5 |
|
Nevada |
— |
2 |
7 |
59 |
70 |
— |
0 |
2 |
3 |
2 |
— |
0 |
3 |
3 |
5 |
|
New Mexico |
— |
5 |
16 |
156 |
198 |
— |
0 |
3 |
10 |
8 |
— |
0 |
2 |
— |
5 |
|
Utah |
— |
2 |
11 |
28 |
104 |
— |
0 |
2 |
3 |
11 |
— |
0 |
3 |
11 |
7 |
|
Wyoming |
— |
0 |
3 |
9 |
12 |
— |
0 |
1 |
1 |
— |
— |
0 |
0 |
— |
— |
|
Pacific |
2 |
3 |
8 |
86 |
84 |
— |
0 |
3 |
10 |
12 |
— |
4 |
12 |
72 |
102 |
|
Alaska |
2 |
2 |
5 |
39 |
48 |
— |
0 |
2 |
5 |
9 |
— |
0 |
1 |
1 |
— |
|
California |
N |
0 |
0 |
N |
N |
N |
0 |
0 |
N |
N |
— |
3 |
11 |
50 |
81 |
|
Hawaii |
— |
2 |
6 |
47 |
36 |
— |
0 |
2 |
5 |
3 |
— |
0 |
1 |
2 |
2 |
|
Oregon |
N |
0 |
0 |
N |
N |
N |
0 |
0 |
N |
N |
— |
0 |
2 |
9 |
9 |
|
Washington |
N |
0 |
0 |
N |
N |
N |
0 |
0 |
N |
N |
— |
0 |
6 |
10 |
10 |
|
Territories |
|||||||||||||||
|
American Samoa |
N |
— |
— |
N |
N |
— |
— |
— |
— |
— |
N |
— |
— |
N |
N |
|
C.N.M.I. |
— |
— |
— |
— |
— |
— |
— |
— |
— |
— |
— |
— |
— |
— |
— |
|
Guam |
— |
— |
— |
— |
— |
— |
— |
— |
— |
— |
— |
— |
— |
— |
— |
|
Puerto Rico |
— |
0 |
0 |
— |
— |
— |
0 |
0 |
— |
— |
— |
0 |
2 |
1 |
8 |
|
U.S. Virgin Islands |
— |
0 |
0 |
— |
— |
— |
0 |
0 |
— |
— |
— |
0 |
0 |
— |
— |
|
C.N.M.I.: Commonwealth of Northern Mariana Islands. U: Unavailable. —: No reported cases. N: Not reportable. NN: Not Nationally Notifiable. Cum: Cumulative year-to-date counts. Med: Median. Max: Maximum. * Case counts for reporting year 2013 and 2014 are provisional and subject to change. For further information on interpretation of these data, see http://wwwn.cdc.gov/nndss/document/ProvisionalNationaNotifiableDiseasesSurveillanceData20100927.pdf. Data for TB are displayed in Table IV, which appears quarterly. † Includes drug resistant and susceptible cases of Invasive Pneumococcal Disease. This condition was previously named Streptococcus pneumoniae invasive disease and cases were reported to CDC using different event codes to specify whether the cases were drug resistant or in a defined age group, such as <5 years. Since 2010, case notifications for this condition were consolidated under one event code for Invasive pneumococcal disease. |
|||||||||||||||
|
TABLE II. (Continued) Provisional cases of selected notifiable diseases, United States, weeks ending May 24, 2014, and May 25, 2013 (21st week)* (Export data) |
|||||||||||||||
|
Reporting area |
Lyme disease |
Malaria |
Meningococcal disease, invasive† All serogroups |
||||||||||||
|
Current week |
Previous 52 weeks |
Cum 2014 |
Cum 2013 |
Current week |
Previous 52 weeks |
Cum 2014 |
Cum 2013 |
Current week |
Previous 52 weeks |
Cum 2014 |
Cum 2013 |
||||
|
Med |
Max |
Med |
Max |
Med |
Max |
||||||||||
|
United States |
174 |
444 |
2,487 |
3,313 |
4,725 |
10 |
25 |
51 |
360 |
465 |
1 |
8 |
23 |
202 |
297 |
|
New England |
— |
129 |
1,003 |
713 |
1,614 |
— |
2 |
9 |
18 |
35 |
— |
0 |
3 |
9 |
12 |
|
Connecticut |
— |
20 |
252 |
134 |
512 |
— |
0 |
3 |
— |
8 |
— |
0 |
1 |
2 |
2 |
|
Maine |
— |
15 |
102 |
94 |
126 |
— |
0 |
2 |
3 |
1 |
— |
0 |
1 |
— |
2 |
|
Massachusetts |
— |
45 |
484 |
381 |
644 |
— |
1 |
4 |
10 |
22 |
— |
0 |
3 |
6 |
4 |
|
New Hampshire |
— |
12 |
164 |
2 |
195 |
— |
0 |
2 |
2 |
4 |
— |
0 |
0 |
— |
2 |
|
Rhode Island |
— |
8 |
54 |
52 |
80 |
— |
0 |
8 |
3 |
— |
— |
0 |
1 |
1 |
1 |
|
Vermont |
— |
8 |
103 |
50 |
57 |
— |
0 |
3 |
— |
— |
— |
0 |
1 |
— |
1 |
|
Mid. Atlantic |
165 |
179 |
907 |
2,068 |
1,854 |
1 |
8 |
21 |
96 |
108 |
— |
1 |
3 |
17 |
42 |
|
New Jersey |
— |
44 |
234 |
392 |
875 |
— |
1 |
6 |
14 |
29 |
— |
0 |
2 |
2 |
9 |
|
New York (Upstate) |
44 |
41 |
244 |
351 |
255 |
1 |
1 |
5 |
16 |
17 |
— |
0 |
3 |
4 |
11 |
|
New York City |
— |
9 |
441 |
475 |
106 |
— |
4 |
13 |
48 |
40 |
— |
0 |
2 |
6 |
8 |
|
Pennsylvania |
121 |
57 |
433 |
850 |
618 |
— |
1 |
5 |
18 |
22 |
— |
0 |
2 |
5 |
14 |
|
E.N. Central |
2 |
15 |
235 |
105 |
212 |
3 |
2 |
8 |
32 |
49 |
— |
1 |
4 |
20 |
33 |
|
Illinois |
— |
1 |
30 |
6 |
24 |
— |
1 |
5 |
6 |
19 |
— |
0 |
2 |
7 |
4 |
|
Indiana |
— |
0 |
14 |
— |
13 |
— |
0 |
2 |
4 |
7 |
— |
0 |
1 |
2 |
10 |
|
Michigan |
— |
2 |
16 |
11 |
8 |
— |
0 |
2 |
6 |
8 |
— |
0 |
1 |
3 |
3 |
|
Ohio |
— |
1 |
7 |
9 |
18 |
3 |
1 |
3 |
13 |
10 |
— |
0 |
2 |
5 |
6 |
|
Wisconsin |
2 |
11 |
196 |
79 |
149 |
— |
0 |
2 |
3 |
5 |
— |
0 |
1 |
3 |
10 |
|
W.N. Central |
— |
16 |
245 |
10 |
199 |
1 |
2 |
7 |
23 |
30 |
— |
0 |
3 |
13 |
24 |
|
Iowa |
— |
1 |
29 |
2 |
33 |
— |
0 |
2 |
4 |
3 |
— |
0 |
1 |
1 |
— |
|
Kansas |
— |
0 |
4 |
1 |
3 |
— |
0 |
2 |
6 |
4 |
— |
0 |
1 |
1 |
3 |
|
Minnesota |
— |
15 |
217 |
3 |
161 |
— |
1 |
5 |
2 |
19 |
— |
0 |
2 |
3 |
8 |
|
Missouri |
— |
0 |
3 |
1 |
2 |
1 |
0 |
1 |
6 |
1 |
— |
0 |
2 |
5 |
5 |
|
Nebraska |
— |
0 |
3 |
3 |
— |
— |
0 |
2 |
1 |
1 |
— |
0 |
1 |
— |
3 |
|
North Dakota |
— |
0 |
6 |
— |
— |
— |
0 |
1 |
3 |
1 |
— |
0 |
1 |
1 |
2 |
|
South Dakota |
— |
0 |
1 |
— |
— |
— |
0 |
3 |
1 |
1 |
— |
0 |
1 |
2 |
3 |
|
S. Atlantic |
7 |
46 |
308 |
355 |
753 |
5 |
7 |
18 |
110 |
132 |
1 |
1 |
6 |
50 |
56 |
|
Delaware |
3 |
8 |
24 |
87 |
137 |
— |
0 |
2 |
1 |
— |
— |
0 |
1 |
1 |
1 |
|
District of Columbia |
N |
0 |
0 |
N |
N |
— |
0 |
1 |
— |
6 |
— |
0 |
1 |
— |
1 |
|
Florida |
— |
2 |
14 |
24 |
25 |
1 |
1 |
3 |
14 |
23 |
— |
1 |
3 |
21 |
31 |
|
Georgia |
— |
0 |
2 |
2 |
3 |
— |
1 |
5 |
15 |
18 |
— |
0 |
2 |
7 |
6 |
|
Maryland |
2 |
18 |
81 |
109 |
357 |
2 |
2 |
10 |
50 |
53 |
1 |
0 |
1 |
5 |
2 |
|
North Carolina |
— |
0 |
32 |
17 |
15 |
— |
0 |
5 |
8 |
8 |
— |
0 |
3 |
11 |
7 |
|
South Carolina |
— |
0 |
5 |
2 |
4 |
— |
0 |
2 |
2 |
2 |
— |
0 |
1 |
1 |
2 |
|
Virginia |
2 |
15 |
267 |
99 |
181 |
2 |
1 |
6 |
20 |
21 |
— |
0 |
2 |
4 |
4 |
|
West Virginia |
— |
2 |
23 |
15 |
31 |
— |
0 |
1 |
— |
1 |
— |
0 |
0 |
— |
2 |
|
E.S. Central |
— |
1 |
9 |
24 |
17 |
— |
1 |
4 |
15 |
12 |
— |
0 |
2 |
7 |
6 |
|
Alabama |
— |
0 |
3 |
6 |
7 |
— |
0 |
1 |
4 |
2 |
— |
0 |
1 |
2 |
1 |
|
Kentucky |
— |
0 |
9 |
10 |
7 |
— |
0 |
2 |
5 |
4 |
— |
0 |
1 |
1 |
1 |
|
Mississippi |
— |
0 |
0 |
— |
— |
— |
0 |
1 |
— |
— |
— |
0 |
1 |
— |
2 |
|
Tennessee |
— |
0 |
4 |
8 |
3 |
— |
0 |
3 |
6 |
6 |
— |
0 |
1 |
4 |
2 |
|
W.S. Central |
— |
0 |
13 |
1 |
22 |
— |
1 |
21 |
17 |
27 |
— |
1 |
6 |
22 |
31 |
|
Arkansas |
— |
0 |
0 |
— |
— |
— |
0 |
1 |
2 |
1 |
— |
0 |
1 |
1 |
3 |
|
Louisiana |
— |
0 |
0 |
— |
— |
— |
0 |
1 |
2 |
3 |
— |
0 |
2 |
3 |
8 |
|
Oklahoma |
— |
0 |
2 |
— |
1 |
— |
0 |
3 |
1 |
2 |
— |
0 |
2 |
6 |
5 |
|
Texas |
— |
0 |
11 |
1 |
21 |
— |
1 |
19 |
12 |
21 |
— |
0 |
5 |
12 |
15 |
|
Mountain |
— |
1 |
9 |
11 |
15 |
— |
1 |
6 |
13 |
28 |
— |
0 |
2 |
12 |
23 |
|
Arizona |
— |
0 |
3 |
2 |
4 |
— |
0 |
3 |
7 |
11 |
— |
0 |
2 |
3 |
10 |
|
Colorado |
— |
0 |
0 |
— |
— |
— |
0 |
3 |
5 |
10 |
— |
0 |
1 |
1 |
4 |
|
Idaho |
— |
0 |
2 |
5 |
5 |
— |
0 |
1 |
— |
2 |
— |
0 |
1 |
2 |
3 |
|
Montana |
— |
0 |
3 |
1 |
3 |
— |
0 |
0 |
— |
— |
— |
0 |
1 |
2 |
— |
|
Nevada |
— |
0 |
1 |
1 |
1 |
— |
0 |
1 |
— |
3 |
— |
0 |
1 |
2 |
1 |
|
New Mexico |
— |
0 |
3 |
— |
— |
— |
0 |
1 |
— |
— |
— |
0 |
1 |
1 |
1 |
|
Utah |
— |
0 |
3 |
2 |
2 |
— |
0 |
2 |
1 |
2 |
— |
0 |
2 |
1 |
3 |
|
Wyoming |
— |
0 |
1 |
— |
— |
— |
0 |
0 |
— |
— |
— |
0 |
1 |
— |
1 |
|
Pacific |
— |
3 |
10 |
26 |
39 |
— |
3 |
9 |
36 |
44 |
— |
2 |
7 |
52 |
70 |
|
Alaska |
— |
0 |
2 |
4 |
1 |
— |
0 |
1 |
1 |
1 |
— |
0 |
0 |
— |
— |
|
California |
— |
0 |
8 |
— |
23 |
— |
2 |
5 |
22 |
33 |
— |
2 |
6 |
34 |
54 |
|
Hawaii |
N |
0 |
0 |
N |
N |
— |
0 |
0 |
— |
1 |
— |
0 |
1 |
1 |
1 |
|
Oregon |
— |
1 |
4 |
20 |
14 |
— |
0 |
1 |
2 |
2 |
— |
0 |
3 |
11 |
7 |
|
Washington |
— |
0 |
4 |
2 |
1 |
— |
0 |
3 |
11 |
7 |
— |
0 |
5 |
6 |
8 |
|
Territories |
|||||||||||||||
|
American Samoa |
N |
— |
— |
N |
N |
— |
— |
— |
— |
— |
— |
— |
— |
— |
— |
|
C.N.M.I. |
— |
— |
— |
— |
— |
— |
— |
— |
— |
— |
— |
— |
— |
— |
— |
|
Guam |
— |
— |
— |
— |
— |
— |
— |
— |
— |
— |
— |
— |
— |
— |
— |
|
Puerto Rico |
N |
0 |
0 |
N |
N |
— |
0 |
1 |
1 |
— |
— |
0 |
1 |
1 |
1 |
|
U.S. Virgin Islands |
N |
0 |
0 |
N |
N |
— |
0 |
0 |
— |
— |
— |
0 |
0 |
— |
— |
|
C.N.M.I.: Commonwealth of Northern Mariana Islands. U: Unavailable. —: No reported cases. N: Not reportable. NN: Not Nationally Notifiable. Cum: Cumulative year-to-date counts. Med: Median. Max: Maximum. * Case counts for reporting year 2013 and 2014 are provisional and subject to change. For further information on interpretation of these data, see http://wwwn.cdc.gov/nndss/document/ProvisionalNationaNotifiableDiseasesSurveillanceData20100927.pdf. Data for TB are displayed in Table IV, which appears quarterly. † Data for meningococcal disease, invasive caused by serogroups A, C, Y, and W-135; serogroup B; other serogroup; and unknown serogroup are available in Table I. |
|||||||||||||||
|
TABLE II. (Continued) Provisional cases of selected notifiable diseases, United States, weeks ending May 24, 2014, and May 25, 2013 (21st week)* (Export data) |
|||||||||||||||
|
Reporting area |
Mumps |
Pertussis |
Rabies, animal |
||||||||||||
|
Current week |
Previous 52 weeks |
Cum 2014 |
Cum 2013 |
Current week |
Previous 52 weeks |
Cum 2014 |
Cum 2013 |
Current week |
Previous 52 weeks |
Cum 2014 |
Cum 2013 |
||||
|
Med |
Max |
Med |
Max |
Med |
Max |
||||||||||
|
United States |
37 |
8 |
112 |
718 |
341 |
213 |
535 |
1,005 |
8,521 |
9,225 |
41 |
61 |
133 |
829 |
1,246 |
|
New England |
2 |
0 |
3 |
4 |
62 |
3 |
15 |
36 |
212 |
444 |
2 |
5 |
13 |
87 |
120 |
|
Connecticut |
— |
0 |
0 |
— |
4 |
— |
1 |
6 |
10 |
13 |
— |
3 |
12 |
43 |
49 |
|
Maine |
— |
0 |
0 |
— |
1 |
3 |
5 |
16 |
84 |
142 |
— |
1 |
3 |
9 |
23 |
|
Massachusetts |
2 |
0 |
3 |
4 |
56 |
— |
4 |
17 |
38 |
142 |
— |
0 |
0 |
— |
— |
|
New Hampshire |
— |
0 |
0 |
— |
1 |
— |
1 |
9 |
17 |
47 |
2 |
0 |
2 |
6 |
15 |
|
Rhode Island |
— |
0 |
1 |
— |
— |
— |
2 |
23 |
56 |
15 |
— |
0 |
4 |
10 |
9 |
|
Vermont |
— |
0 |
1 |
— |
— |
— |
0 |
7 |
7 |
85 |
— |
1 |
4 |
19 |
24 |
|
Mid. Atlantic |
— |
2 |
25 |
103 |
26 |
13 |
33 |
63 |
541 |
758 |
10 |
11 |
33 |
113 |
251 |
|
New Jersey |
— |
1 |
20 |
14 |
3 |
— |
6 |
12 |
67 |
190 |
— |
0 |
0 |
— |
— |
|
New York (Upstate) |
— |
0 |
2 |
2 |
1 |
7 |
14 |
40 |
251 |
259 |
10 |
6 |
19 |
113 |
113 |
|
New York City |
— |
1 |
24 |
83 |
10 |
— |
1 |
10 |
15 |
35 |
— |
0 |
5 |
— |
13 |
|
Pennsylvania |
— |
0 |
2 |
4 |
12 |
6 |
11 |
20 |
208 |
274 |
— |
5 |
12 |
— |
125 |
|
E.N. Central |
33 |
1 |
103 |
568 |
17 |
40 |
97 |
200 |
1,515 |
1,380 |
2 |
2 |
24 |
13 |
16 |
|
Illinois |
— |
1 |
14 |
93 |
8 |
— |
13 |
35 |
135 |
257 |
— |
1 |
6 |
5 |
6 |
|
Indiana |
— |
0 |
3 |
13 |
1 |
— |
11 |
29 |
92 |
100 |
— |
0 |
1 |
— |
1 |
|
Michigan |
1 |
0 |
1 |
5 |
2 |
8 |
20 |
44 |
314 |
202 |
1 |
0 |
5 |
3 |
4 |
|
Ohio |
32 |
0 |
95 |
425 |
6 |
32 |
27 |
104 |
703 |
347 |
1 |
0 |
19 |
5 |
5 |
|
Wisconsin |
— |
0 |
7 |
32 |
— |
— |
22 |
54 |
271 |
474 |
N |
0 |
0 |
N |
N |
|
W.N. Central |
— |
0 |
2 |
4 |
6 |
5 |
45 |
96 |
482 |
770 |
— |
3 |
11 |
31 |
93 |
|
Iowa |
— |
0 |
1 |
2 |
1 |
— |
4 |
13 |
45 |
142 |
— |
0 |
0 |
— |
— |
|
Kansas |
— |
0 |
0 |
— |
— |
— |
7 |
22 |
54 |
86 |
— |
1 |
4 |
14 |
29 |
|
Minnesota |
— |
0 |
1 |
1 |
2 |
— |
17 |
40 |
136 |
254 |
— |
0 |
4 |
— |
15 |
|
Missouri |
— |
0 |
2 |
1 |
2 |
5 |
9 |
33 |
145 |
184 |
— |
0 |
3 |
9 |
17 |
|
Nebraska |
— |
0 |
0 |
— |
— |
— |
4 |
15 |
71 |
72 |
— |
0 |
2 |
2 |
20 |
|
North Dakota |
— |
0 |
0 |
— |
1 |
— |
1 |
7 |
6 |
20 |
— |
0 |
0 |
— |
— |
|
South Dakota |
— |
0 |
0 |
— |
— |
— |
1 |
8 |
25 |
12 |
— |
0 |
2 |
6 |
12 |
|
S. Atlantic |
2 |
0 |
4 |
18 |
191 |
30 |
54 |
100 |
1,085 |
843 |
2 |
8 |
22 |
134 |
268 |
|
Delaware |
— |
0 |
0 |
— |
— |
1 |
1 |
34 |
186 |
19 |
— |
0 |
0 |
— |
— |
|
District of Columbia |
2 |
0 |
4 |
12 |
1 |
— |
0 |
4 |
10 |
19 |
— |
0 |
0 |
— |
— |
|
Florida |
— |
0 |
1 |
— |
— |
18 |
16 |
63 |
313 |
202 |
— |
0 |
20 |
37 |
103 |
|
Georgia |
— |
0 |
4 |
4 |
1 |
— |
5 |
18 |
122 |
143 |
— |
0 |
0 |
— |
— |
|
Maryland |
— |
0 |
1 |
— |
84 |
2 |
3 |
10 |
50 |
82 |
— |
6 |
17 |
77 |
136 |
|
North Carolina |
— |
0 |
1 |
— |
1 |
8 |
11 |
29 |
243 |
184 |
— |
0 |
0 |
— |
— |
|
South Carolina |
— |
0 |
1 |
— |
1 |
— |
3 |
9 |
28 |
77 |
— |
0 |
0 |
— |
— |
|
Virginia |
— |
0 |
2 |
2 |
103 |
1 |
7 |
30 |
125 |
112 |
— |
0 |
0 |
— |
— |
|
West Virginia |
— |
0 |
0 |
— |
— |
— |
0 |
3 |
8 |
5 |
2 |
1 |
6 |
20 |
29 |
|
E.S. Central |
— |
0 |
3 |
5 |
5 |
4 |
16 |
40 |
308 |
297 |
— |
1 |
4 |
18 |
18 |
|
Alabama |
— |
0 |
1 |
1 |
1 |
— |
3 |
8 |
60 |
64 |
— |
1 |
4 |
15 |
13 |
|
Kentucky |
— |
0 |
0 |
— |
2 |
— |
7 |
28 |
114 |
119 |
— |
0 |
3 |
3 |
4 |
|
Mississippi |
— |
0 |
0 |
— |
— |
— |
1 |
4 |
29 |
25 |
— |
0 |
1 |
— |
1 |
|
Tennessee |
— |
0 |
3 |
4 |
2 |
4 |
5 |
10 |
105 |
89 |
— |
0 |
0 |
— |
— |
|
W.S. Central |
— |
0 |
3 |
7 |
9 |
61 |
89 |
498 |
955 |
956 |
25 |
22 |
78 |
428 |
401 |
|
Arkansas |
— |
0 |
1 |
1 |
2 |
2 |
9 |
30 |
107 |
132 |
— |
1 |
23 |
84 |
92 |
|
Louisiana |
— |
0 |
1 |
— |
1 |
— |
3 |
11 |
22 |
58 |
— |
0 |
1 |
— |
2 |
|
Oklahoma |
— |
0 |
1 |
2 |
— |
32 |
0 |
112 |
41 |
16 |
— |
0 |
31 |
46 |
22 |
|
Texas |
— |
0 |
3 |
4 |
6 |
27 |
71 |
352 |
785 |
750 |
25 |
18 |
72 |
298 |
285 |
|
Mountain |
— |
0 |
2 |
4 |
4 |
18 |
101 |
143 |
1,465 |
2,555 |
— |
0 |
11 |
3 |
12 |
|
Arizona |
— |
0 |
1 |
3 |
— |
7 |
13 |
58 |
101 |
772 |
N |
0 |
0 |
N |
N |
|
Colorado |
— |
0 |
1 |
1 |
1 |
— |
26 |
63 |
491 |
552 |
— |
0 |
0 |
— |
— |
|
Idaho |
— |
0 |
0 |
— |
— |
8 |
5 |
23 |
158 |
76 |
— |
0 |
4 |
— |
1 |
|
Montana |
— |
0 |
0 |
— |
— |
3 |
8 |
25 |
140 |
316 |
N |
0 |
0 |
N |
N |
|
Nevada |
— |
0 |
2 |
— |
1 |
— |
3 |
12 |
45 |
47 |
— |
0 |
3 |
2 |
4 |
|
New Mexico |
— |
0 |
1 |
— |
— |
— |
9 |
24 |
110 |
254 |
— |
0 |
1 |
— |
4 |
|
Utah |
— |
0 |
0 |
— |
2 |
— |
22 |
42 |
394 |
524 |
— |
0 |
4 |
1 |
— |
|
Wyoming |
— |
0 |
0 |
— |
— |
— |
1 |
12 |
26 |
14 |
— |
0 |
2 |
— |
3 |
|
Pacific |
— |
0 |
2 |
5 |
21 |
39 |
73 |
159 |
1,958 |
1,222 |
— |
2 |
13 |
2 |
67 |
|
Alaska |
— |
0 |
0 |
— |
— |
— |
2 |
10 |
18 |
197 |
— |
0 |
1 |
2 |
7 |
|
California |
— |
0 |
2 |
4 |
18 |
30 |
50 |
139 |
1,667 |
552 |
— |
2 |
12 |
— |
58 |
|
Hawaii |
— |
0 |
0 |
— |
— |
— |
1 |
4 |
11 |
16 |
— |
0 |
0 |
— |
— |
|
Oregon |
— |
0 |
1 |
1 |
2 |
2 |
8 |
26 |
147 |
169 |
— |
0 |
2 |
— |
2 |
|
Washington |
— |
0 |
1 |
— |
1 |
7 |
12 |
50 |
115 |
288 |
— |
0 |
12 |
— |
— |
|
Territories |
|||||||||||||||
|
American Samoa |
— |
— |
— |
— |
— |
— |
— |
— |
— |
— |
N |
— |
— |
N |
N |
|
C.N.M.I. |
— |
— |
— |
— |
— |
— |
— |
— |
— |
— |
— |
— |
— |
— |
— |
|
Guam |
— |
— |
— |
— |
— |
— |
— |
— |
— |
— |
— |
— |
— |
— |
— |
|
Puerto Rico |
— |
0 |
1 |
— |
2 |
— |
0 |
6 |
6 |
7 |
— |
0 |
4 |
13 |
32 |
|
U.S. Virgin Islands |
— |
0 |
0 |
— |
— |
— |
0 |
0 |
— |
— |
— |
0 |
0 |
— |
— |
|
C.N.M.I.: Commonwealth of Northern Mariana Islands. U: Unavailable. —: No reported cases. N: Not reportable. NN: Not Nationally Notifiable. Cum: Cumulative year-to-date counts. Med: Median. Max: Maximum. * Case counts for reporting year 2013 and 2014 are provisional and subject to change. For further information on interpretation of these data, see http://wwwn.cdc.gov/nndss/document/ProvisionalNationaNotifiableDiseasesSurveillanceData20100927.pdf. Data for TB are displayed in Table IV, which appears quarterly. |
|||||||||||||||
|
TABLE II. (Continued) Provisional cases of selected notifiable diseases, United States, weeks ending May 24, 2014, and May 25, 2013 (21st week)* (Export data) |
|||||||||||||||
|
Reporting area |
Salmonellosis |
Shiga toxin-producing E. coli (STEC)† |
Shigellosis |
||||||||||||
|
Current week |
Previous 52 weeks |
Cum 2014 |
Cum 2013 |
Current week |
Previous 52 weeks |
Cum 2014 |
Cum 2013 |
Current week |
Previous 52 weeks |
Cum 2014 |
Cum 2013 |
||||
|
Med |
Max |
Med |
Max |
Med |
Max |
||||||||||
|
United States |
410 |
953 |
1,620 |
10,761 |
13,139 |
18 |
101 |
297 |
1,117 |
1,744 |
231 |
267 |
726 |
4,862 |
3,161 |
|
New England |
6 |
32 |
79 |
524 |
674 |
— |
4 |
13 |
49 |
69 |
— |
5 |
94 |
91 |
63 |
|
Connecticut |
1 |
7 |
21 |
118 |
124 |
— |
1 |
7 |
12 |
18 |
— |
1 |
5 |
12 |
16 |
|
Maine |
1 |
2 |
6 |
40 |
51 |
— |
0 |
3 |
4 |
8 |
— |
0 |
1 |
5 |
2 |
|
Massachusetts |
2 |
17 |
56 |
254 |
392 |
— |
2 |
8 |
22 |
24 |
— |
3 |
11 |
59 |
34 |
|
New Hampshire |
— |
4 |
12 |
50 |
47 |
— |
0 |
3 |
4 |
12 |
— |
0 |
1 |
6 |
3 |
|
Rhode Island |
1 |
1 |
13 |
30 |
31 |
— |
0 |
2 |
1 |
— |
— |
0 |
86 |
8 |
5 |
|
Vermont |
1 |
1 |
6 |
32 |
29 |
— |
0 |
3 |
6 |
7 |
— |
0 |
1 |
1 |
3 |
|
Mid. Atlantic |
41 |
76 |
195 |
1,052 |
1,452 |
3 |
11 |
34 |
107 |
174 |
2 |
15 |
37 |
232 |
302 |
|
New Jersey |
— |
14 |
46 |
149 |
278 |
— |
2 |
8 |
18 |
43 |
— |
2 |
7 |
20 |
42 |
|
New York (Upstate) |
20 |
25 |
76 |
336 |
337 |
3 |
4 |
10 |
37 |
54 |
1 |
4 |
29 |
74 |
108 |
|
New York City |
— |
20 |
50 |
276 |
333 |
— |
1 |
5 |
19 |
29 |
— |
6 |
13 |
99 |
113 |
|
Pennsylvania |
21 |
23 |
63 |
291 |
504 |
— |
5 |
17 |
33 |
48 |
1 |
2 |
9 |
39 |
39 |
|
E.N. Central |
29 |
90 |
173 |
1,228 |
1,712 |
1 |
13 |
49 |
131 |
291 |
27 |
21 |
40 |
435 |
656 |
|
Illinois |
— |
26 |
65 |
329 |
545 |
— |
4 |
32 |
29 |
71 |
— |
5 |
15 |
39 |
90 |
|
Indiana |
— |
11 |
27 |
118 |
216 |
— |
1 |
7 |
12 |
32 |
— |
2 |
25 |
126 |
31 |
|
Michigan |
1 |
17 |
42 |
225 |
319 |
— |
3 |
14 |
37 |
56 |
4 |
2 |
8 |
39 |
78 |
|
Ohio |
28 |
23 |
42 |
385 |
357 |
1 |
3 |
15 |
50 |
64 |
20 |
8 |
21 |
185 |
441 |
|
Wisconsin |
— |
13 |
41 |
171 |
275 |
— |
2 |
13 |
3 |
68 |
3 |
1 |
7 |
46 |
16 |
|
W.N. Central |
17 |
45 |
120 |
474 |
1,018 |
— |
12 |
49 |
101 |
279 |
19 |
20 |
80 |
541 |
153 |
|
Iowa |
1 |
9 |
36 |
117 |
171 |
— |
2 |
15 |
16 |
38 |
— |
4 |
45 |
96 |
30 |
|
Kansas |
— |
7 |
18 |
86 |
135 |
— |
1 |
6 |
18 |
29 |
— |
0 |
4 |
9 |
13 |
|
Minnesota |
— |
12 |
54 |
— |
253 |
— |
3 |
17 |
— |
89 |
— |
1 |
6 |
— |
57 |
|
Missouri |
16 |
14 |
38 |
174 |
264 |
— |
4 |
15 |
40 |
86 |
19 |
2 |
20 |
125 |
18 |
|
Nebraska |
— |
4 |
20 |
32 |
88 |
— |
2 |
7 |
13 |
18 |
— |
1 |
5 |
15 |
25 |
|
North Dakota |
— |
1 |
7 |
22 |
38 |
— |
1 |
3 |
8 |
11 |
— |
0 |
2 |
10 |
7 |
|
South Dakota |
— |
3 |
10 |
43 |
69 |
— |
0 |
5 |
6 |
8 |
— |
6 |
32 |
286 |
3 |
|
S. Atlantic |
163 |
249 |
478 |
3,032 |
2,997 |
1 |
9 |
19 |
143 |
185 |
96 |
64 |
163 |
1,719 |
583 |
|
Delaware |
— |
2 |
8 |
18 |
20 |
— |
0 |
2 |
1 |
3 |
— |
0 |
4 |
22 |
2 |
|
District of Columbia |
— |
1 |
3 |
9 |
23 |
— |
0 |
1 |
2 |
3 |
— |
0 |
4 |
9 |
6 |
|
Florida |
119 |
111 |
228 |
1,465 |
1,398 |
1 |
3 |
6 |
46 |
48 |
72 |
28 |
96 |
974 |
198 |
|
Georgia |
18 |
34 |
100 |
387 |
434 |
— |
2 |
7 |
36 |
50 |
14 |
18 |
34 |
309 |
241 |
|
Maryland |
9 |
15 |
37 |
205 |
234 |
— |
1 |
8 |
19 |
20 |
4 |
3 |
8 |
72 |
25 |
|
North Carolina |
8 |
35 |
136 |
485 |
346 |
— |
1 |
6 |
16 |
21 |
3 |
4 |
119 |
250 |
51 |
|
South Carolina |
4 |
20 |
60 |
210 |
210 |
— |
0 |
1 |
2 |
2 |
1 |
2 |
6 |
36 |
35 |
|
Virginia |
5 |
18 |
41 |
223 |
264 |
— |
2 |
8 |
17 |
26 |
2 |
2 |
8 |
46 |
24 |
|
West Virginia |
— |
2 |
9 |
30 |
68 |
— |
0 |
3 |
4 |
12 |
— |
0 |
2 |
1 |
1 |
|
E.S. Central |
5 |
61 |
150 |
759 |
746 |
— |
5 |
19 |
57 |
99 |
22 |
27 |
66 |
510 |
208 |
|
Alabama |
1 |
19 |
80 |
261 |
207 |
— |
0 |
4 |
7 |
25 |
— |
6 |
14 |
96 |
78 |
|
Kentucky |
— |
9 |
21 |
144 |
148 |
— |
1 |
9 |
14 |
26 |
— |
1 |
6 |
22 |
24 |
|
Mississippi |
— |
12 |
40 |
132 |
169 |
— |
0 |
4 |
6 |
9 |
1 |
5 |
12 |
85 |
55 |
|
Tennessee |
4 |
16 |
36 |
222 |
222 |
— |
2 |
7 |
30 |
39 |
21 |
14 |
50 |
307 |
51 |
|
W.S. Central |
94 |
130 |
724 |
1,229 |
1,590 |
7 |
16 |
50 |
270 |
200 |
54 |
62 |
463 |
790 |
741 |
|
Arkansas |
12 |
13 |
36 |
105 |
116 |
— |
2 |
6 |
36 |
19 |
26 |
7 |
23 |
203 |
64 |
|
Louisiana |
5 |
23 |
47 |
195 |
310 |
— |
0 |
3 |
5 |
4 |
— |
8 |
29 |
64 |
97 |
|
Oklahoma |
14 |
12 |
151 |
173 |
185 |
5 |
2 |
10 |
27 |
21 |
— |
2 |
41 |
16 |
68 |
|
Texas |
63 |
78 |
543 |
756 |
979 |
2 |
12 |
40 |
202 |
156 |
28 |
37 |
393 |
507 |
512 |
|
Mountain |
6 |
53 |
260 |
707 |
912 |
— |
9 |
69 |
92 |
177 |
— |
13 |
43 |
180 |
137 |
|
Arizona |
— |
17 |
34 |
218 |
303 |
— |
2 |
45 |
15 |
48 |
— |
7 |
29 |
77 |
78 |
|
Colorado |
— |
11 |
35 |
157 |
201 |
— |
2 |
11 |
7 |
51 |
— |
1 |
12 |
19 |
21 |
|
Idaho |
4 |
3 |
9 |
47 |
39 |
— |
2 |
6 |
22 |
20 |
— |
0 |
3 |
4 |
2 |
|
Montana |
— |
2 |
5 |
44 |
36 |
— |
1 |
5 |
10 |
12 |
— |
1 |
10 |
6 |
2 |
|
Nevada |
— |
3 |
205 |
31 |
74 |
— |
1 |
8 |
11 |
12 |
— |
0 |
7 |
8 |
13 |
|
New Mexico |
— |
5 |
19 |
60 |
124 |
— |
0 |
3 |
11 |
9 |
— |
1 |
5 |
11 |
11 |
|
Utah |
2 |
6 |
16 |
141 |
115 |
— |
1 |
9 |
15 |
21 |
— |
1 |
2 |
13 |
9 |
|
Wyoming |
— |
1 |
7 |
9 |
20 |
— |
0 |
8 |
1 |
4 |
— |
0 |
6 |
42 |
1 |
|
Pacific |
49 |
120 |
222 |
1,756 |
2,038 |
6 |
16 |
55 |
167 |
270 |
11 |
23 |
49 |
364 |
318 |
|
Alaska |
2 |
1 |
7 |
32 |
26 |
— |
0 |
0 |
— |
— |
— |
0 |
1 |
3 |
1 |
|
California |
29 |
88 |
175 |
1,382 |
1,604 |
— |
8 |
36 |
99 |
186 |
8 |
19 |
49 |
277 |
247 |
|
Hawaii |
— |
6 |
13 |
89 |
107 |
— |
0 |
2 |
2 |
14 |
— |
0 |
2 |
9 |
23 |
|
Oregon |
1 |
6 |
25 |
103 |
115 |
1 |
2 |
14 |
30 |
34 |
— |
1 |
5 |
17 |
20 |
|
Washington |
17 |
10 |
47 |
150 |
186 |
5 |
6 |
31 |
36 |
36 |
3 |
2 |
12 |
58 |
27 |
|
Territories |
|||||||||||||||
|
American Samoa |
— |
— |
— |
— |
— |
— |
— |
— |
— |
— |
— |
— |
— |
— |
— |
|
C.N.M.I. |
— |
— |
— |
— |
— |
— |
— |
— |
— |
— |
— |
— |
— |
— |
— |
|
Guam |
— |
— |
— |
— |
— |
— |
— |
— |
— |
— |
— |
— |
— |
— |
— |
|
Puerto Rico |
— |
9 |
47 |
98 |
176 |
— |
0 |
2 |
4 |
2 |
— |
0 |
1 |
1 |
— |
|
U.S. Virgin Islands |
— |
0 |
0 |
— |
— |
— |
0 |
0 |
— |
— |
— |
0 |
0 |
— |
— |
|
C.N.M.I.: Commonwealth of Northern Mariana Islands. U: Unavailable. —: No reported cases. N: Not reportable. NN: Not Nationally Notifiable. Cum: Cumulative year-to-date counts. Med: Median. Max: Maximum. * Case counts for reporting year 2013 and 2014 are provisional and subject to change. For further information on interpretation of these data, see http://wwwn.cdc.gov/nndss/document/ProvisionalNationaNotifiableDiseasesSurveillanceData20100927.pdf. Data for TB are displayed in Table IV, which appears quarterly. † Includes E. coli O157:H7; Shiga toxin-positive, serogroup non-O157; and Shiga toxin-positive, not serogrouped. |
|||||||||||||||
|
TABLE II. (Continued) Provisional cases of selected notifiable diseases, United States, weeks ending May 24, 2014, and May 25, 2013 (21st week)* (Export data) |
|||||||||||||||
|---|---|---|---|---|---|---|---|---|---|---|---|---|---|---|---|
|
Reporting area |
Spotted Fever Rickettsiosis (including RMSF)† |
Syphilis, primary and secondary |
|||||||||||||
|
Confirmed |
Probable |
||||||||||||||
|
Current week |
Previous 52 weeks |
Cum 2014 |
Cum 2013 |
Current week |
Previous 52 weeks |
Cum 2014 |
Cum 2013 |
Current week |
Previous 52 weeks |
Cum 2014 |
Cum 2013 |
||||
|
Med |
Max |
Med |
Max |
Med |
Max |
||||||||||
|
United States |
— |
3 |
10 |
23 |
34 |
20 |
47 |
211 |
395 |
378 |
91 |
337 |
478 |
6,020 |
6,625 |
|
New England |
— |
0 |
1 |
— |
— |
— |
0 |
1 |
3 |
5 |
— |
10 |
19 |
185 |
211 |
|
Connecticut |
— |
0 |
0 |
— |
— |
— |
0 |
0 |
— |
— |
— |
1 |
5 |
31 |
30 |
|
Maine |
— |
0 |
0 |
— |
— |
— |
0 |
1 |
1 |
1 |
— |
0 |
4 |
6 |
4 |
|
Massachusetts |
— |
0 |
0 |
— |
— |
— |
0 |
1 |
1 |
— |
— |
7 |
14 |
121 |
150 |
|
New Hampshire |
— |
0 |
1 |
— |
— |
— |
0 |
1 |
1 |
2 |
— |
0 |
2 |
9 |
11 |
|
Rhode Island |
— |
0 |
0 |
— |
— |
— |
0 |
0 |
— |
2 |
— |
0 |
5 |
17 |
15 |
|
Vermont |
— |
0 |
0 |
— |
— |
— |
0 |
0 |
— |
— |
— |
0 |
1 |
1 |
1 |
|
Mid. Atlantic |
— |
0 |
1 |
2 |
1 |
— |
1 |
7 |
14 |
19 |
11 |
41 |
73 |
802 |
862 |
|
New Jersey |
— |
0 |
1 |
— |
1 |
— |
0 |
4 |
7 |
14 |
— |
4 |
9 |
78 |
99 |
|
New York (Upstate) |
— |
0 |
1 |
1 |
— |
— |
0 |
6 |
5 |
2 |
7 |
5 |
48 |
136 |
107 |
|
New York City |
— |
0 |
1 |
— |
— |
— |
0 |
1 |
— |
— |
3 |
22 |
34 |
441 |
478 |
|
Pennsylvania |
— |
0 |
1 |
1 |
— |
— |
0 |
3 |
2 |
3 |
1 |
8 |
15 |
147 |
178 |
|
E.N. Central |
— |
0 |
1 |
1 |
— |
1 |
1 |
14 |
13 |
24 |
5 |
34 |
53 |
459 |
828 |
|
Illinois |
— |
0 |
1 |
— |
— |
— |
1 |
8 |
6 |
12 |
5 |
12 |
27 |
162 |
359 |
|
Indiana |
— |
0 |
1 |
1 |
— |
— |
0 |
3 |
1 |
5 |
— |
3 |
8 |
62 |
100 |
|
Michigan |
— |
0 |
0 |
— |
— |
— |
0 |
1 |
1 |
— |
— |
8 |
17 |
61 |
172 |
|
Ohio |
— |
0 |
1 |
— |
— |
1 |
0 |
2 |
5 |
5 |
— |
8 |
17 |
150 |
168 |
|
Wisconsin |
— |
0 |
1 |
— |
— |
— |
0 |
2 |
— |
2 |
— |
2 |
5 |
24 |
29 |
|
W.N. Central |
— |
0 |
2 |
2 |
— |
3 |
3 |
26 |
29 |
32 |
— |
15 |
30 |
295 |
235 |
|
Iowa |
— |
0 |
0 |
— |
— |
— |
0 |
2 |
— |
1 |
— |
2 |
7 |
30 |
33 |
|
Kansas |
— |
0 |
0 |
— |
— |
— |
0 |
0 |
— |
— |
— |
1 |
4 |
17 |
13 |
|
Minnesota |
— |
0 |
1 |
— |
— |
— |
0 |
3 |
— |
5 |
— |
4 |
10 |
90 |
64 |
|
Missouri |
— |
0 |
2 |
2 |
— |
3 |
3 |
25 |
29 |
26 |
— |
6 |
10 |
110 |
91 |
|
Nebraska |
— |
0 |
1 |
— |
— |
— |
0 |
2 |
— |
— |
— |
1 |
3 |
19 |
19 |
|
North Dakota |
— |
0 |
0 |
— |
— |
— |
0 |
1 |
— |
— |
— |
0 |
2 |
3 |
6 |
|
South Dakota |
— |
0 |
1 |
— |
— |
— |
0 |
1 |
— |
— |
— |
1 |
6 |
26 |
9 |
|
S. Atlantic |
— |
1 |
8 |
17 |
28 |
3 |
14 |
70 |
104 |
82 |
46 |
83 |
215 |
1,619 |
1,380 |
|
Delaware |
— |
0 |
0 |
— |
— |
— |
0 |
2 |
4 |
5 |
— |
1 |
9 |
12 |
7 |
|
District of Columbia |
— |
0 |
0 |
— |
2 |
— |
0 |
0 |
— |
— |
— |
1 |
8 |
— |
79 |
|
Florida |
— |
0 |
2 |
— |
1 |
2 |
0 |
3 |
13 |
5 |
4 |
29 |
45 |
606 |
553 |
|
Georgia |
— |
1 |
7 |
16 |
24 |
— |
0 |
0 |
— |
— |
26 |
21 |
151 |
422 |
252 |
|
Maryland |
— |
0 |
0 |
— |
— |
— |
0 |
2 |
4 |
— |
— |
9 |
16 |
157 |
163 |
|
North Carolina |
— |
0 |
2 |
— |
— |
— |
3 |
47 |
45 |
18 |
13 |
10 |
29 |
210 |
74 |
|
South Carolina |
— |
0 |
1 |
— |
— |
— |
1 |
5 |
4 |
10 |
— |
4 |
13 |
85 |
114 |
|
Virginia |
— |
0 |
2 |
1 |
1 |
1 |
4 |
22 |
33 |
44 |
3 |
5 |
18 |
114 |
130 |
|
West Virginia |
— |
0 |
1 |
— |
— |
— |
0 |
2 |
1 |
— |
— |
0 |
2 |
13 |
8 |
|
E.S. Central |
— |
0 |
2 |
1 |
1 |
6 |
12 |
52 |
100 |
133 |
1 |
11 |
29 |
211 |
246 |
|
Alabama |
— |
0 |
1 |
— |
— |
— |
3 |
19 |
28 |
24 |
— |
3 |
8 |
46 |
67 |
|
Kentucky |
— |
0 |
1 |
— |
— |
1 |
0 |
6 |
4 |
13 |
1 |
2 |
8 |
49 |
49 |
|
Mississippi |
— |
0 |
1 |
1 |
— |
— |
0 |
4 |
1 |
8 |
— |
1 |
26 |
64 |
36 |
|
Tennessee |
— |
0 |
2 |
— |
1 |
5 |
6 |
33 |
67 |
88 |
— |
4 |
8 |
52 |
94 |
|
W.S. Central |
— |
0 |
4 |
— |
2 |
7 |
12 |
123 |
124 |
55 |
1 |
40 |
69 |
702 |
865 |
|
Arkansas |
— |
0 |
2 |
— |
1 |
7 |
8 |
35 |
82 |
23 |
1 |
3 |
8 |
37 |
64 |
|
Louisiana |
— |
0 |
0 |
— |
— |
— |
0 |
1 |
3 |
— |
— |
8 |
22 |
144 |
134 |
|
Oklahoma |
— |
0 |
4 |
— |
— |
— |
0 |
87 |
1 |
21 |
— |
2 |
9 |
40 |
41 |
|
Texas |
— |
0 |
0 |
— |
1 |
— |
2 |
16 |
38 |
11 |
— |
27 |
41 |
481 |
626 |
|
Mountain |
— |
0 |
1 |
— |
2 |
— |
1 |
4 |
6 |
26 |
— |
17 |
26 |
321 |
303 |
|
Arizona |
— |
0 |
1 |
— |
2 |
— |
1 |
3 |
5 |
23 |
— |
6 |
12 |
130 |
98 |
|
Colorado |
— |
0 |
0 |
— |
— |
— |
0 |
1 |
— |
2 |
— |
3 |
9 |
44 |
67 |
|
Idaho |
— |
0 |
1 |
— |
— |
— |
0 |
0 |
— |
— |
— |
0 |
2 |
3 |
7 |
|
Montana |
— |
0 |
0 |
— |
— |
— |
0 |
1 |
— |
— |
— |
0 |
1 |
2 |
3 |
|
Nevada |
— |
0 |
0 |
— |
— |
— |
0 |
1 |
— |
— |
— |
5 |
14 |
105 |
59 |
|
New Mexico |
— |
0 |
1 |
— |
— |
— |
0 |
1 |
1 |
1 |
— |
1 |
5 |
30 |
35 |
|
Utah |
— |
0 |
0 |
— |
— |
— |
0 |
1 |
— |
— |
— |
1 |
5 |
7 |
33 |
|
Wyoming |
— |
0 |
0 |
— |
— |
— |
0 |
1 |
— |
— |
— |
0 |
0 |
— |
1 |
|
Pacific |
— |
0 |
1 |
— |
— |
— |
0 |
2 |
2 |
2 |
27 |
80 |
112 |
1,426 |
1,695 |
|
Alaska |
N |
0 |
0 |
N |
N |
N |
0 |
0 |
N |
N |
— |
0 |
3 |
8 |
7 |
|
California |
— |
0 |
1 |
— |
— |
— |
0 |
2 |
— |
2 |
22 |
68 |
88 |
1,246 |
1,468 |
|
Hawaii |
N |
0 |
0 |
N |
N |
N |
0 |
0 |
N |
N |
— |
1 |
5 |
19 |
12 |
|
Oregon |
— |
0 |
1 |
— |
— |
— |
0 |
1 |
2 |
— |
— |
5 |
11 |
91 |
113 |
|
Washington |
— |
0 |
0 |
— |
— |
— |
0 |
2 |
— |
— |
5 |
4 |
14 |
62 |
95 |
|
Territories |
|||||||||||||||
|
American Samoa |
N |
— |
— |
N |
N |
N |
— |
— |
N |
N |
— |
— |
— |
— |
— |
|
C.N.M.I. |
— |
— |
— |
— |
— |
— |
— |
— |
— |
— |
— |
— |
— |
— |
— |
|
Guam |
N |
— |
— |
N |
N |
N |
— |
— |
N |
N |
— |
— |
— |
— |
— |
|
Puerto Rico |
N |
0 |
0 |
N |
N |
N |
0 |
0 |
N |
N |
— |
6 |
30 |
145 |
161 |
|
U.S. Virgin Islands |
N |
0 |
0 |
N |
N |
N |
0 |
0 |
N |
N |
— |
0 |
1 |
— |
1 |
|
C.N.M.I.: Commonwealth of Northern Mariana Islands. U: Unavailable. —: No reported cases. N: Not reportable. NN: Not Nationally Notifiable. Cum: Cumulative year-to-date counts. Med: Median. Max: Maximum. * Case counts for reporting year 2013 and 2014 are provisional and subject to change. For further information on interpretation of these data, see http://wwwn.cdc.gov/nndss/document/ProvisionalNationaNotifiableDiseasesSurveillanceData20100927.pdf. Data for TB are displayed in Table IV, which appears quarterly. † Illnesses with similar clinical presentation that result from Spotted fever group rickettsia infections are reported as Spotted fever rickettsioses. Rocky Mountain spotted fever (RMSF) caused by Rickettsia rickettsii, is the most common and well-known spotted fever. |
|||||||||||||||
|
TABLE II. (Continued) Provisional cases of selected notifiable diseases, United States, weeks ending May 24, 2014, and May 25, 2013 (21st week)* (Export data) |
|||||||||||||||
|---|---|---|---|---|---|---|---|---|---|---|---|---|---|---|---|
|
Reporting area |
Varicella (chickenpox) |
West Nile virus disease† |
|||||||||||||
|
Neuroinvasive |
Nonneuroinvasive§ |
||||||||||||||
|
Current week |
Previous 52 weeks |
Cum 2014 |
Cum 2013 |
Current week |
Previous 52 weeks |
Cum 2014 |
Cum 2013 |
Current week |
Previous 52 weeks |
Cum 2014 |
Cum 2013 |
||||
|
Med |
Max |
Med |
Max |
Med |
Max |
||||||||||
|
United States |
116 |
181 |
294 |
3,304 |
5,011 |
— |
1 |
164 |
2 |
6 |
— |
1 |
164 |
— |
7 |
|
New England |
10 |
19 |
49 |
326 |
422 |
— |
0 |
3 |
— |
— |
— |
0 |
2 |
— |
— |
|
Connecticut |
1 |
4 |
9 |
63 |
88 |
— |
0 |
1 |
— |
— |
— |
0 |
1 |
— |
— |
|
Maine |
2 |
2 |
7 |
55 |
69 |
— |
0 |
0 |
— |
— |
— |
0 |
0 |
— |
— |
|
Massachusetts |
2 |
9 |
20 |
135 |
196 |
— |
0 |
2 |
— |
— |
— |
0 |
1 |
— |
— |
|
New Hampshire |
— |
0 |
8 |
— |
30 |
— |
0 |
1 |
— |
— |
— |
0 |
0 |
— |
— |
|
Rhode Island |
— |
0 |
5 |
10 |
10 |
— |
0 |
1 |
— |
— |
— |
0 |
0 |
— |
— |
|
Vermont |
5 |
1 |
27 |
63 |
29 |
— |
0 |
1 |
— |
— |
— |
0 |
1 |
— |
— |
|
Mid. Atlantic |
20 |
19 |
39 |
372 |
563 |
— |
0 |
7 |
— |
1 |
— |
0 |
6 |
— |
— |
|
New Jersey |
— |
4 |
21 |
58 |
205 |
— |
0 |
4 |
— |
— |
— |
0 |
2 |
— |
— |
|
New York (Upstate) |
N |
0 |
0 |
N |
N |
— |
0 |
2 |
— |
— |
— |
0 |
4 |
— |
— |
|
New York City |
— |
0 |
0 |
— |
— |
— |
0 |
2 |
— |
— |
— |
0 |
1 |
— |
— |
|
Pennsylvania |
20 |
14 |
26 |
314 |
358 |
— |
0 |
1 |
— |
1 |
— |
0 |
1 |
— |
— |
|
E.N. Central |
29 |
48 |
91 |
943 |
1,188 |
— |
0 |
26 |
— |
— |
— |
0 |
14 |
— |
— |
|
Illinois |
1 |
11 |
27 |
220 |
325 |
— |
0 |
21 |
— |
— |
— |
0 |
8 |
— |
— |
|
Indiana |
6 |
5 |
14 |
91 |
120 |
— |
0 |
6 |
— |
— |
— |
0 |
1 |
— |
— |
|
Michigan |
5 |
11 |
39 |
241 |
272 |
— |
0 |
5 |
— |
— |
— |
0 |
4 |
— |
— |
|
Ohio |
15 |
10 |
26 |
228 |
320 |
— |
0 |
3 |
— |
— |
— |
0 |
2 |
— |
— |
|
Wisconsin |
2 |
7 |
25 |
163 |
151 |
— |
0 |
3 |
— |
— |
— |
0 |
1 |
— |
— |
|
W.N. Central |
2 |
15 |
38 |
102 |
577 |
— |
0 |
51 |
— |
— |
— |
0 |
68 |
— |
1 |
|
Iowa |
N |
0 |
0 |
N |
N |
— |
0 |
10 |
— |
— |
— |
0 |
5 |
— |
— |
|
Kansas |
— |
3 |
18 |
— |
213 |
— |
0 |
8 |
— |
— |
— |
0 |
16 |
— |
— |
|
Minnesota |
— |
5 |
16 |
5 |
242 |
— |
0 |
7 |
— |
— |
— |
0 |
8 |
— |
— |
|
Missouri |
2 |
3 |
16 |
77 |
93 |
— |
0 |
5 |
— |
— |
— |
0 |
1 |
— |
— |
|
Nebraska |
— |
0 |
2 |
2 |
1 |
— |
0 |
14 |
— |
— |
— |
0 |
29 |
— |
— |
|
North Dakota |
— |
0 |
4 |
7 |
13 |
— |
0 |
12 |
— |
— |
— |
0 |
9 |
— |
— |
|
South Dakota |
— |
1 |
3 |
11 |
15 |
— |
0 |
10 |
— |
— |
— |
0 |
12 |
— |
1 |
|
S. Atlantic |
12 |
24 |
39 |
425 |
671 |
— |
0 |
9 |
1 |
— |
— |
0 |
3 |
— |
3 |
|
Delaware |
— |
0 |
2 |
— |
13 |
— |
0 |
1 |
— |
— |
— |
0 |
0 |
— |
— |
|
District of Columbia |
— |
0 |
0 |
— |
10 |
— |
0 |
0 |
— |
— |
— |
0 |
1 |
— |
— |
|
Florida |
12 |
11 |
28 |
265 |
331 |
— |
0 |
1 |
— |
— |
— |
0 |
1 |
— |
— |
|
Georgia |
— |
0 |
3 |
3 |
32 |
— |
0 |
2 |
— |
— |
— |
0 |
1 |
— |
1 |
|
Maryland |
N |
0 |
0 |
N |
N |
— |
0 |
3 |
— |
— |
— |
0 |
2 |
— |
— |
|
North Carolina |
— |
0 |
0 |
— |
— |
— |
0 |
2 |
1 |
— |
— |
0 |
0 |
— |
— |
|
South Carolina |
— |
2 |
10 |
36 |
83 |
— |
0 |
1 |
— |
— |
— |
0 |
1 |
— |
2 |
|
Virginia |
— |
6 |
17 |
76 |
149 |
— |
0 |
2 |
— |
— |
— |
0 |
0 |
— |
— |
|
West Virginia |
— |
2 |
8 |
45 |
53 |
— |
0 |
1 |
— |
— |
— |
0 |
0 |
— |
— |
|
E.S. Central |
1 |
2 |
9 |
42 |
82 |
— |
0 |
7 |
1 |
1 |
— |
0 |
7 |
— |
2 |
|
Alabama |
1 |
2 |
8 |
42 |
78 |
— |
0 |
1 |
— |
— |
— |
0 |
3 |
— |
1 |
|
Kentucky |
N |
0 |
0 |
N |
N |
— |
0 |
1 |
— |
— |
— |
0 |
1 |
— |
— |
|
Mississippi |
— |
0 |
1 |
— |
4 |
— |
0 |
5 |
1 |
— |
— |
0 |
3 |
— |
1 |
|
Tennessee |
N |
0 |
0 |
N |
N |
— |
0 |
3 |
— |
1 |
— |
0 |
2 |
— |
— |
|
W.S. Central |
33 |
36 |
107 |
617 |
957 |
— |
0 |
29 |
— |
2 |
— |
0 |
17 |
— |
— |
|
Arkansas |
1 |
2 |
17 |
34 |
95 |
— |
0 |
3 |
— |
— |
— |
0 |
1 |
— |
— |
|
Louisiana |
— |
1 |
7 |
15 |
33 |
— |
0 |
7 |
— |
— |
— |
0 |
3 |
— |
— |
|
Oklahoma |
N |
0 |
0 |
N |
N |
— |
0 |
9 |
— |
— |
— |
0 |
7 |
— |
— |
|
Texas |
32 |
29 |
103 |
568 |
829 |
— |
0 |
16 |
— |
2 |
— |
0 |
12 |
— |
— |
|
Mountain |
6 |
20 |
48 |
434 |
517 |
— |
0 |
32 |
— |
— |
— |
0 |
53 |
— |
1 |
|
Arizona |
6 |
6 |
22 |
161 |
163 |
— |
0 |
7 |
— |
— |
— |
0 |
2 |
— |
— |
|
Colorado |
— |
6 |
27 |
136 |
142 |
— |
0 |
17 |
— |
— |
— |
0 |
34 |
— |
1 |
|
Idaho |
N |
0 |
0 |
N |
N |
— |
0 |
5 |
— |
— |
— |
0 |
7 |
— |
— |
|
Montana |
— |
1 |
6 |
29 |
49 |
— |
0 |
5 |
— |
— |
— |
0 |
7 |
— |
— |
|
Nevada |
N |
0 |
0 |
N |
N |
— |
0 |
4 |
— |
— |
— |
0 |
1 |
— |
— |
|
New Mexico |
— |
1 |
5 |
27 |
34 |
— |
0 |
4 |
— |
— |
— |
0 |
3 |
— |
— |
|
Utah |
— |
3 |
11 |
81 |
125 |
— |
0 |
1 |
— |
— |
— |
0 |
1 |
— |
— |
|
Wyoming |
— |
0 |
2 |
— |
4 |
— |
0 |
4 |
— |
— |
— |
0 |
6 |
— |
— |
|
Pacific |
3 |
2 |
6 |
43 |
34 |
— |
0 |
27 |
— |
2 |
— |
0 |
19 |
— |
— |
|
Alaska |
3 |
1 |
6 |
16 |
15 |
— |
0 |
0 |
— |
— |
— |
0 |
0 |
— |
— |
|
California |
— |
0 |
3 |
9 |
8 |
— |
0 |
25 |
— |
2 |
— |
0 |
18 |
— |
— |
|
Hawaii |
— |
1 |
3 |
18 |
11 |
— |
0 |
0 |
— |
— |
— |
0 |
0 |
— |
— |
|
Oregon |
N |
0 |
0 |
N |
N |
— |
0 |
2 |
— |
— |
— |
0 |
3 |
— |
— |
|
Washington |
N |
0 |
0 |
N |
N |
— |
0 |
0 |
— |
— |
— |
0 |
1 |
— |
— |
|
Territories |
|||||||||||||||
|
American Samoa |
N |
— |
— |
N |
N |
— |
— |
— |
— |
— |
— |
— |
— |
— |
— |
|
C.N.M.I. |
— |
— |
— |
— |
— |
— |
— |
— |
— |
— |
— |
— |
— |
— |
— |
|
Guam |
— |
— |
— |
— |
— |
— |
— |
— |
— |
— |
— |
— |
— |
— |
— |
|
Puerto Rico |
— |
4 |
16 |
51 |
113 |
— |
0 |
0 |
— |
— |
— |
0 |
0 |
— |
— |
|
U.S. Virgin Islands |
— |
0 |
0 |
— |
— |
— |
0 |
0 |
— |
— |
— |
0 |
0 |
— |
— |
|
C.N.M.I.: Commonwealth of Northern Mariana Islands. U: Unavailable. —: No reported cases. N: Not reportable. NN: Not Nationally Notifiable. Cum: Cumulative year-to-date counts. Med: Median. Max: Maximum. * Case counts for reporting year 2013 and 2014 are provisional and subject to change. For further information on interpretation of these data, see http://wwwn.cdc.gov/nndss/document/ProvisionalNationaNotifiableDiseasesSurveillanceData20100927.pdf. Data for TB are displayed in Table IV, which appears quarterly. † Updated weekly from reports to the Division of Vector-Borne Infectious Diseases, National Center for Zoonotic, Vector-Borne, and Enteric Diseases (ArboNET Surveillance). Data for California serogroup, eastern equine, Powassan, St. Louis, and western equine diseases are available in Table I. § Not reportable in all states. Data from states where the condition is not reportable are excluded from this table, except starting in 2007 for the domestic arboviral diseases and influenza-associated pediatric mortality, and in 2003 for SARS-CoV. Reporting exceptions are available at http://wwwn.cdc.gov/nndss/document/SRCA_FINAL_REPORT_2006-2012_final.xlsx. |
|||||||||||||||
|
TABLE III. Deaths in 122 U.S. cities,* week ending May 24, 2014 (21st week) (Export data) |
|||||||||||||||||
|---|---|---|---|---|---|---|---|---|---|---|---|---|---|---|---|---|---|
|
Reporting area |
All causes, by age (years) |
P&I† Total |
Reporting area (Continued) |
All causes, by age (years) |
P&I† Total |
||||||||||||
|
All Ages |
≥65 |
45–64 |
25–44 |
1–24 |
<1 |
All Ages |
≥65 |
45–64 |
25–44 |
1–24 |
<1 |
||||||
|
New England |
563 |
392 |
130 |
22 |
9 |
10 |
52 |
S. Atlantic |
1,091 |
699 |
266 |
81 |
21 |
24 |
51 |
||
|
Boston, MA |
150 |
97 |
38 |
8 |
4 |
3 |
18 |
Atlanta, GA |
105 |
63 |
19 |
17 |
5 |
1 |
7 |
||
|
Bridgeport, CT |
27 |
18 |
6 |
1 |
— |
2 |
1 |
Baltimore, MD |
158 |
81 |
56 |
14 |
4 |
3 |
12 |
||
|
Cambridge, MA |
19 |
17 |
2 |
— |
— |
— |
1 |
Charlotte, NC |
137 |
83 |
35 |
11 |
4 |
4 |
8 |
||
|
Fall River, MA |
28 |
24 |
4 |
— |
— |
— |
2 |
Jacksonville, FL |
181 |
115 |
47 |
11 |
3 |
5 |
3 |
||
|
Hartford, CT |
66 |
45 |
13 |
4 |
2 |
2 |
5 |
Miami, FL |
54 |
42 |
8 |
3 |
1 |
— |
2 |
||
|
Lowell, MA |
18 |
14 |
2 |
1 |
1 |
— |
3 |
Norfolk, VA |
47 |
28 |
13 |
3 |
2 |
1 |
2 |
||
|
Lynn, MA |
10 |
6 |
4 |
— |
— |
— |
— |
Richmond, VA |
51 |
35 |
14 |
2 |
— |
— |
2 |
||
|
New Bedford, MA |
23 |
16 |
7 |
— |
— |
— |
— |
Savannah, GA |
88 |
67 |
15 |
4 |
1 |
1 |
4 |
||
|
New Haven, CT |
27 |
18 |
6 |
2 |
— |
1 |
2 |
St. Petersburg, FL |
50 |
38 |
12 |
— |
— |
— |
2 |
||
|
Providence, RI |
62 |
44 |
15 |
1 |
1 |
1 |
5 |
Tampa, FL |
108 |
79 |
20 |
5 |
1 |
3 |
4 |
||
|
Somerville, MA |
2 |
2 |
— |
— |
— |
— |
— |
Washington, D.C. |
104 |
62 |
27 |
9 |
— |
6 |
5 |
||
|
Springfield, MA |
27 |
18 |
9 |
— |
— |
— |
1 |
Wilmington, DE |
8 |
6 |
— |
2 |
— |
— |
— |
||
|
Waterbury, CT |
39 |
29 |
8 |
2 |
— |
— |
1 |
E.S. Central |
1,047 |
685 |
247 |
61 |
25 |
28 |
76 |
||
|
Worcester, MA |
65 |
44 |
16 |
3 |
1 |
1 |
13 |
Birmingham, AL |
198 |
115 |
52 |
11 |
5 |
14 |
8 |
||
|
Mid. Atlantic |
1,658 |
1,219 |
330 |
72 |
17 |
19 |
76 |
Chattanooga, TN |
90 |
61 |
24 |
3 |
2 |
— |
9 |
||
|
Albany, NY |
60 |
39 |
15 |
1 |
3 |
2 |
2 |
Knoxville, TN |
154 |
108 |
33 |
9 |
2 |
2 |
14 |
||
|
Allentown, PA |
25 |
20 |
5 |
— |
— |
— |
2 |
Lexington, KY |
80 |
53 |
18 |
5 |
2 |
2 |
5 |
||
|
Buffalo, NY |
71 |
48 |
16 |
4 |
2 |
1 |
3 |
Memphis, TN |
222 |
150 |
44 |
14 |
9 |
5 |
19 |
||
|
Camden, NJ |
21 |
15 |
4 |
2 |
— |
— |
1 |
Mobile, AL |
87 |
59 |
22 |
2 |
3 |
1 |
4 |
||
|
Elizabeth, NJ |
24 |
14 |
8 |
2 |
— |
— |
1 |
Montgomery, AL |
48 |
28 |
14 |
6 |
— |
— |
3 |
||
|
Erie, PA |
46 |
33 |
11 |
2 |
— |
— |
3 |
Nashville, TN |
168 |
111 |
40 |
11 |
2 |
4 |
14 |
||
|
Jersey City, NJ |
19 |
9 |
6 |
4 |
— |
— |
2 |
W.S. Central |
1,567 |
1,019 |
398 |
96 |
27 |
27 |
66 |
||
|
New York City, NY |
972 |
709 |
207 |
37 |
10 |
9 |
39 |
Austin, TX |
104 |
59 |
32 |
3 |
4 |
6 |
5 |
||
|
Newark, NJ |
38 |
23 |
9 |
3 |
1 |
2 |
— |
Baton Rouge, LA |
75 |
48 |
22 |
2 |
1 |
2 |
3 |
||
|
Paterson, NJ |
19 |
13 |
4 |
2 |
— |
— |
— |
Corpus Christi, TX |
55 |
47 |
7 |
— |
— |
1 |
1 |
||
|
Philadelphia, PA |
U |
U |
U |
U |
U |
U |
U |
Dallas, TX |
223 |
123 |
65 |
22 |
7 |
6 |
24 |
||
|
Pittsburgh, PA§ |
26 |
20 |
2 |
3 |
— |
— |
2 |
El Paso, TX |
93 |
65 |
21 |
5 |
1 |
1 |
4 |
||
|
Reading, PA |
25 |
19 |
4 |
— |
— |
2 |
4 |
Fort Worth, TX |
U |
U |
U |
U |
U |
U |
U |
||
|
Rochester, NY |
127 |
112 |
11 |
3 |
— |
1 |
7 |
Houston, TX |
480 |
317 |
125 |
30 |
5 |
3 |
11 |
||
|
Schenectady, NY |
12 |
9 |
3 |
— |
— |
— |
2 |
Little Rock, AR |
105 |
65 |
30 |
3 |
3 |
4 |
2 |
||
|
Scranton, PA |
25 |
22 |
3 |
— |
— |
— |
2 |
New Orleans, LA |
44 |
24 |
11 |
6 |
2 |
1 |
1 |
||
|
Syracuse, NY |
80 |
65 |
9 |
5 |
— |
1 |
5 |
San Antonio, TX |
250 |
171 |
58 |
18 |
2 |
1 |
9 |
||
|
Trenton, NJ |
33 |
22 |
6 |
3 |
1 |
1 |
— |
Shreveport, LA |
94 |
63 |
20 |
7 |
2 |
2 |
6 |
||
|
Utica, NY |
21 |
16 |
4 |
1 |
— |
— |
— |
Tulsa, OK |
44 |
37 |
7 |
— |
— |
— |
— |
||
|
Yonkers, NY |
14 |
11 |
3 |
— |
— |
— |
1 |
Mountain |
915 |
622 |
197 |
62 |
23 |
11 |
55 |
||
|
E.N. Central |
1,720 |
1,181 |
372 |
86 |
33 |
48 |
117 |
Albuquerque, NM |
130 |
81 |
27 |
14 |
6 |
2 |
11 |
||
|
Akron, OH |
51 |
31 |
12 |
4 |
1 |
3 |
1 |
Boise, ID |
63 |
48 |
10 |
3 |
1 |
1 |
6 |
||
|
Canton, OH |
40 |
29 |
7 |
1 |
3 |
— |
6 |
Colorado Springs, CO |
81 |
64 |
8 |
5 |
3 |
1 |
2 |
||
|
Chicago, IL |
220 |
145 |
52 |
15 |
4 |
4 |
22 |
Denver, CO |
75 |
48 |
18 |
6 |
— |
3 |
— |
||
|
Cincinnati, OH |
63 |
36 |
15 |
4 |
2 |
6 |
2 |
Las Vegas, NV |
235 |
158 |
58 |
13 |
5 |
1 |
21 |
||
|
Cleveland, OH |
243 |
172 |
55 |
13 |
2 |
1 |
15 |
Ogden, UT |
40 |
27 |
8 |
4 |
— |
1 |
2 |
||
|
Columbus, OH |
229 |
131 |
64 |
9 |
9 |
16 |
15 |
Phoenix, AZ |
U |
U |
U |
U |
U |
U |
U |
||
|
Dayton, OH |
159 |
127 |
27 |
4 |
— |
1 |
14 |
Pueblo, CO |
46 |
31 |
12 |
2 |
1 |
— |
3 |
||
|
Detroit, MI |
U |
U |
U |
U |
U |
U |
U |
Salt Lake City, UT |
115 |
68 |
28 |
13 |
6 |
— |
6 |
||
|
Evansville, IN |
31 |
26 |
5 |
— |
— |
— |
1 |
Tucson, AZ |
130 |
97 |
28 |
2 |
1 |
2 |
4 |
||
|
Fort Wayne, IN |
72 |
48 |
15 |
3 |
3 |
3 |
1 |
Pacific |
1,690 |
1,174 |
388 |
73 |
27 |
28 |
113 |
||
|
Gary, IN |
8 |
5 |
2 |
1 |
— |
— |
1 |
Berkeley, CA |
16 |
12 |
3 |
1 |
— |
— |
2 |
||
|
Grand Rapids, MI |
68 |
51 |
13 |
— |
1 |
3 |
4 |
Fresno, CA |
135 |
105 |
22 |
6 |
— |
2 |
10 |
||
|
Indianapolis, IN |
170 |
109 |
33 |
17 |
5 |
6 |
16 |
Glendale, CA |
26 |
19 |
7 |
— |
— |
— |
2 |
||
|
Lansing, MI |
53 |
42 |
8 |
1 |
— |
2 |
— |
Honolulu, HI |
62 |
42 |
17 |
1 |
— |
2 |
4 |
||
|
Milwaukee, WI |
46 |
31 |
11 |
4 |
— |
— |
5 |
Long Beach, CA |
60 |
39 |
14 |
3 |
2 |
2 |
4 |
||
|
Peoria, IL |
42 |
28 |
10 |
3 |
1 |
— |
1 |
Los Angeles, CA |
220 |
145 |
54 |
11 |
3 |
7 |
22 |
||
|
Rockford, IL |
67 |
54 |
12 |
— |
1 |
— |
4 |
Pasadena, CA |
21 |
17 |
2 |
1 |
— |
1 |
2 |
||
|
South Bend, IN |
54 |
42 |
9 |
2 |
— |
1 |
4 |
Portland, OR |
122 |
75 |
40 |
5 |
2 |
— |
3 |
||
|
Toledo, OH |
104 |
74 |
22 |
5 |
1 |
2 |
5 |
Sacramento, CA |
231 |
159 |
59 |
9 |
2 |
2 |
18 |
||
|
Youngstown, OH |
U |
U |
U |
U |
U |
U |
U |
San Diego, CA |
146 |
102 |
26 |
10 |
4 |
4 |
7 |
||
|
W.N. Central |
683 |
415 |
184 |
46 |
22 |
15 |
40 |
San Francisco, CA |
106 |
74 |
26 |
6 |
— |
— |
9 |
||
|
Des Moines, IA |
6 |
4 |
1 |
— |
1 |
— |
1 |
San Jose, CA |
212 |
156 |
42 |
5 |
6 |
3 |
14 |
||
|
Duluth, MN |
39 |
26 |
8 |
5 |
— |
— |
4 |
Santa Cruz, CA |
37 |
28 |
8 |
— |
1 |
— |
4 |
||
|
Kansas City, KS |
15 |
10 |
5 |
— |
— |
— |
— |
Seattle, WA |
126 |
79 |
31 |
8 |
5 |
3 |
3 |
||
|
Kansas City, MO |
99 |
58 |
30 |
7 |
1 |
3 |
5 |
Spokane, WA |
58 |
42 |
13 |
1 |
1 |
1 |
3 |
||
|
Lincoln, NE |
49 |
37 |
9 |
2 |
1 |
— |
3 |
Tacoma, WA |
112 |
80 |
24 |
6 |
1 |
1 |
6 |
||
|
Minneapolis, MN |
67 |
39 |
21 |
4 |
— |
3 |
5 |
Total¶ |
10,934 |
7,406 |
2,512 |
599 |
204 |
210 |
646 |
||
|
Omaha, NE |
88 |
56 |
20 |
8 |
4 |
— |
6 |
||||||||||
|
St. Louis, MO |
170 |
83 |
56 |
17 |
9 |
4 |
7 |
||||||||||
|
St. Paul, MN |
56 |
40 |
13 |
— |
— |
3 |
4 |
||||||||||
|
Wichita, KS |
94 |
62 |
21 |
3 |
6 |
2 |
5 |
||||||||||
|
U: Unavailable. —: No reported cases. * Mortality data in this table are voluntarily reported from 122 cities in the United States, most of which have populations of >100,000. A death is reported by the place of its occurrence and by the week that the death certificate was filed. Fetal deaths are not included. † Pneumonia and influenza. § Because of changes in reporting methods in this Pennsylvania city, these numbers are partial counts for the current week. Complete counts will be available in 4 to 6 weeks. ¶ Total includes unknown ages. |
|||||||||||||||||
Use of trade names and commercial sources is for identification only and does not imply endorsement by the U.S. Department of
Health and Human Services.
References to non-CDC sites on the Internet are
provided as a service to MMWR readers and do not constitute or imply
endorsement of these organizations or their programs by CDC or the U.S.
Department of Health and Human Services. CDC is not responsible for the content
of pages found at these sites. URL addresses listed in MMWR were current as of
the date of publication.
All MMWR HTML versions of articles are electronic conversions from typeset documents.
This conversion might result in character translation or format errors in the HTML version.
Users are referred to the electronic PDF version (http://www.cdc.gov/mmwr)
and/or the original MMWR paper copy for printable versions of official text, figures, and tables.
An original paper copy of this issue can be obtained from the Superintendent of Documents, U.S.
Government Printing Office (GPO), Washington, DC 20402-9371;
telephone: (202) 512-1800. Contact GPO for current prices.
**Questions or messages regarding errors in formatting should be addressed to
mmwrq@cdc.gov.
