Cigarette Prices and Smoking Prevalence After a Tobacco Tax Increase — Turkey, 2008 and 2012
, PhD1, , PhD1, , MD2, , PhD2, , MD3, , MD3, , MD3, , MD3, , MS4, , MS4, , MS4, , MS4, , MD, PhD5, , MD, PhD5, , DDS1 (Author affiliations at end of text)
Raising the price of tobacco products has been shown to reduce tobacco consumption in the United States and other high-income countries, and evidence of this impact has been growing for low- and middle-income countries as well (1,2). Turkey is a middle-income country surveyed by the Global Adult Tobacco Survey (GATS) twice in a 4-year period, in 2008 and 2012. During this time, the country introduced a policy raising its Special Consumption Tax on Tobacco and implemented a comprehensive tobacco control program banning smoking in public places, banning advertising, and introducing graphic health warnings. The higher tobacco tax took effect in early 2010, allowing sufficient time for subsequent changes in prices and smoking to be observed by the time of the 2012 GATS. This report uses data from GATS Turkey to examine how cigarette prices changed after the 2010 tax increase, describe the temporally associated changes in smoking prevalence, and learn whether this smoking prevalence changed more in some demographic groups than others. From 2008 to 2012, the average price paid for cigarettes increased by 42.1%, cigarettes became less affordable, and smoking prevalence decreased by 14.6% (Figure). The largest reduction in smoking was observed among persons with lower socioeconomic status (SES), highlighting the potential role of tax policy in reducing health disparities across socioeconomic groups.
GATS is an ongoing, nationally representative household survey of noninstitutionalized adults aged ≥15 years. The survey uses a multistage geographically clustered sample design. The indicators described in this report were obtained by summarizing the individual responses of participants in GATS Turkey 2008 (9,030 completed interviews) and 2012 (9,851 completed interviews). Response rates for GATS Turkey were 90.1% in 2012 and 93.7% in 2008. Smoking prevalence estimates were based on self-reported current smoking, which included both daily and less-than-daily smoking. Prices paid per 20 cigarettes were calculated from the responses of current smokers of manufactured cigarettes, which provide data on amounts spent and quantities purchased during the most recent cigarette purchase. Price indicators for 2008 were adjusted for inflation to be comparable with 2012 values. The cigarette price indicators in this report are not brand-specific, but represent the average amount spent per 20 cigarettes across the range of brand choices in each year. The examined indicators and their relative change from 2008 to 2012 were stratified by demographic characteristics including sex, age, urbanicity, education, and wealth. The wealth index category for each respondent was created based on self-reported ownership of certain core household items in GATS (3).
Changes in cigarette affordability during the study period were evaluated using the relative-income price of cigarettes, which represents prices adjusted for country income level (4). The relative-income price was calculated as the ratio of the average price paid per 2,000 cigarettes in each GATS year to that year's gross domestic product (GDP) per capita (4).
After adjusting for inflation, the average real price paid per 20 cigarettes in Turkey increased by 42.1% during 2008–2012, from 4.0 to 5.7 Turkish lira (Table 1). The increase in the purchasing price varied across demographic groups; for instance, it was estimated to be smaller among younger smokers and among smokers with less wealth. As the cost of cigarettes increased, the average smoking rate dropped by 14.6% during 2008–2012, from 30.1% to 25.7% (Table 2). The largest decrease in smoking occurred among persons of lower SES, who were in the lowest wealth and education categories (Table 2). The relative reduction in smoking among those in the bottom tercile of the wealth index (-30.3%) was twice as large as among those in the middle wealth tercile (-13.9%), and nearly three times larger than among those in the top wealth tercile (-11.1%).
On average, cigarettes in Turkey became less affordable during 2008–2012. Cigarette affordability, represented by the relative-income price, falls when the growth in cigarette prices outpaces the growth in GDP per capita. The relative-income price of cigarettes in Turkey increased by approximately 30% from 2008 to 2012 (Table 1), indicating that during this period cigarette prices in Turkey increased faster than the country's per capita income, corresponding to a significant reduction in affordability.
Discussion
After the 2010 increase in tobacco taxes in Turkey, the average price paid for cigarettes increased, cigarettes became less affordable, and a statistically significant drop in smoking rates occurred. The reduction in smoking was substantially larger among persons with lower SES. These findings document the presence of an inverse relationship between cigarette prices and smoking in Turkey, and confirm previous analytic findings that this relationship is especially strong in lower-income populations (5). This underscores the potential of a tobacco price increase to reduce tobacco use and to help reduce health disparities by lowering smoking prevalence at a higher rate in vulnerable populations.
Although the average purchasing price of cigarettes increased for all demographic groups, it increased at a slightly lower rate among smokers in the lowest wealth tercile than among those at the middle or higher ends of the wealth spectrum. Similarly, younger smokers experienced a smaller increase in the average purchasing price than older smokers. These demographic differences indicate that smokers who are younger or low-income might be more likely to engage in price-minimizing behavior when facing a tax increase (examples of such behavior include switching to less expensive brands and buying in bulk).
The demographic breakdown of the 2008–2012 changes in purchasing price and smoking rates in Turkey shows that groups with relatively tighter income constraints, such as young adults or persons with a lower wealth index, reported smaller increases in cigarette prices paid and at the same time experienced the steepest declines in smoking prevalence. These findings have implications with respect to tax regressivity. An existing tax is regressive if it imposes a greater burden, relative to income, on those with lower wealth. However, a tobacco tax increase does not have regressivity characteristics. The increase in tobacco tax in Turkey was associated with a greater reduction in smoking among persons with the lowest wealth than among wealthier persons. This suggests that the tax increase did not have a regressive outcome, because smoking and its associated expense declined most among those who could least afford the habit.
Comparing the change in the average purchasing price of cigarettes with the concurrent increase in cigarette tax can help infer the tax pass-through, which is the extent to which the tax increase was reflected in the final consumer price. A full pass-through of the tax onto the final price is more likely to influence consumption than a partial pass-through, where the tax increase is partially absorbed by the producer and might not fully reach the consumer. In the case of Turkey, the tax pass-through appears to be complete, optimizing the potential tax impact. The cigarette tax level in Turkey, measured as the share of total tax to retail price, rose from 0.74 to 0.80 during 2008–2012 (Turkey Ministry of Finance, General Directorate of Revenue Policies, unpublished data, 2013). Applying these tax shares to the average cigarette price paid in each year, and comparing the change in the average tax amount with the change in the average price, it is estimated that the pass-through of the 2010 tax increase in Turkey was more than one-to-one. This indicates that the tax increase might have been accompanied by an additional price increase from the producer side, timed to coincide with the tax change. A producer-initiated price increase that shadows a concurrent tax increase is a common pricing strategy in some markets. In markets perceived as tobacco use strongholds, such as Turkey, price increases that further augment the tax pass-through would be driven by a tobacco producer's anticipation of higher profits. This is in contrast to the United States, where a recent shift has occurred toward pricing strategies that reduce the tax pass-through, such as tobacco industry offering of discounts and coupons, which limit the full potential of taxes for reducing consumption (6).
The findings in this report are subject to at least three limitations. First, the examined indicators are based on self-reported individual answers to survey questions and therefore are subject to recall bias. Second, because of small sample sizes, important differences across demographic groups within each year sample might not be statistically significant. This affects especially the demographic breakdown of cigarette prices paid, which are based on a subsample of smokers. Finally, these data do not establish cause-and-effect relationships because of the observational nature of the report, which does not control for other tobacco control measures introduced at the same time as the tax increase.
Turkey's smoking rates historically have been among the world's highest. This report describes a considerable shift in smoking behavior, occurring even when the baseline levels of tobacco use and addiction in the population are relatively high. Turkey's experience with cigarette price change might be informative to policymakers in other low- and middle-income countries, where the majority of tobacco-related deaths are expected to occur in the near future (7).
Acknowledgments
Muhammad Jami Husain, Rebecca Bunnell, Xin Xu, Gabbi Promoff, Timothy McAfee, Office on Smoking and Health, National Center for Chronic Disease Prevention and Health Promotion, CDC. Peter Briss, National Center for Chronic Disease Prevention and Health Promotion, CDC. Joanna Birckmayer, Campaign for Tobacco-Free Kids. Bloomberg Initiative to Reduce Tobacco Use.
1Office on Smoking and Health, National Center for Chronic Disease Prevention and Health Promotion, CDC; 2Prevention of Noncommunicable Diseases, World Health Organization, Geneva, Switzerland; 3Turkey Ministry of Health, Ankara, Turkey; 4Turkish Statistical Institute, Ankara, Turkey; 5Institute of Public Health, Hacettepe University, Ankara, Turkey (Corresponding author: Deliana Kostova, kiv0@cdc.gov, 404-747-8978)
References
- International Agency for Research on Cancer. IARC handbooks of cancer prevention: tobacco control. Volume 14: effectiveness of tax and price policies in tobacco control. Lyon, France: International Agency for Research on Cancer, World Health Organization; 2011. Available at http://www.iarc.fr/en/publications/pdfs-online/prev/handbook14/handbook14.pdf.
- Kostova D, Chaloupka FJ, Shang C. A duration analysis of the role of cigarette prices on smoking initiation and cessation in developing countries. Eur J Health Econ 2014; March 9 [Epub ahead of print].
- Palipudi KM, Gupta PC, Sinha DN, Andes LJ, Asma S, McAffee T. Social determinants of health and tobacco use in thirteen low and middle income countries: evidence from the Global Adult Tobacco Survey. PLoS One 2012;7:e33466.
- Blecher E, van Walbeek C. An analysis of cigarette affordability. Paris, France: International Union Against Tuberculosis and Lung Disease; 2008. Available at http://global.tobaccofreekids.org/files/pdfs/en/TAX_Cigarette_affordability_report_en.pdf.
- Yürekli A, Önder Z, Elibol M, et al. The economics of tobacco and tobacco taxation in Turkey. Paris, France: International Union Against Tuberculosis and Lung Disease; 2010. Available at http://global.tobaccofreekids.org/files/pdfs/en/Turkey_Tobacco_Economics_full_en.pdf.
- Chaloupka FJ, Cummings KM, Morley CP, Horan JK. Tax, price, and cigarette smoking: evidence from the tobacco documents and implications for tobacco company marketing strategies. Tob Control 2002;11 Suppl 1:I62–72.
- Mather CD, Loncar D. Projections of global mortality and burden of disease from 2002 to 2030. PLoS Med 2006;3:e442.
What is already known on this topic?
There is increasing evidence that raising the prices of tobacco products can reduce tobacco use in low- and middle-income countries, where most of the global tobacco-related disease burden is expected to occur. Turkey is a middle-income country with smoking rates that historically have been among the world's highest. In 2010, Turkey increased its Special Consumption Tax on Tobacco, increasing the price of cigarettes.
What is added by this report?
After the increase in tobacco tax, the average price paid for cigarettes in Turkey increased by 42% during 2008–2012, cigarettes became less affordable, and the average smoking prevalence declined by 15%. The largest reduction in smoking prevalence (30% relative change from 2008 to 2012) was observed among persons with the lowest socioeconomic status.
What are the implications for public health practice?
These survey results establish a link between a tobacco price increase and a decline in tobacco use, and show the potential of tobacco taxes and prices to help reduce health disparities by lowering smoking prevalence at a higher rate in vulnerable populations.
FIGURE. Average cigarette prices* (in Turkish lira) and smoking prevalence† — Global Adult Tobacco Survey, Turkey, 2008 and 2012
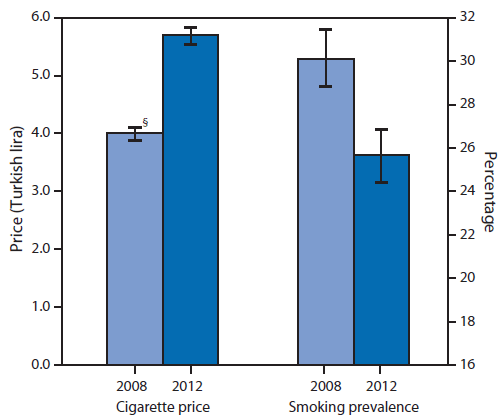
* Average price paid per 20 manufactured cigarettes in constant 2012 Turkish lira.
† Prevalence of current smoking of manufactured cigarettes.
§ 95% confidence interval.
Alternate Text: The figure above shows average cigarette prices (in Turkish lira) and smoking prevalence, based on findings from the Global Adult Tobacco Survey conducted in Turkey in 2008 and again 2012. After the 2010 increase in tobacco taxes in Turkey, the average price paid for cigarettes increased, cigarettes became less affordable, and a statistically significant drop in smoking rates occurred.
Use of trade names and commercial sources is for identification only and does not imply endorsement by the U.S. Department of
Health and Human Services.
References to non-CDC sites on the Internet are
provided as a service to MMWR readers and do not constitute or imply
endorsement of these organizations or their programs by CDC or the U.S.
Department of Health and Human Services. CDC is not responsible for the content
of pages found at these sites. URL addresses listed in MMWR were current as of
the date of publication.
All MMWR HTML versions of articles are electronic conversions from typeset documents.
This conversion might result in character translation or format errors in the HTML version.
Users are referred to the electronic PDF version (http://www.cdc.gov/mmwr)
and/or the original MMWR paper copy for printable versions of official text, figures, and tables.
An original paper copy of this issue can be obtained from the Superintendent of Documents, U.S.
Government Printing Office (GPO), Washington, DC 20402-9371;
telephone: (202) 512-1800. Contact GPO for current prices.
**Questions or messages regarding errors in formatting should be addressed to
mmwrq@cdc.gov.
