QuickStats: Birth Rates for Females Aged 15–19 Years, by Race/Ethnicity* — National Vital Statistics System,† United States, 2007 and 2012
* Persons categorized as American Indian/Alaska Native or Asian/Pacific Islander also might be Hispanic.
† U.S. residents only.
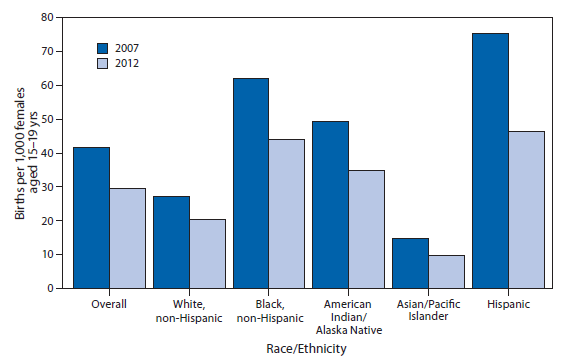
From 2007 to 2012, the birth rate for females aged 15–19 years in the United States overall declined by 29%, from 41.5 to 29.4 births per 1,000 females in that age group. Among racial/ethnic populations, declines ranged from 25% for non-Hispanic white females to 39% for Hispanics. Rates decreased 29% for non-Hispanic black females and American Indian/Alaska Natives and 34% for Asian/Pacific Islanders.
Source: Martin JA, Hamilton BE, Osterman JK, et al. Births: final data for 2012. Natl Vital Stat Rep 2013; 62(9). Available at http://www.cdc.gov/nchs/data/nvsr/nvsr62/nvsr62_09.pdf.
Reported by: Brady E. Hamilton, PhD, bhamilton@cdc.gov, 301-458-4653.
Alternate Text: The figure above shows birth rates for females aged 15-19 years, by race/ethnicity in the United States during 2007 and 2012. From 2007 to 2012, the birth rate for females aged 15-19 years in the United States overall declined by 29%, from 41.5 to 29.4 births per 1,000 females in that age group. Among racial/ethnic populations, declines ranged from 25% for non-Hispanic white females to 39% for Hispanics. Rates decreased 29% for non-Hispanic black females and American Indian/Alaska Natives and 34% for Asians/Pacific Islanders.
Use of trade names and commercial sources is for identification only and does not imply endorsement by the U.S. Department of
Health and Human Services.
References to non-CDC sites on the Internet are
provided as a service to MMWR readers and do not constitute or imply
endorsement of these organizations or their programs by CDC or the U.S.
Department of Health and Human Services. CDC is not responsible for the content
of pages found at these sites. URL addresses listed in MMWR were current as of
the date of publication.
All MMWR HTML versions of articles are electronic conversions from typeset documents.
This conversion might result in character translation or format errors in the HTML version.
Users are referred to the electronic PDF version (http://www.cdc.gov/mmwr)
and/or the original MMWR paper copy for printable versions of official text, figures, and tables.
An original paper copy of this issue can be obtained from the Superintendent of Documents, U.S.
Government Printing Office (GPO), Washington, DC 20402-9371;
telephone: (202) 512-1800. Contact GPO for current prices.
**Questions or messages regarding errors in formatting should be addressed to
mmwrq@cdc.gov.
