Interim Estimates of 2013–14 Seasonal Influenza Vaccine Effectiveness — United States, February 2014
Brendan Flannery, PhD1, Swathi N. Thaker, PhD1, Jessie Clippard, MPH1, Arnold S. Monto, MD2, Suzanne E. Ohmit, DrPH2, Richard K. Zimmerman, MD3, Mary Patricia Nowalk, PhD3, Manjusha Gaglani, MBBS4, Michael L. Jackson, PhD5, Lisa A. Jackson, MD5, Edward A. Belongia, MD6, Huong Q. McLean, PhD6, LaShondra Berman, MS1, Angie Foust, MA1, Wendy Sessions, MPH1, Sarah Spencer, PhD1, Alicia M. Fry, MD1 (Author affiliations at end of text)
In the United States, annual vaccination against seasonal influenza is recommended for all persons aged ≥6 months (1). Each season since 2004–05, CDC has estimated the effectiveness of seasonal influenza vaccine to prevent influenza-associated, medically attended acute respiratory illness (ARI). This report uses data from 2,319 children and adults enrolled in the U.S. Influenza Vaccine Effectiveness (Flu VE) Network during December 2, 2013–January 23, 2014, to estimate an interim adjusted effectiveness of seasonal influenza vaccine for preventing laboratory-confirmed influenza virus infection associated with medically attended ARI. During this period, overall vaccine effectiveness (VE) (adjusted for study site, age, sex, race/ethnicity, self-rated health, and days from illness onset to enrollment) against influenza A and B virus infection associated with medically attended ARI was 61%. The influenza A (H1N1)pdm09 (pH1N1) virus that emerged to cause a pandemic in 2009 accounted for 98% of influenza viruses detected. VE was estimated to be 62% against pH1N1 virus infections and was similar across age groups. As of February 8, 2014, influenza activity remained elevated in the United States, the proportion of persons seeing their health-care provider for influenza-like illness was lower than in early January but remained above the national baseline, and activity still might be increasing in some parts of the country (2). CDC and the Advisory Committee on Immunization Practices routinely recommend that annual influenza vaccination efforts continue as long as influenza viruses are circulating (1). Persons aged ≥6 months who have not yet been vaccinated this season should be vaccinated. Antiviral medications are an important second line of defense to treat influenza illness and should be used as recommended (3) among suspected or confirmed influenza patients, regardless of patient vaccination status. Early antiviral treatment is recommended for persons with suspected influenza with severe or progressive illness (e.g., hospitalized persons) and those at high risk for complications from influenza, no matter how severe the illness.
Methods used by the U.S. Flu VE Network have been published previously (4). At five study sites, patients aged ≥6 months seeking outpatient medical care for an ARI with cough, within 7 days of illness onset, were enrolled.* Study enrollment began after laboratory-confirmed cases of influenza were identified through local surveillance for ≥2 consecutive weeks. Trained study staff members reviewed appointment schedules and lists of symptoms to identify patients with ARI and approached eligible patients (or parents/guardians) to complete a brief screening survey. Patients were eligible for enrollment if they 1) were aged ≥6 months on September 1, 2013, and thus were eligible for vaccination; 2) reported an ARI with cough and onset ≤7 days earlier; and 3) had not been treated with influenza antiviral medication (e.g., oseltamivir) during this illness. Consenting participants completed an enrollment interview. Respiratory specimens were collected from each patient using nasal and oropharyngeal swabs, which were placed together in a single cryovial with viral transport medium. Only nasal swabs were collected for patients aged <2 years. Specimens were tested at U.S. Flu VE Network laboratories using CDC's real-time reverse transcription polymerase chain reaction (rRT-PCR) protocol for detection and identification of influenza viruses. Participants were considered vaccinated if they received ≥1 dose of any seasonal influenza vaccine ≥14 days before illness onset, according to medical records and registries (at Wisconsin and Washington sites) or medical records and self-report (at Michigan, Pennsylvania, and Texas sites). VE was estimated as 100% x (1 – odds ratio) comparing odds of vaccination among influenza-positive versus influenza-negative participants. Estimates were adjusted for study site, age, sex, race/ethnicity, self-rated health, and days from illness onset to enrollment using logistic regression. Interim VE estimates for the 2013–14 season were based on patients enrolled through January 23, 2014.
Of the 2,319 children and adults with ARI enrolled at the five study sites during December 2, 2013–January 23, 2014, a total of 784 (34%) tested positive for influenza virus by rRT-PCR (Figure); 778 (99%) of these viruses were influenza A, and six (1%) were influenza B (Table 1). Among 755 subtyped influenza A viruses, 742 (98%) were pH1N1 viruses. The proportion of patients with influenza differed by study site, age, race/ethnicity, and interval from onset to enrollment (Table 1). The proportion vaccinated was 38% to 48% across sites and also differed by age, race/ethnicity, and interval from onset to enrollment.
The proportion vaccinated with 2013–14 seasonal influenza vaccine was 29% among influenza cases compared with 50% among influenza-negative controls (Table 2). After adjusting for study site, age, sex, race/ethnicity, self-rated health, and days from illness onset to enrollment, VE against medically attended ARI attributable to influenza was 61% (95% confidence interval [CI] = 52%–68%). The adjusted VE for all ages against medically attended ARI caused by pH1N1 virus infection was 62% (CI = 53%–69%). Similar VE against pH1N1 was observed for all age groups.
Editorial Note
Interim results for the 2013–14 season indicate that vaccination has reduced the risk for influenza-associated medical visits by approximately 60%, demonstrating the benefits of influenza vaccination during the current season. Influenza activity is likely to continue for several more weeks in the United States. Vaccination efforts should continue as long as influenza viruses are circulating. Persons aged ≥6 months who have not yet received the 2013–14 influenza vaccine should be vaccinated. As of February 8, 2014, approximately 134 million doses of influenza vaccine had been distributed in the United States for the 2013–14 season, from approximately 138–145 million doses that were anticipated to be available for the U.S. market. Because some vaccine providers might have exhausted their vaccine supplies at this time, persons seeking vaccination might need to call more than one provider to locate vaccine.†
These age-adjusted interim VE estimates for the 2013–14 influenza vaccine suggest continued effectiveness in preventing outpatient medical visits associated with pH1N1 virus infection. The 2009 influenza pandemic viruses have continued to circulate each season since the 2009 pandemic, but the 2013–14 influenza season is the first season since 2009-10 during which the pH1N1 viruses have predominated; as of February 8, 2014, pH1N1 viruses accounted for nearly 96% of subtyped influenza A viruses reported to CDC (2). Interim VE estimates for 2013 influenza vaccine for prevention of pH1N1-associated outpatient ARI visits were similar to VE estimates for monovalent pandemic and seasonal influenza vaccines for prevention of outpatient medical visits associated with pH1N1 virus infection during previous influenza seasons (4–7) and are consistent with recent interim estimates from Canada (8). Nationally, more than 99% of pH1N1 viruses tested by CDC this season, including 40 viruses from U.S. Flu VE Network sites, have been antigenically similar to A/California/7/2009, the pH1N1 component of 2013–14 influenza vaccines. In addition, deep sequencing analysis of 43 pH1N1 virus specimens from the Wisconsin site showed genetic similarity to other recent pH1N1 viruses that have been tested and found to be antigenically similar to the recommended vaccine virus (Thomas C. Friedrich, PhD, School of Veterinary Medicine, University of Wisconsin-Madison, unpublished data, 2014).
These interim estimates suggest similar preventive benefits against pH1N1 influenza virus infections across age groups. During the pandemic, young adults, children, pregnant women, and persons with medical conditions (including morbid obesity) that placed them at high risk for influenza-related complications§ experienced high rates of severe illness and influenza-associated hospitalization. Although influenza-associated hospitalization rates during the 2013–14 season have been highest among children aged <5 years and persons aged 50–64 and ≥65 years, as of February 8, 2014, approximately 60% of reported influenza-related hospitalizations have occurred in persons aged 18–64 years, and 22% of reported influenza-related hospitalizations among women of childbearing age (15–44 years) have occurred in pregnant women (2). Interim results indicate significant protection from vaccination among adults aged 18–64 years. However, early estimates for the 2013–14 season¶ indicated that as of mid-November, only 34% of adults aged 18–64 years had received influenza vaccine this season, compared with 41% of children (aged 6 months–17 years) and 62% of adults aged ≥65 years. Among pregnant women, early estimates for the 2013–14 season indicated that only 41% had been vaccinated by mid-November. A study of pregnant women showed that vaccination during the 2010–11 and 2011–12 seasons significantly reduced influenza-associated medical visits (9). Final 2013-14 influenza season vaccination coverage estimates will be available after the end of the season.
As of February 8, 2014, influenza activity remained elevated nationally and widespread across most of the country. These VE estimates imply that some vaccinated persons will become infected with influenza. Clinicians should maintain a high index of suspicion for influenza infection among persons with ARI while influenza activity is ongoing. Early antiviral treatment can reduce influenza-associated illness severity and complications (3). Early antiviral treatment is recommended for persons with suspected influenza with severe or progressive illness (e.g., hospitalized persons) and those at high risk for complications from influenza,** no matter how severe the illness. Antiviral medications should be used as recommended for treatment in patients with suspected influenza, regardless of vaccination status. The decision to initiate antiviral treatment should not wait for laboratory confirmation of influenza and should not be dependent on insensitive assays, such as rapid influenza diagnostic tests.
The findings in this report are subject to at least four limitations. First, vaccination status included self-report at three of five sites; dates of vaccination were available only for persons with documented vaccination obtained from medical records or immunization registries. Verification of vaccination status at all sites will be available for end-of-season VE estimates, which might differ from interim estimates. Second, information from medical records and immunization registries is needed to evaluate VE for fully versus partially vaccinated children (certain children aged <9 years require 2 vaccine doses) and by vaccine type (e.g., inactivated compared with live attenuated), as well as to evaluate the effects of prior season vaccination; end-of-season analysis of VE for the two most common vaccine types and effects of partial or prior season vaccination is planned. Third, the observational study design has greater potential for confounding and bias than do randomized clinical trials. However, a recent study found that the study design used by the U.S. Flu VE Network produced unbiased VE estimates when applied to analysis of data from randomized placebo-controlled trials (10). In this interim report, adjustment for age, study site, and potential confounding factors identified in previous studies resulted in adjusted estimates that were similar to crude estimates, although final estimates will adjust for additional potential confounders, such as chronic medical conditions, for which information was not available for interim estimates. Finally, end-of-season VE estimates could change as additional patient data become available or if there is a change in circulating viruses late in the season. Also, the VE estimates in this report are limited to the prevention of outpatient medical visits, rather than more severe illness outcomes, such as hospitalization or death; additional studies to measure VE against more severe outcomes are warranted.
Annual vaccination against circulating influenza viruses remains the best strategy for preventing illness from influenza. This report highlights the value of seasonal influenza vaccination and supports ongoing vaccination efforts for all persons aged ≥6 months. Antiviral medications continue to be an important adjunct in the treatment and control of influenza and should be used as recommended, regardless of patient vaccination status.
Acknowledgments
Joshua G. Petrie, MPH, Emileigh Johnson, Rachel T. Cross, MPH, Casey Martens, Marcus Zervos, MD, Lois Lamerato, PhD, Mary Ann Aubuchon, William Fredrick, University of Michigan and Henry Ford Health System, Detroit, Michigan. Jonathan M. Raviotta, MPH, Heather Eng, Stephen R. Wisniewski, PhD, Charles R. Rinaldo, Jr, MD, Arlene Bullotta, Joe Suyama, MD, Evelyn Reis, MD, Donald B. Middleton, MD, Rhett H. Lieberman, MD, Michael Susick, MPH, Krissy K. Moehling, MPH, Mallory Schaffer, University of Pittsburgh Schools of the Health Sciences and UPMC, Pittsburgh, Pennsylvania. Lydia Clipper, Anne Robertson, Kempapura Murthy, MPH, Monica Weir, Hope Gonzales, Martha Zayed, Teresa Ponder, Virginia Gendy, Patricia Sleeth, Sophia V. James, MS, Michael Reis, MD, Cathleen Rivera, MD, David Morgan, MD, Baylor Scott and White Health, Texas A&M University, Health Science Center College of Medicine, Temple, Texas; and Pedro Piedra, MD, Vasanthi Avadhanula, PhD, Baylor College of Medicine, Houston, Texas. C. Hallie Phillips, MEd, Joyce Benoit, Lawrence T. Madziwa, MS, Matt B. Nguyen, MPH, Julia P. Anderson, MA, Group Health Research Institute, Seattle, Washington. Deanna Cole, Donna David, Sarah Kopitzke, MS, Tamara A. Kronenwetter Koepel, Jennifer K. Meece, PhD, Carla Rottscheit, Sandra K. Strey, Maria E. Sundaram, MSPH, Laurel A. Verhagen, Marshfield Clinic Research Foundation, Marshfield, Wisconsin. Jorge M. Dinis, Nicholas W. Florek, Thomas C. Friedrich, PhD, School of Veterinary Medicine, University of Wisconsin-Madison. Erin Burns, MA, Joseph Bresee, MD, Nancy Cox, PhD, Influenza Division, National Center for Immunization and Respiratory Diseases, CDC.
1Influenza Division, National Center for Immunization and Respiratory Diseases, CDC; 2University of Michigan and Henry Ford Health System; 3University of Pittsburgh Schools of the Health Sciences and UPMC; 4Baylor Scott and White Health, Texas A&M University Health Science Center College of Medicine; 5Group Health Research Institute; 6Marshfield Clinic Research Foundation (Corresponding author: Brendan Flannery, bflannery@cdc.gov, 404-718-4276)
References
- CDC. Prevention and control of influenza with vaccines: recommendations of the Advisory Committee on Immunization Practices (ACIP)—United States, 2012–13 influenza season. MMWR 2012;61:613–8.
- CDC. Update: influenza activity—United States, September 29, 2013–February 8, 2014. MMWR 2014;63:148–54.
- CDC. Antiviral agents for the treatment and chemoprophylaxis of influenza: recommendations of the Advisory Committee on Immunization Practices (ACIP). MMWR 2011;60(No. RR-1).
- Ohmit SE, Thompson MG, Petrie JG, et al. Influenza vaccine effectiveness in the 2011–2012 season: protection against each circulating virus and the effect of prior vaccination on estimates. Clin Infect Dis 2014;58:319–27.
- Griffin MR, Monto AS, Belongia EA, et al. Effectiveness of non-adjuvanted pandemic influenza A vaccines for preventing pandemic influenza acute respiratory illness visits in 4 U.S. communities. PLoS One 2011;6:e23085.
- Bateman AC, Kieke BA, Irving SA, Meece JK, Shay DK, Belongia EA. Effectiveness of monovalent 2009 pandemic influenza A virus subtype H1N1 and 2010–2011 trivalent inactivated influenza vaccines in Wisconsin during the 2010–2011 influenza season. J Infect Dis 2013;207:1262–9.
- Treanor JJ, Talbot HK, Ohmit SE, et al. Effectiveness of seasonal influenza vaccines in the United States during a season with circulation of all three vaccine strains. Clin Infect Dis 2012;55:951–9.
- Skowronski DM, Chambers C, Sabaiduc S, et al. Interim estimates of 2013/14 vaccine effectiveness against influenza A (H1N1)pdm09 from Canada's sentinel surveillance network, January 2014. Euro Surveill 2014;19(5).
- Thompson MG, Li DK, Shifflett P, et al. Effectiveness of seasonal trivalent influenza vaccine for preventing influenza virus illness among pregnant women: a population-based case-control study during the 2010–2011 and 2011–2012 influenza seasons. Clin Infect Dis 2014;58:449-57.
- De Serres G, Skowronski DM, Wu XW, Ambrose CS. The test-negative design: validity, accuracy and precision of vaccine efficacy estimates compared to the gold standard of randomised placebo-controlled clinical trials. Euro Surveill 2013;18:20585.
* The U.S. Flu VE Network sites and the date enrollment began were as follows: Group Health Cooperative (Seattle, Washington) (December 9, 2013); the Marshfield Clinic Research Foundation (Marshfield, Wisconsin) (December 23, 2013); the University of Michigan School of Public Health (the University of Michigan School of Public Health, partnered with the University of Michigan Health System, Ann Arbor, and the Henry Ford Health System, Detroit, Michigan [December 9, 2013]); the University of Pittsburgh Schools of the Health Sciences and UPMC (Pittsburgh, Pennsylvania) (December 2, 2013); and Baylor Scott and White Health, Texas A&M University Health Sciences Center College of Medicine (Temple, Texas) (December 10, 2013).
† An influenza vaccine locator tool is available at http://flushot.healthmap.org/?address.
§ Persons at higher risk include 1) children aged <2 years; 2) adults aged ≥65 years; 3) persons with chronic pulmonary conditions (including asthma); cardiovascular disease (except hypertension alone); renal, hepatic, or hematologic (including sickle cell) disease; metabolic disorders (including diabetes mellitus); or neurologic and neurodevelopment conditions (including disorders of the brain, spinal cord, peripheral nerve, and muscle, such as cerebral palsy, epilepsy [seizure disorders], stroke, intellectual disability [mental retardation], moderate to severe developmental delay, muscular dystrophy, or spinal cord injury); 4) persons with immunosuppression, including that caused by medications or by human immunodeficiency virus infection; 5) women who are pregnant or postpartum (within 2 weeks after delivery); 6) persons aged ≤18 years who are receiving long-term aspirin therapy; 7) American Indians/Alaska Natives; 8) persons who are morbidly obese (i.e., body mass index ≥40); and 9) residents of nursing homes and other chronic-care facilities.
¶ Influenza vaccination coverage estimates for the 2013-14 season are available at http://www.cdc.gov/flu/fluvaxview/index.htm.
** A complete summary of guidance for antiviral use is available at http://www.cdc.gov/flu/professionals/antivirals/summary-clinicians.htm.
What is already known on this topic?
The influenza A (H1N1)pdm09 (pH1N1) virus that emerged to cause a pandemic in 2009 has continued to circulate in the United States and has been included as the H1N1 component of all seasonal influenza vaccines since the pandemic. Annual vaccination provides the best protection against circulating influenza viruses and is recommended for all persons aged ≥6 months. Estimates of seasonal influenza vaccine effectiveness (VE) for preventing medically attended illness caused by pH1N1 influenza viruses have ranged from 50% to 80% in previous seasons.
What is added by this report?
Based on data from 2,319 children and adults with acute respiratory illness enrolled in the U.S. Influenza Vaccine Effectiveness Network during December 2, 2013–January 23, 2014, the overall VE (adjusted for study site, age, sex, race/ethnicity, self-rated health, and days from illness onset to enrollment) for all ages against influenza A and B virus infection associated with medically attended acute respiratory illness was 61% (95% confidence interval = 52%–68%). Against the predominant influenza pH1N1 virus, VE for all ages was 62%, with similar protection from medically attended illness across age groups.
What are the implications for public health practice?
The 2013-14 seasonal influenza vaccine provides substantial protection against pH1N1 influenza virus, which has been the predominant influenza virus this season. Persons aged ≥6 months who have not yet received the 2013-14 influenza vaccine should be vaccinated. Evidence of protection offered by the 2013-14 influenza vaccine supports the public health benefit of the recent expansion of annual seasonal influenza vaccination to all persons aged ≥6 months.
FIGURE. Numbers of influenza-positive, medically attended, acute respiratory illness cases and influenza-negative, acute respiratory illness controls, by week of illness onset — U.S. Influenza Vaccine Effectiveness Network, United States, December 2, 2013–January 23, 2014*
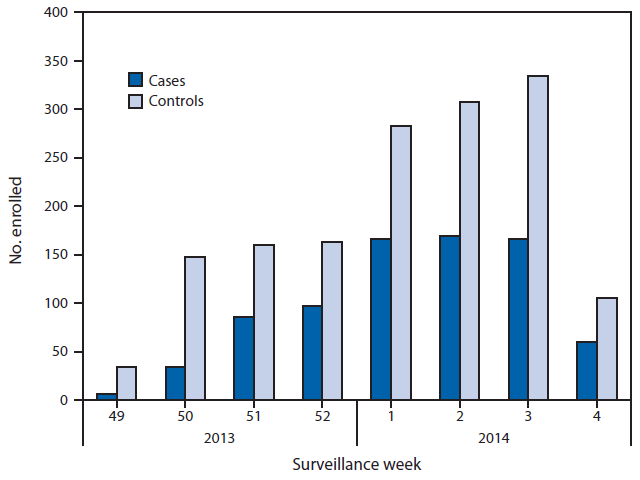
* Week 4 only includes patients with completed laboratory tests and thus does not reflect all enrolled patients during that week across study sites.
Alternate Text: The figure above shows the numbers of influenza-positive, medically attended, acute respiratory illness cases and influenza-negative, acute respiratory illness (ARI) controls, by week of illness onset in the United States during December 2, 2013– January 23, 2014. Of the 2,319 children and adults with ARI enrolled at the five study sites during this period, a total of 784 (34%) tested positive for influenza virus by real-time reverse transcription polymerase chain reaction.
Use of trade names and commercial sources is for identification only and does not imply endorsement by the U.S. Department of
Health and Human Services.
References to non-CDC sites on the Internet are
provided as a service to MMWR readers and do not constitute or imply
endorsement of these organizations or their programs by CDC or the U.S.
Department of Health and Human Services. CDC is not responsible for the content
of pages found at these sites. URL addresses listed in MMWR were current as of
the date of publication.
All MMWR HTML versions of articles are electronic conversions from typeset documents.
This conversion might result in character translation or format errors in the HTML version.
Users are referred to the electronic PDF version (http://www.cdc.gov/mmwr)
and/or the original MMWR paper copy for printable versions of official text, figures, and tables.
An original paper copy of this issue can be obtained from the Superintendent of Documents, U.S.
Government Printing Office (GPO), Washington, DC 20402-9371;
telephone: (202) 512-1800. Contact GPO for current prices.
**Questions or messages regarding errors in formatting should be addressed to
mmwrq@cdc.gov.
