Persons using assistive technology might not be able to fully access information in this file. For assistance, please send e-mail to: mmwrq@cdc.gov. Type 508 Accommodation and the title of the report in the subject line of e-mail.
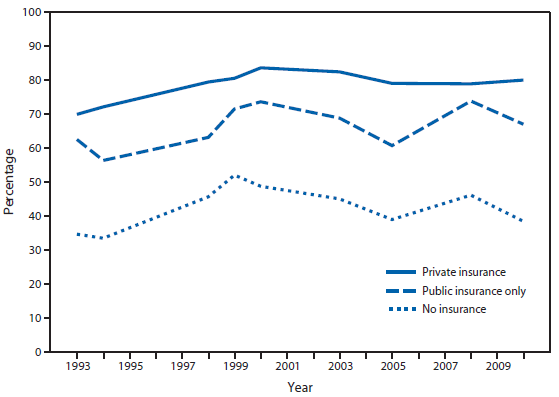
QuickStats: Percentage of Women Aged 50–64 Years Who Reported Receiving a Mammogram in the Past 2 Years, by Health Insurance Status*† — National Health Interview Survey,§ United States, 1993–2010
* Questions concerning mammogram use have differed slightly over the years. Since 2000, respondents were asked for the date of their most recent mammogram; included are women who reported having had a mammogram in the past 2 years. Questions were administered as part of a cancer control supplement conducted in 1993, 1994, 1998, 1999, 2000, 2003, 2005, 2008, and 2010.
† Health insurance status is coverage at the time of interview. Public insurance includes Medicaid, Medicare, Children's Health Insurance Program, military, and other public assistance and government programs. Those with only Indian Health Service coverage are classified as uninsured. Because most women aged ≥65 years are covered by public insurance (Medicare), this figure presents data only for women aged 50–64 years.
§ Data are based on household interviews of a sample of the noninstitutionalized U.S. civilian population.
Alternate Text: The figure above shows the percentage of U.S. women aged 50-64 years who reported receiving a mammogram in the past 2 years during the period 1993-2010, by health insurance status, based on results from the National Health Interview Survey. Insured women were more likely than uninsured women to report having a mammogram in the past 2 years. The percentage of privately insured women reporting a mammogram in the past 2 years rose from 70.0% in 1993 to 83.7% in 2000 and did not change significantly since 2000. Mammogram use among publicly insured and uninsured women aged 50-64 years showed little change from 1993 to 2010 and was consistently lower than mammogram use among privately insured women throughout the period.
During 1993–2010, among women aged 50–64 years, insured women were more likely than uninsured women to report having a mammogram in the past 2 years. The percentage of privately insured women reporting a mammogram in the past 2 years rose from 70.0% in 1993 to 83.7% in 2000 and did not change significantly after 2000. Mammogram use among publicly insured and uninsured women aged 50–64 years varied during the period but was at approximately the same level in 1993 and 2010, and generally was lower than mammogram use among privately insured women. In 2010, 80.1% of women with private insurance, 67.1% of publicly insured women, and 38.5% of uninsured women aged 50–64 years had a mammogram in the past 2 years.
Source: National Health Interview Survey data. Available at http://www.cdc.gov/nchs/nhis/nhis_questionnaires.htm.
Reported by: Hashini Khajuria, MPA, hwq6@cdc.gov, 301-458-4253; Shilpa Bengeri.
Use of trade names and commercial sources is for identification only and does not imply endorsement by the U.S. Department of Health and Human Services.
References to non-CDC sites on the Internet are provided as a service to MMWR readers and do not constitute or imply endorsement of these organizations or their programs by CDC or the U.S.
Department of Health and Human Services. CDC is not responsible for the content of pages found at these sites. URL addresses listed in MMWR were current as of the date of publication.
All MMWR HTML versions of articles are electronic conversions from typeset documents. This conversion might result in character translation or format errors in the HTML version.
Users are referred to the electronic PDF version (http://www.cdc.gov/mmwr) and/or the original MMWR paper copy for printable versions of official text, figures, and tables. An original paper copy of this issue can be obtained from the Superintendent of Documents, U.S. Government Printing Office (GPO), Washington, DC 20402-9371; telephone: (202) 512-1800. Contact GPO for current prices.
**Questions or messages regarding errors in formatting should be addressed to mmwrq@cdc.gov.
