Persons using assistive technology might not be able to fully access information in this file. For assistance, please send e-mail to: mmwrq@cdc.gov. Type 508 Accommodation and the title of the report in the subject line of e-mail.
Vaccination Coverage Among Children in Kindergarten — United States, 2012–13 School Year
State and local school vaccination requirements are implemented to maintain high vaccination coverage and minimize the risk from vaccine preventable diseases (1). To assess school vaccination coverage and exemptions, CDC annually analyzes school vaccination coverage data from federally funded immunization programs. These awardees include 50 states and the District of Columbia (DC), five cities, and eight U.S.-affiliated jurisdictions.* This report summarizes vaccination coverage from 48 states and DC and exemption rates from 49 states and DC for children entering kindergarten for the 2012–13 school year. Forty-eight states and DC reported vaccination coverage, with medians of 94.5% for 2 doses of measles, mumps, and rubella (MMR) vaccine; 95.1% for local requirements for diphtheria, tetanus toxoid, and acellular pertussis (DTaP) vaccination; and 93.8% for 2 doses of varicella vaccine among awardees with a 2-dose requirement. Forty-nine states and DC reported exemption rates, with the median total of 1.8%. Although school entry coverage for most awardees was at or near national Healthy People 2020 targets of maintaining 95% vaccination coverage levels for 2 doses of MMR vaccine, 4 doses of DTaP† vaccine, and 2 doses of varicella vaccine (2), low vaccination and high exemption levels can cluster within communities, increasing the risk for disease. Reports to CDC are aggregated at the state level; however, local reporting of school vaccination coverage might be accessible by awardees. These local-level data can be used to create evidence-based health communication strategies to help parents understand the risks for vaccine-preventable diseases and the benefits of vaccinations to the health of their children and other kindergarteners.
Vaccination coverage among children entering kindergarten is assessed annually by awardees. Each school year, the health department, school nurse, or other school personnel assess the vaccination and exemption status of a census or sample of kindergarteners enrolled in public and private schools to determine vaccination coverage, as defined by state and local school requirements established to protect children from vaccine-preventable diseases. Among the 50 states and DC, 43 awardees used an immunization information system (IIS) as at least one source of data for some of their school assessment. To collect data, 33 awardees used a census of kindergarteners; 11 a sample of schools, kindergarteners, or both; two a voluntary response of schools; and five a mix of methods. Results of the school-level assessments are reported to the health department. Aggregated data are reported to CDC for public and private schools. Data for homeschooled students were not reported to CDC. All estimates of coverage and exemption were weighted based on each awardee's response rates and sampling methodology, unless otherwise noted. Of the 50 states and DC, 12 awardees met CDC standards for school assessment methods in 2012–13.§
Kindergarteners were considered up-to-date for each vaccination if they had received all of the doses required for school entry in their jurisdiction. School entry requirements varied by awardee: all reporting awardees required 2 doses of MMR vaccine; for DTaP vaccine, two awardees required 3 doses, 35 required 4 doses, and 20 required 5 doses; and for varicella vaccine, 13 required 1 dose, 41 required 2 doses, and three did not require varicella vaccination.
The types of exemptions allowed varied by awardee. All reporting awardees allowed medical exemptions, 46 allowed religious exemptions, 18 allowed philosophic exemptions, and two (Mississippi and West Virginia) did not allow exemptions for religious or philosophic reasons. Medical, religious, and philosophic exemptions were reported as the percentage of kindergarteners with each type of exemption. Total exemptions were reported as the percentage of kindergarteners with any exemption.
Overall, among the 48 states and DC that reported 2012–13 school vaccination coverage, median 2-dose MMR vaccination coverage was 94.5% (range: 85.7% in Colorado to ≥99.9% in Mississippi); 20 reported coverage ≥95% (Table 1). Median DTaP vaccination coverage was 95.1% (range: 82.9% in Colorado and Arkansas to ≥99.9% in Mississippi); 25 reported coverage ≥95%. Median 2-dose varicella vaccination coverage among the 36 states and DC requiring and reporting 2 doses was 93.8% (range: 84.6% in Colorado to ≥99.9% in Mississippi); 14 reported coverage ≥95%.
An estimated 91,453 exemptions were reported among a total estimated population of 4,242,558 kindergarteners. Overall, among the 49 states and DC that reported 2012–13 school vaccination exemptions, the percentage of kindergarteners with an exemption was <1% for nine awardees and >4% for 11 awardees (range: <0.1% in Mississippi to 6.5% in Oregon), with a median of 1.8% (Figure; Table 2). The largest increases in total exemptions between 2011–12 and 2012–13 were reported by Georgia and West Virginia, each with an increase of 1.0 percentage point; four states reported decreases of >1.0 percentage points (range: -1.3 in Colorado to -1.6 in New Mexico). Where reported separately, the median medical exemption level was 0.3% (range: <0.1% in five states [Arkansas, Minnesota, Mississippi, North Dakota, and Virginia] to 1.6% in Alaska). Where allowed and reported separately, the median nonmedical exemption level was 1.5% (range: 0.2% in New Mexico to 6.4% in Oregon).
Reported by
Ranee Seither, MPH, Lauren Shaw, MS, Cynthia L. Knighton, Stacie M. Greby, DVM, Shannon Stokley, MPH, Immunization Svcs Div, National Center for Immunization and Respiratory Diseases, CDC. Corresponding contributor: Ranee Seither, rseither@cdc.gov, 404-639-8693.
Editorial Note
Kindergarten vaccination coverage for most reporting awardees remained high and exemption levels remained stable for the 2012–13 school year compared with the 2011–12 school year. Although high levels of vaccination coverage at the awardee level is reassuring, vaccine-preventable disease outbreaks can still occur among clusters of unvaccinated persons at local levels in schools and communities (3,4). Vaccination exemptions have been shown to cluster geographically (5,6). If exemption levels are high in a school or community, the number of unvaccinated kindergarteners might be sufficient to permit transmission of vaccine-preventable diseases, if introduced. Assessing and reporting school vaccination coverage at the local level is critical for state education and health departments to protect kindergarteners and the community from vaccine-preventable diseases. Among the 50 states and DC, a total of 11 awardees reported local-level data online, ensuring that local level data are widely available.¶ These local-level data can be used by health departments and schools to develop health communication strategies based on the specific vaccine-preventable disease risk at a local school caused by low vaccination coverage or high exemption levels.
An exemption does not necessarily imply a child was not vaccinated. More than 99% of the 2006–2007 birth cohorts who became kindergarteners in 2012–13 received at least one vaccine (7). Additionally, in some areas, a parent or guardian may complete the required exemption paperwork if the kindergartener's vaccination history cannot be easily documented at school enrollment (8,9). Less stringent exemption standards have been associated with higher numbers of exemptions (8,9).
School vaccination coverage assessment is a local-level data reporting system required as part of state or local level school vaccination requirements. CDC supports the use of standards to improve the ability to use the school vaccination coverage data to reliably monitor local vaccination coverage, including appropriate sampling methods, data collection by trained staff, and validation. One way to improve the quality of vaccination coverage reporting is to link school vaccination assessment systems to an IIS. In 2011, 45 of 51 awardees allowed schools to obtain data from their IIS, of which 43 awardees reported using the IIS capacity to complete their school vaccination assessment reporting and 20 were able to generate reports for school vaccination coverage (10). Allowing school vaccination assessment systems to link to awardee IIS data can help ensure provider-reported vaccinations are reported to the schools, minimizing the reporting burden on busy parents and schools, and might help health and education departments identify local areas with low levels of vaccination coverage.
The findings in this report are subject to at least two limitations. First, these data are cross-sectional, collected at a single point in the school year. Vaccination and exemption status reflected the child's status at the time of assessment. Some children might have been in the process of receiving required vaccines and final vaccination or exemption status might have changed after the survey was completed. Reports might or might not be updated as a child obtained the required vaccines or claimed an exemption later in the school year. Vaccination and exemption status might not have been reported for every child. Second, data collection and methodology varied by awardee and even by school year for the same awardee. Methods and times for data collection differed, as did requirements for vaccinations and exemptions.
School vaccination assessments provide valuable information for state and local immunization programs about vaccination coverage, exemptions, and clustering of unvaccinated kindergarteners in schools, where the potential for disease transmission is higher. Data at the state level alone can mask areas of undervaccination. Health departments can access and use local school vaccination assessment data to target areas for vaccination interventions during outbreaks of vaccine-preventable disease. This information also can be used by health departments and schools to develop evidence-based health communication strategies and other interventions that protect kindergarteners and the community against vaccine-preventable diseases.
References
- Orenstein W, Hinman A. The immunization system in the United States: the role of school immunization laws. Vaccine 1999;17(Suppl 3):S19–24.
- US Department of Health and Human Services. Healthy people 2020: immunization and infectious diseases. Washington, DC: US Department of Health and Human Services; 2010. Available at http://www.healthypeople.gov/2020/topicsobjectives2020/overview.aspx?topicId=23.
- Gay N. The theory of measles elimination: implications for the design of elimination strategies. J Infect Dis 2004;189(Suppl 1):S27–35.
- CDC. Two measles outbreaks after importation—Utah, March–June 2011. MMWR 2013;62:222–5.
- Sugerman D, Barskey AE, Delea MG, et al. Measles outbreak in a highly vaccinated population, San Diego, 2008: role of the intentionally undervaccinated. Pediatrics 2010;125:747–55.
- Omer SB, Enger KS, Moulton LH, Halsey NA, Stokley S, Salmon DA. Geographic clustering of nonmedical exemptions to school immunization requirements and associations with geographic clustering of pertussis. Am J Epidemiol 2008;168:1389–96.
- CDC. National, state, and local area vaccination coverage among children aged 19–35 months—United States, 2011. MMWR 2012;61:689–96.
- Rota JS, Salmon DA, Rodewald LE, Chen RT, Hibbs BF, Gangarosa EJ. Processes for obtaining nonmedical exemptions to state immunization laws. Am J Public Health 2001;91:645–8.
- Blank N, Caplan A, Constable C. Exempting schoolchildren from immunizations: states with few barriers had highest rates of nonmedical exemptions. Health Aff 2013;32:1282–90.
- CDC. Immunization Information Systems annual report—2011. Atlanta, GA: US Department of Health and Human Services, CDC; 2012. Available at http://www.cdc.gov/vaccines/programs/iis/annual-report-iisar/index.html.
* Vaccination coverage and exemption data were reported to CDC by Guam, the Commonwealth of the Northern Mariana Islands, Palau, Puerto Rico, and the U.S. Virgin Islands. No data were reported by American Samoa, the Marshall Islands, and the Federated States of Micronesia. Data from these U.S.-affiliated jurisdictions were excluded from the national analysis.
† The Healthy People 2020 DTaP vaccination coverage target (IID-10.1) is based on 4 doses of DTaP vaccine. This report describes compliance with state regulations of 3, 4, or 5 doses of DTaP vaccine. Of the 51 awardees, only Nebraska, New York, and Pennsylvania report <4 doses of DTaP vaccine.
§ CDC standards included use of a census or random sample to assess public and private schools or students, assessment using number of doses recommended by the Advisory Committee on Immunization Practices, assessment of vaccination status before December 31, collection of data by health department personnel or school nurses, validation of data collected by school administrative staff, and vaccination documentation from a health-care provider.
¶ Information available, by state, at the following websites: Arizona, http://www.azdhs.gov/phs/immunization/statistics-reports.htm; California, http://www.cdph.ca.gov/programs/immunize/pages/immunizationlevels.aspx; Florida, http://www.doh.state.fl.us/disease_ctrl/immune/resources/surveys/state-surveys.html; Illinois, http://www.isbe.state.il.us/research/htmls/immunization.htm#immu; Iowa, http://www.idph.state.ia.us/immtb/immunization.aspx?prog=imm&pg=auditsl; Kansas, http://www.kdheks.gov/immunize/kindergarten_coverage.htm; New Jersey, http://www.state.nj.us/health/cd/imm_status_report_2012.shtml; Texas, http://www.dshs.state.tx.us/immunize/coverage/schools.shtm; Utah, http://health.utah.gov/immu/statistics/utah%20statistics/immunization%20coverage%20levels/index.html; Vermont, http://healthvermont.gov/hc/imm/ImmSurv.aspx; Washington, http://www.doh.wa.gov/dataandstatisticalreports/schoolimmunization/datareports.aspx.
What is already known on this topic?
Vaccine-preventable diseases continue to be transmitted despite high levels of vaccination at the national and state levels. School vaccination assessment can help local health officials determine the risk for vaccine-preventable disease transmission at the local level.
What is added by this report?
For the 2012–13 school year, median vaccination coverage in the 48 states and the District of Columbia continued to be high, with medians of 94.5% for measles, mumps, rubella; 95.1% for diphtheria, tetanus toxoid, and acellular pertussis; and 93.8% for varicella vaccines. The level of exemptions remained low overall, with a median of 1.8%, and four awardees saw decreases of >1 percentage point for children with exemptions in the 2012–13 school year.
What are the implications for public health practice?
High vaccination coverage levels at the national and state levels might mask clustering of unvaccinated children at local levels where vaccine-preventable diseases might be transmitted. Health departments and school systems can use local-level school vaccination assessment data to identify schools with low vaccination coverage and high exemption levels. This local-level evidence can be used to develop local-level health communication campaigns and other strategies to ensure parents understand vaccine-preventable disease risks and vaccination benefits.
|
TABLE 1. (Continued) Estimated vaccination coverage* among children enrolled in kindergarten, by state/area, type of survey conducted, and selected vaccines — United States, 2012–13 school year |
||||||||
|---|---|---|---|---|---|---|---|---|
|
State/Area |
Estimated kindergarten population |
Total surveyed |
Proportion surveyed (%) |
Type of survey conducted† |
MMR§ (%) |
DTaP/DT¶ (%) |
Varicella |
|
|
1 dose (%) |
2 doses (%) |
|||||||
|
West Virginia |
22,588 |
19,549 |
(86.5) |
Census |
(96.3) |
(96.3) |
— |
(96.2) |
|
Wisconsin |
72,416 |
1,337 |
(1.8) |
2-Stage cluster |
(92.8) |
(96.1) |
— |
(91.1) |
|
Wyoming |
8,133 |
8,133 |
(100.0) |
Census (public) |
(97.5) |
(97.4)*** |
— |
(97.0) |
|
Median††† |
(94.5) |
(95.1) |
(93.8) |
|||||
|
American Samoa |
NA |
NA |
NA |
Not conducted |
|
|
|
|
|
Guam |
2,835 |
1,054 |
(37.1) |
2-Stage cluster |
(89.8) |
(91.2) |
— |
NReq |
|
Marshall Islands |
NA |
NA |
NA |
Not conducted |
|
|
|
|
|
Micronesia |
NA |
NA |
NA |
Not conducted |
|
|
|
|
|
N. Mariana Islands |
847 |
847 |
(100.0) |
Census |
(54.7) |
(92.8) |
— |
(54.7) |
|
Palau |
471 |
471 |
(100.0) |
Census (public) |
(76.2) |
(84.5) |
— |
NReq |
|
Puerto Rico** |
39,106 |
979 |
(2.5) |
2-Stage cluster |
(85.2) |
(81.9) |
— |
(88.7) |
|
U.S. Virgin Islands |
1,498 |
851 |
(56.8) |
2-Stage cluster |
(92.3) |
(78.9) |
— |
(81.9) |
|
Abbreviations: MMR = measles, mumps, and rubella vaccine; DTaP/DT = diphtheria and tetanus toxoids (DT) and acellular pertussis vaccine; NA = not available; NReq = not required for school entry. * Estimates are adjusted for nonresponse and weighted for sampling where appropriate, except where complete data were unavailable. Percentages for Delaware, Georgia, and Puerto Rico are approximations. Estimates for South Carolina and Colorado were provided by the awardee. Estimates based on a completed vaccine series (i.e., not antigen-specific) are designated by use of the ≥ symbol. † Sample designs varied by state/area: census = all schools (public and private) and all children within schools were included in the assessment; simple random = a simple random sample design was used; mixed design = a census was conducted among public schools, and a random sample of children within the schools were selected; 1-stage or 2-stage cluster sample = schools were randomly selected, and all children in the selected schools were assessed (1-stage) or a random sample of children within the schools were selected (2-stage); voluntary response = a census among those schools that sent in assessment data. § Most awardees require 2 doses; California, Illinois, New York, and Oregon require 2 doses of measles, 1 dose of mumps, and 1 dose of rubella. ¶ DTaP vaccination coverage might include some DTP (diphtheria and tetanus toxoids and pertussis) or DT vaccinations if administered in another country or vaccination provider continued to use after 2000. Most awardees require 4 doses of DTaP/DT vaccine; 5 doses are required for school entry in Colorado, District of Columbia, Hawaii, Idaho, Iowa, Kansas, Massachusetts, Minnesota, Mississippi, North Carolina, Oregon, Rhode Island, Texas (including Houston), Vermont, Washington, Wyoming, Northern Mariana Islands, and Puerto Rico; 3 doses are required by Nebraska and New York; 4 doses of DT and 2 doses of pertussis vaccine are required by the U.S. Virgin Islands. Pertussis vaccine is not required in Pennsylvania; the estimate for Pennsylvania represents DT only. ** Awardee counts the vaccine doses received regardless of Advisory Committee on Immunization Practices recommended age and time interval; vaccination coverage rates might be higher than those recommended. †† Vaccination coverage and exemption levels were reported together. Vaccination coverage estimates could not be provided separately for this report. §§ Does not include nondistrict-specific, virtual, and college laboratory schools, or private schools with less than 10 students. ¶¶ For DT only; coverage for pertussis was 92.4%. *** Diphtheria coverage was 97.3%; tetanus and pertussis were 97.4%. ††† The median is the center of the estimates in the distribution. The median does not include Alaska, New Hampshire, Houston, Guam, the Commonwealth of the Northern Mariana Islands, Palau, Puerto Rico, and the U.S. Virgin Islands. |
||||||||
|
TABLE 2. (Continued) Weighted number and percentage* of children enrolled in kindergarten with a reported exemption to vaccination, by state/area and type of exemption — United States, 2012–13 school year |
||||||||||
|---|---|---|---|---|---|---|---|---|---|---|
|
State/Area |
Medical exemptions† |
Nonmedical exemptions† |
Total exemptions† |
|||||||
|
No. |
(%) |
Religious no. |
Philosophic no. |
Total no. |
(%) |
Total no. |
2012–13 (%) |
2011–12 (%) |
Percentage point difference |
|
|
Median§§ |
|
(0.3) |
|
|
|
(1.5) |
|
(1.8) |
(1.5) |
0.3 |
|
American Samoa |
NA |
|
|
|
NA |
|
NA |
|
|
|
|
Guam |
0 |
(0.0) |
0 |
—§ |
0 |
(0.0) |
0 |
(0.0) |
(0.0) |
0.0 |
|
Marshall Islands |
NA |
|
|
|
NA |
|
NA |
|
|
|
|
Micronesia |
NA |
|
|
|
NA |
|
NA |
|
|
|
|
N. Mariana Islands |
1 |
(0.1) |
0 |
—§ |
0 |
(0.0) |
1 |
(0.1) |
(0.0) |
0.1 |
|
Palau |
3 |
(0.6) |
0 |
0 |
0 |
(0.0) |
3 |
(0.6) |
(1.3) |
-0.7 |
|
Puerto Rico |
0 |
(0.0) |
0 |
—§ |
0 |
(0.0) |
0 |
(0.0) |
(0.0) |
0.0 |
|
U.S. Virgin Islands |
0 |
(0.0) |
7 |
—§ |
7 |
(0.6) |
7 |
(0.6) |
(0.5) |
0.1 |
|
Abbreviation: NA = not available (i.e., not tracked or not reported to CDC). * Estimates are adjusted for nonresponse and weighted for sampling where appropriate, except where complete data were unavailable. Percentages for Delaware, Georgia, and Puerto Rico are approximations. Estimates for South Carolina and Colorado were provided by the awardee. Arkansas and Kansas conduct a census of exemptions. † Medical and nonmedical exemptions might not be mutually exclusive. Some children might have both medical and nonmedical exemptions. Total exemptions are the number of children with an exemption. Temporary exemptions are included in the total for Alabama, Hawaii, New York, North Carolina, South Carolina, and Washington. § Exemptions because of philosophic reasons are not allowed. ¶ Religious and philosophic exemptions are not reported separately. ** Exemptions because of religious reasons are not allowed. †† Includes both temporary and permanent medical exemptions. §§ The median is the center of the estimates in the distribution. The median does not include South Carolina, Houston, Guam, the Commonwealth of the Northern Mariana Islands, Palau, Puerto Rico, and the U.S. Virgin Islands. |
||||||||||
FIGURE. Estimated percentage of children enrolled in kindergarten who have been exempted from receiving one or more vaccines* — United States, 2012–13 school year
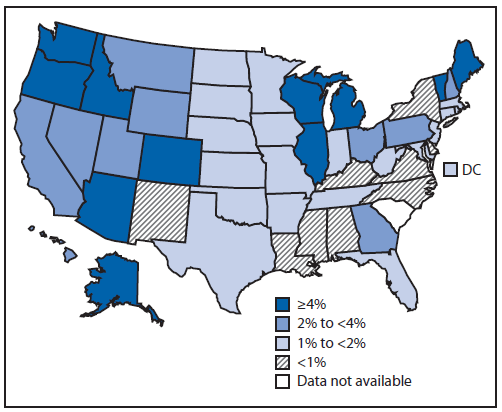
* Exemptions might not reflect a child's vaccination status. Children with an exemption who did not receive any vaccines are indistinguishable from those who have an exemption but are up-to-date for one or more vaccines.
Alternate Text: The figure above shows the estimated percentage of children enrolled in kindergarten who have been exempted from receiving one or more vaccines in the United States during the 2012-13 school year. An estimated 91,453 exemptions were reported among a total estimated population of 4,242,558 kindergarteners. Overall, among the 49 states and District of Columbia that reported 2012-13 school vaccination exemptions, the percentage of kindergarteners with an exemption was <1% for nine awardees and >4% for 11 awardees (range: <0.1% in Mississippi to 6.5% in Oregon), with a median of 1.8%.
Use of trade names and commercial sources is for identification only and does not imply endorsement by the U.S. Department of Health and Human Services.
References to non-CDC sites on the Internet are provided as a service to MMWR readers and do not constitute or imply endorsement of these organizations or their programs by CDC or the U.S.
Department of Health and Human Services. CDC is not responsible for the content of pages found at these sites. URL addresses listed in MMWR were current as of the date of publication.
All MMWR HTML versions of articles are electronic conversions from typeset documents. This conversion might result in character translation or format errors in the HTML version.
Users are referred to the electronic PDF version (http://www.cdc.gov/mmwr) and/or the original MMWR paper copy for printable versions of official text, figures, and tables. An original paper copy of this issue can be obtained from the Superintendent of Documents, U.S. Government Printing Office (GPO), Washington, DC 20402-9371; telephone: (202) 512-1800. Contact GPO for current prices.
**Questions or messages regarding errors in formatting should be addressed to mmwrq@cdc.gov.
