Persons using assistive technology might not be able to fully access information in this file. For assistance, please send e-mail to: mmwrq@cdc.gov. Type 508 Accommodation and the title of the report in the subject line of e-mail.
Incidence and Trends of Infection with Pathogens Transmitted Commonly Through Food — Foodborne Diseases Active Surveillance Network, 10 U.S. Sites, 1996–2012
Foodborne diseases are an important public health problem in the United States. The Foodborne Diseases Active Surveillance Network* (FoodNet) conducts surveillance in 10 U.S. sites for all laboratory-confirmed infections caused by selected pathogens transmitted commonly through food to quantify them and monitor their incidence. This report summarizes 2012 preliminary surveillance data and describes trends since 1996. A total of 19,531 infections, 4,563 hospitalizations, and 68 deaths associated with foodborne diseases were reported in 2012. For most infections, incidence was highest among children aged <5 years; the percentage of persons hospitalized and the percentage who died were highest among persons aged ≥65 years. In 2012, compared with the 2006–2008 period, the overall incidence of infection† was unchanged, and the estimated incidence of infections caused by Campylobacter and Vibrio increased. These findings highlight the need for targeted action to address food safety gaps.
FoodNet conducts active, population-based surveillance for laboratory-confirmed infections caused by Campylobacter, Cryptosporidium, Cyclospora, Listeria, Salmonella, Shiga toxin–producing Escherichia coli (STEC) O157 and non-O157, Shigella, Vibrio, and Yersinia in 10 sites covering 15% of the U.S. population (48 million persons in 2011).§ FoodNet is a collaboration among CDC, 10 state health departments, the U.S. Department of Agriculture's Food Safety and Inspection Service (USDA-FSIS), and the Food and Drug Administration (FDA). Hospitalizations occurring within 7 days of specimen collection date are recorded, as is the patient's vital status at hospital discharge, or at 7 days after the specimen collection date if the patient was not hospitalized. All hospitalizations and deaths that occurred within a 7-day window are attributed to the infection. Surveillance for physician-diagnosed postdiarrheal hemolytic uremic syndrome (HUS), a complication of STEC infection characterized by renal failure, is conducted through a network of nephrologists and infection preventionists and by hospital discharge data review. This report includes 2011 HUS data for persons aged <18 years.
Incidence was calculated by dividing the number of laboratory-confirmed infections in 2012 by U.S. Census estimates of the surveillance population area for 2011.¶ A negative binomial model with 95% confidence intervals (CIs) was used to estimate changes in incidence from 2006–2008 to 2012 and from 1996–1998 to 2012 (1). The overall incidence of infection with six key pathogens for which >50% of illnesses are estimated to be foodborne (Campylobacter, Listeria, Salmonella, STEC O157, Vibrio, and Yersinia) was calculated (2). Trends were not assessed for Cyclospora because data were sparse, or for STEC non-O157 because of changes in diagnostic practices. For HUS, changes in incidence from 2006–2008 to 2011 were estimated.
Incidence and Trends
In 2012, FoodNet identified 19,531 laboratory-confirmed cases of infection (Table 1). The number of infections and incidence per 100,000 population, by pathogen, were as follows: Salmonella (7,800; 16.42), Campylobacter (6,793; 14.30), Shigella (2,138; 4.50), Cryptosporidium (1,234; 2.60), STEC non-O157 (551; 1.16), STEC O157 (531; 1.12), Vibrio (193; 0.41), Yersinia (155; 0.33), Listeria (121; 0.25), and Cyclospora (15; 0.03). As usual, the highest reported incidence was among children aged <5 years for Cryptosporidium and the bacterial pathogens other than Listeria and Vibrio, for which the highest incidence was among persons aged ≥65 years (Table 2).
Among 6,984 (90%) serotyped Salmonella isolates, the top three serotypes were Enteritidis, 1,238 (18%); Typhimurium, 914 (13%); and Newport, 901 (13%). Among 183 (95%) Vibrio isolates with species information, 112 were V. parahaemolyticus (61%), 25 were V. vulnificus (14%), and 20 were V. alginolyticus (11%). Among 496 (90%) serogrouped STEC non-O157 isolates, the most common serogroups were O26 (27%), O103 (23%), and O111 (15%). Among 2,318 (34%) Campylobacter isolates with species information, 2,082 (90%) were C. jejuni, and 180 (8%) were C. coli.
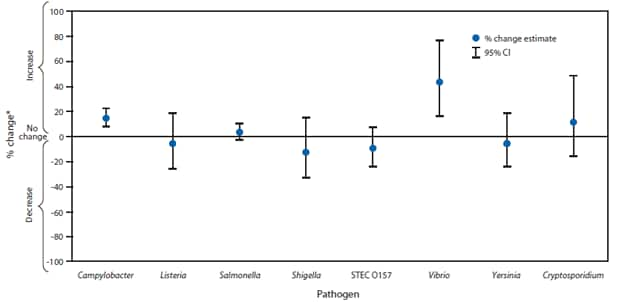
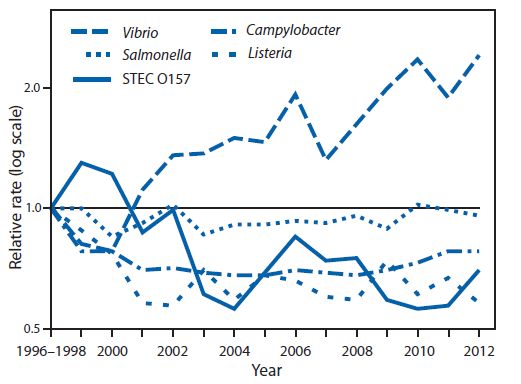
The estimated incidence of infection was higher in 2012 compared with 2006–2008 for Campylobacter (14% increase; confidence interval [CI]: 7%–21%) and Vibrio (43% increase; CI: 16%–76%) and unchanged for other pathogens (Figure 1). In comparison with 1996–1998, incidence of infection was significantly lower for Campylobacter, Listeria, Shigella, STEC O157, and Yersinia, whereas the incidence of Vibrio infection was higher (Figure 2). The overall incidence of infection with six key pathogens** transmitted commonly through food was lower in 2012 (22% decrease; CI: 11%–32%) compared with 1996–1998 and unchanged compared with 2006–2008.
The incidence of infections with specific Salmonella serotypes in 2012, compared with 2006–2008, was lower for Typhimurium (19% decrease; CI: 10%–28%), higher for Newport (23% increase; CI: 1%–50%), and unchanged for Enteritidis. Compared with 1996–1998, the incidence of infection was significantly higher for Enteritidis and Newport, and lower for Typhimurium.
Among 63 cases of postdiarrheal HUS in children aged <18 years (0.57 cases per 100,000 children) in 2011, 33 (52%) occurred in children aged <5 years (1.09 cases per 100,000). Compared with 2006–2008, the incidence was significantly lower for children aged <5 years (44% decrease; CI: 18%–62%) and for children aged <18 years (29% decrease; CI: 4%–47%).
Hospitalizations and Deaths
In 2012, FoodNet identified 4,563 hospitalizations and 68 deaths among cases of infection with pathogens transmitted commonly through food (Table 1). The percentage of patients hospitalized ranged from 15% for Campylobacter to 96% for Listeria infections. The percentage hospitalized was greatest among those aged ≥65 years for STEC O157 (67%), Vibrio (58%), Salmonella (55%), Cyclospora (50%), Shigella (41%), STEC non-O157 (34%), Cryptosporidium (33%), and Campylobacter (31%). At least 95% of patients with Listeria infection in each age group†† with cases were hospitalized. The percentage of patients who died ranged from 0% for Yersinia and Cyclospora to 11% for Listeria infections. The percentage that died was highest among persons aged ≥65 years for Vibrio (6%), Salmonella (2%), STEC O157 (2%), Cryptosporidium (1%), Shigella (1%), and Campylobacter (0.2%).
Reported by
Debra Gilliss, MD, California Dept of Public Health. Alicia B. Cronquist, MPH, Colorado Dept of Public Health and Environment. Matthew Cartter, MD, Connecticut Dept of Public Health. Melissa Tobin-D'Angelo, MD, Georgia Dept of Public Health. David Blythe, MD, Maryland Dept of Health and Mental Hygiene. Kirk Smith, DVM, Minnesota Dept of Health. Sarah Lathrop, PhD, Univ of New Mexico. Shelley Zansky, PhD, New York State Dept of Health. Paul R. Cieslak, MD, Oregon Health Authority. John Dunn, DVM, Tennessee Dept of Health. Kristin G. Holt, DVM, Food Safety and Inspection Svc, US Dept of Agriculture. Susan Lance, Center for Food Safety and Applied Nutrition, Food and Drug Admin. Stacy M. Crim, MPH, Olga L. Henao, PhD, Mary Patrick, MPH, Patricia M. Griffin, MD, Robert V. Tauxe, MD, Div of Foodborne, Waterborne, and Environmental Diseases, National Center for Emerging and Zoonotic Infectious Diseases, CDC. Corresponding contributor: Stacy M. Crim, scrim@cdc.gov, 404-639-2257.
Editorial Note
In 2012, the incidence of infections caused by Campylobacter and Vibrio increased from the 2006–2008 period, whereas the incidence of infections caused by Cryptosporidium, Listeria, Salmonella, Shigella, STEC O157, and Yersinia was unchanged. These findings highlight the need to continue to identify and address food safety gaps that can be targeted for action by the food industry and regulatory authorities.
After substantial declines in the early years of FoodNet surveillance, the incidence of Campylobacter infection has increased to its highest level since 2000. Campylobacter infections are more common in the western U.S. states and among children aged <5 years (3). Although most infections are self-limited, sequelae include reactive arthritis and Guillain-Barré syndrome.§§ Associated exposures include consumption of poultry, raw milk, produce, and untreated water, and animal contact (4,5).
Declines in U.S. campylobacteriosis during 1996–2001 might have been related to measures meat and poultry processors implemented to comply with the Pathogen Reduction and Hazard Analysis and Critical Control Points (HACCP) systems regulations issued by USDA-FSIS in the late 1990s.¶¶ In 2011, USDA-FSIS issued new Campylobacter performance standards for U.S. chicken and turkey processors.*** Continued FoodNet surveillance can help to assess the public health impact of these standards and other changes. Detailed patient exposure information coupled with information on strain subtypes could help in assessing the relative contribution of various sources of infection and the effectiveness of control measures.
Although a significant increase was observed in reported Vibrio infections, the number of such infections remains low (6). Vibrios live naturally in marine and estuarine waters, and many infections are acquired by eating raw oysters (7). These infections are most common during warmer months, when waters contain more Vibrio organisms. Infections can be prevented by postharvest treatment of oysters with heat, freezing, or high pressure (8), or by thorough cooking. Persons who are immunocompromised or have impaired liver function should be informed that consuming raw seafood carries a risk for severe Vibrio infection. Vibrios also cause wound and soft-tissue infections among persons who have contact with water; for example, Vibrio alginolyticus typically causes ear infection (9).
The decrease in incidence of HUS in 2011 compared with 2006–2008 mirrors the decrease in the incidence of STEC O157 infection observed in 2011. The incidence of STEC O157 infection, which had declined since 2006, was no longer decreasing in 2012, and now exceeds the previously met Healthy People 2010 target of one case per 100,000 persons. The continued increase in STEC non-O157 infections likely reflects increasing use by clinical laboratories of tests that detect these infections.
FoodNet surveillance relies on isolation of bacterial pathogens by culture of clinical specimens; therefore, the increasing use of culture-independent tests for Campylobacter and STEC might affect the reported incidence of infection (10). Data on persons with only culture-independent evidence of infection suggests that in 2012, the number of laboratory-identified Campylobacter cases could have been 9% greater and the number of STEC (O157 and non-O157) cases 7%–19% greater than that reported (CDC, unpublished data, 2013). The lack of recent decline in STEC O157 incidence is of concern; continued monitoring of trends in the incidence of HUS and use of culture-independent testing might aid in interpreting future data on STEC O157 incidence.
The findings in this report are subject to at least four limitations. First, health-care–seeking behaviors and other characteristics of the population in the surveillance area might affect the generalizability of the findings. Second, many infections transmitted commonly through food (e.g., norovirus infection) are not monitored by FoodNet because these pathogens are not identified routinely in clinical laboratories. Third, the proportion of illnesses transmitted by nonfood routes differs by pathogen, and the route cannot be determined for individual, nonoutbreak-associated illnesses and, therefore, the data provided in this report do not exclusively relate to infections from foodborne sources. Finally, in some cases counted as fatal, the infection with the enteric pathogen might not have been the primary cause of death.
Most foodborne illnesses can be prevented. Progress has been made in decreasing contamination of some foods and reducing illness caused by some pathogens, as evidenced by decreases in earlier years. In 2010, FDA passed the Egg Safety Rule,††† designed to decrease contamination of shell eggs with Salmonella serotype Enteritidis. In 2011, USDA-FSIS tightened its performance standard for Salmonella contamination to a 7.5% positive rate for whole broiler chickens.§§§ Finally, the Food Safety Modernization Act of 2011 gives FDA additional authority to improve food safety and requires CDC to strengthen surveillance and outbreak response.¶¶¶ Collection of comprehensive surveillance information further supports reductions in foodborne infections by helping to determine where to target prevention efforts, supporting efforts to attribute infections to sources, guiding implementation of measures known to reduce food contamination, and informing development of new measures. Because consumers can bring an added measure of safety during food storage, handling, and preparation, they are advised to seek out food safety information, which is available online.****
Acknowledgments
Workgroup members, Foodborne Diseases Active Surveillance Network (FoodNet), Emerging Infections Program; communications team, Div of Foodborne, Waterborne, and Environmental Diseases, National Center for Emerging and Zoonotic Diseases, CDC.
References
- Henao OL, Scallan E, Mahon B, Hoekstra RM. Methods for monitoring trends in the incidence of foodborne diseases: Foodborne Diseases Active Surveillance Network 1996–2008. Foodborne Pathog Dis 2010;7:1421–6.
- Henao OL, Crim SM, Hoekstra RM. Calculating a measure of overall change in the incidence of selected laboratory-confirmed infections with pathogens transmitted commonly through food, Foodborne Diseases Active Surveillance Network (FoodNet), 1996–2010. Clin Infect Dis 2012;54(Suppl 5):S418–20.
- Samuel MC, Vugia DJ, Shallow S, et al. Epidemiology of sporadic Campylobacter infection in the United States and declining trend in incidence, FoodNet 1996–1999. Clin Infect Dis 2004;38(Suppl 3):S165–74.
- Friedman CR, Hoekstra RM, Samuel M, et al. Risk factors for sporadic Campylobacter infection in the United States: a case-control study in FoodNet sites. Clin Infect Dis 2004;38(Suppl 3):S285–96.
- Taylor EV, Herman KM, Ailes EC, et al. Common source outbreaks of Campylobacter infection in the USA, 1997–2008. Epidemiol Infect 2012;15:1–10 [Epub ahead of print].
- Newton A, Kendall M, Vugia DJ, Henao OL, Mahon BE. Increasing rates of vibriosis in the United States, 1996–2010: review of surveillance data from 2 systems. Clin Infect Dis 2012;54(Suppl 5):S391–5.
- Altekruse SF, Bishop RD, Baldy LM, et al. Vibrio gastroenteritis in the US Gulf of Mexico region: the role of raw oysters. Epidemiol Infect 2000;124:489–95.
- DePaola A, Jones JL, Noe KE, Byars RH, Bowers JC. Survey of postharvest-processed oysters in the United States for levels of Vibrio vulnificus and Vibrio parahaemolyticus. J Food Prot 2009;72:2110–3.
- Dechet AM, Yu PA, Koram N, Painter J. Nonfoodborne Vibrio infections: an important cause of morbidity and mortality in the United States, 1997–2006. Clin Infect Dis 2008;46:970–6.
- Cronquist AB, Mody RK, Atkinson R, et al. Impacts of culture-independent diagnostic practices on public health surveillance for bacterial enteric pathogens. Clin Infect Dis 2012;54(Suppl 5):S432–9.
* Additional information available at http://www.cdc.gov/foodnet.
† The overall incidence of infection combines data for Campylobacter, Listeria, Salmonella, STEC O157, Vibrio, and Yersinia, six key bacterial pathogens for which >50% of illnesses are estimated to be transmitted by food.
§ FoodNet personnel regularly contact clinical laboratories to ascertain all laboratory-confirmed infections in residents of the surveillance areas.
¶ Final incidence rates will be reported when population estimates for 2012 are available.
** Campylobacter, Listeria, Salmonella, STEC O157, Vibrio, and Yersinia.
†† Age groups defined as <5 years, 5–9 years, 10–19 years, 20–64 years, and ≥65 years.
§§ Additional information available at http://www.who.int/mediacentre/factsheets/fs255/en/index.html.
¶¶ Additional information available at http://www.fsis.usda.gov/oppde/rdad/frpubs/93-016f.pdf.
*** Additional information is available at http://www.fsis.usda.gov/science/haccp_verification_campylobacter_results_2011/index.asp.
††† Additional information available at http://www.fda.gov/food/guidanceregulation/guidancedocumentsregulatoryinformation/eggs/ucm170615.htm.
§§§ Additional information available at http://www.gpo.gov/fdsys/pkg/FR-2011-03-21/pdf/2011-6585.pdf.
¶¶¶ Additional information available at http://www.fda.gov/food/guidanceregulation/fsma/ucm242500.htm.
**** Additional food safety information is available at http://www.cdc.gov/winnablebattles/foodsafety/index.html, http://www.foodsafety.gov and http://www.fightbac.org.
What is already known on this topic?
The incidence of infections transmitted commonly by food that are tracked by the Foodborne Diseases Active Surveillance Network (FoodNet) has changed little in recent years. Foodborne illness continues to be an important public health problem.
What is added by this report?
Preliminary surveillance data show that the incidence of infections caused by Campylobacter and Vibrio increased in 2012, whereas incidence of other foodborne infections tracked by FoodNet was unchanged (i.e., Cryptosporidium, Listeria, Salmonella, Shigella, Shiga toxin–producing Escherichia coli O157, and Yersinia).
What are the implications for public health practice?
Reducing the incidence of foodborne infections will require commitment and action to implement measures known to reduce contamination of food and to develop new measures. Farmers, the food industry, regulatory agencies, the food service industry, consumers, and public health authorities all have a role.
FIGURE 1. Estimated percentage change in incidence of laboratory-confirmed bacterial and parasitic infections in 2012 compared with average annual incidence during 2006–2008, by pathogen — Foodborne Diseases Active Surveillance Network, United States
Abbreviations: CI = confidence interval; STEC = Shiga toxin–producing Escherichia coli.
* No significant change = 95% CI is both above and below the no change line; significant increase = estimate and entire CI are above the no change line; significant decrease = estimate and entire CI are below the no change line.
Alternate Text: The figure above shows the estimated percentage change in incidence of laboratory-confirmed bacterial and parasitic infections in the United States in 2012, compared with average annual incidence during 2006-2008, by pathogen. The estimated incidences of infection were higher in 2012 compared with 2006-2008 for Campylobacter (14% increase; 95% confidence interval: 7%-21%) and Vibrio (43% increase; 95% confidence interval: 16%-76%) and unchanged for other pathogens.
FIGURE 2. Relative rates of laboratory-confirmed infections with Campylobacter, STEC* O157, Listeria, Salmonella, and Vibrio compared with 1996–1998 rates, by year — Foodborne Diseases Active Surveillance Network, United States, 1996–2012†
* Shiga toxin–producing Escherichia coli.
† The position of each line indicates the relative change in the incidence of that pathogen compared with 1996–1998. The actual incidences of these infections cannot be determined from this figure.
Alternate Text: The figure above shows relative rates of laboratory-confirmed infections with Campylobacter, Shiga toxin-producing Escherichia coli (STEC) O157, Listeria, Salmonella, and Vibrio in the United States during 1996-2012, compared with 1996-1998 rates, by year. In comparison with 1996-1998, incidence of infection was significantly lower for Campylobacter, Listeria, Shigella, STEC O157, and Yersinia, whereas incidence of Vibrio infection was higher.
Use of trade names and commercial sources is for identification only and does not imply endorsement by the U.S. Department of
Health and Human Services.
References to non-CDC sites on the Internet are
provided as a service to MMWR readers and do not constitute or imply
endorsement of these organizations or their programs by CDC or the U.S.
Department of Health and Human Services. CDC is not responsible for the content
of pages found at these sites. URL addresses listed in MMWR were current as of
the date of publication.
All MMWR HTML versions of articles are electronic conversions from typeset documents.
This conversion might result in character translation or format errors in the HTML version.
Users are referred to the electronic PDF version (http://www.cdc.gov/mmwr)
and/or the original MMWR paper copy for printable versions of official text, figures, and tables.
An original paper copy of this issue can be obtained from the Superintendent of Documents, U.S.
Government Printing Office (GPO), Washington, DC 20402-9371;
telephone: (202) 512-1800. Contact GPO for current prices.
**Questions or messages regarding errors in formatting should be addressed to
mmwrq@cdc.gov.
