Vital Signs: Unintentional Injury Deaths Among Persons Aged 0–19 Years — United States, 2000–2009
Abstract
Background: Unintentional injuries are the leading cause of death in the United States for persons aged 1–19 years and the fifth leading cause of death for newborns and infants aged <1 year. This report describes 10-year trends in unintentional injury deaths among persons aged 0–19 years.
Methods: CDC analyzed 2000–2009 mortality data from the National Vital Statistics System by age group, sex, race/ethnicity, injury mechanism, and state.
Results: From 2000 to 2009, the overall annual unintentional injury death rate decreased 29%, from 15.5 to 11.0 per 100,000 population, accounting for 9,143 deaths in 2009. The rate decreased among all age groups except newborns and infants aged <1 year; in this age group, rates increased from 23.1 to 27.7 per 100,000 primarily as a result of an increase in reported suffocations. The poisoning death rate among teens aged 15–19 years nearly doubled, from 1.7 to 3.3 per 100,000, in part because of an increase in prescription drug overdoses (e.g., opioid pain relievers). Childhood motor vehicle traffic–related death rates declined 41%; however, these deaths remain the leading cause of unintentional injury death. Among states, unintentional injury death rates varied widely, from 4.0 to 25.1 per 100,000 in 2009.
Conclusions and Implications for Public Health Practice: Although the annual rate is declining, unintentional injury remains the leading cause of death among children and adolescents in the United States, led by motor vehicle traffic–related deaths. Death rates from infant suffocation and teen poisoning are increasing. The 2012 National Action Plan for Child Injury Prevention provides actions in surveillance, research, communication, education, health care, and public policy to guide efforts in saving lives by reducing injuries.
Introduction
Unintentional injuries are the leading cause of death in the United States among persons aged 1–19 years, accounting for 37% of all deaths in this age group in 2009, and the fifth leading cause of death among newborns and infants aged <1 year (1). Unintentional injury deaths are responsible for more years of potential life lost before age 65 years than cancer, heart disease, or any other cause of death, in part because children and adolescents die from unintentional injuries much more commonly than other causes (1). For every childhood injury death, more than 1,000 are treated or receive medical consultation for a nonfatal injury (2). In 2009, child and adolescent unintentional injuries resulted in approximately 9,000 deaths, 225,000 hospitalizations, and 8.4 million patients treated and released from emergency departments (1). Unintentional injuries occurring in 2005 that resulted in death, hospitalization, or an emergency department visit cost nearly $11.5 billion in medical expenses (1). These injuries are preventable (3,4), and effective interventions for reducing childhood injuries are less costly than the medical expenses and productivity losses associated with those injuries (5).
The high incidence and preventability of child and adolescent unintentional injuries highlight the need for public health action. Although unintentional injury death rates have decreased in recent decades (6), rates remain high in some population subgroups and states (7). This report summarizes trends in unintentional injury deaths among persons aged 0–19 years, from 2000 to 2009, by age group, sex, race/ethnicity, injury mechanism, and state, using data from the National Vital Statistics System.
Methods
CDC's National Vital Statistics System collects death certificate data from 50 states and the District of Columbia.* Annual mortality files were analyzed for deaths among persons aged 0–19 years. Unintentional injury deaths were defined as those with an underlying cause of death classified by International Classification of Diseases, 10th Revision (ICD-10) external cause of injury codes as V01–X59 or Y85–Y86. Deaths were categorized by mechanism as drowning, fall, fire/burn, motor vehicle traffic–related, other transportation-related, poisoning, suffocation, and all other, using the external cause-of-injury mortality matrix.† Motor vehicle traffic-related deaths were divided further into occupant, pedestrian, pedal cyclist, unspecified, and all other motor vehicle traffic–related deaths. Race/ethnicity was coded into five mutually exclusive categories: Hispanic (of any race), and four non-Hispanic racial groups (white, black, American Indian/Alaska Native, and Asian/Pacific Islander). Annual death rates were calculated using population totals from the U.S. Census.§ Weighted least squares regression was used to test for linear trends in death rates over time, using all years of data. A p value of <0.05 indicated statistical significance.
Results
From 2000 to 2009, the overall annual unintentional injury death rate declined 29% among persons aged 0–19 years, from 15.5 to 11.0 per 100,000 (Table 1). The rate for males was higher than that for females in each age group. Among both males and females, the death rate declined 29%: from 19.9 to 14.1 per 100,000 for males and from 10.8 to 7.7 per 100,000 for females. A significant linear decline across all racial/ethnic groups was observed, with declines ranging from 21% among blacks to 38% among Asian/Pacific Islanders (Table 1). American Indian/Alaska Natives had the highest death rate throughout the study period, at 30.4 per 100,000 in 2000 and 23.8 in 2009, nearly double that of blacks (16.2 and 12.8), the population with the next highest rates in 2009.
By injury mechanism, motor vehicle traffic–related death rates decreased 41%, from 9.3 to 5.5 per 100,000, yet that category recorded the most deaths in 2000 (7,497) and 2009 (4,564) to remain the leading cause of unintentional injury death among persons aged 0–19 years. Drowning, other transportation, fire/burn, fall, and all other unintentional injuries also showed significant linear declines, whereas both suffocation and poisoning showed significant linear increases (30% and 80%, respectively) (Table 1).
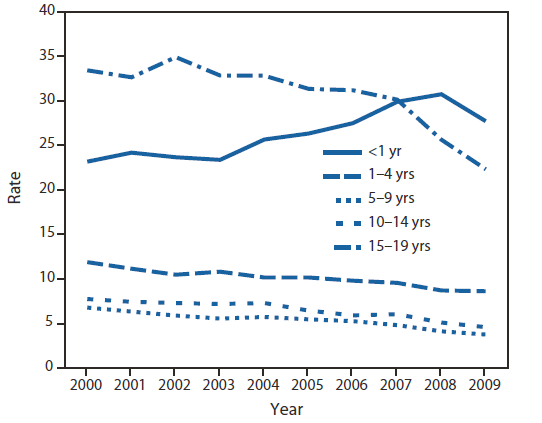
Death rates varied substantially by age group and mechanism, with the highest rates in the youngest (aged <1 year) and oldest (15–19 years) age groups (Figure). The overall rate decreased among all age groups except children aged <1 year, whose death rate increased from 23.1 to 27.7 per 100,000, surpassing rates among persons aged 15–19 years (Table 2). This increase can be attributed largely to a rise in suffocation death rates,¶ which increased from 13.8 to 21.3 per 100,000, claiming the lives of 907 newborns and infants in 2009. The death rate for those aged 15–19 years declined 33%, from 33.4 to 22.3 per 100,000, most notably as a result of a 41% decline in motor vehicle traffic–related death rates from 25.3 to 15.1 per 100,000. However, poisoning death rates in the 15–19 year age group increased by 91%, from 1.7 to 3.3 per 100,000 over the same period (Table 2).
Wide variations in death rates were found among states, with 2009 rates ranging from 4.0 per 100,000 in Massachusetts and 4.5 in New Jersey to 23.6 per 100,000 in South Dakota and 25.1 in Mississippi (Table 3). In 11 states, death rates were significantly lower than the overall national rate of 11.0 per 100,000, and 21 states had rates that were significantly higher than 11.0. No states had significant linear increases in child and adolescent unintentional injury death rates; however, 31 states showed significant linear decreases. The largest decreases occurred in Delaware, Oregon, Iowa, and Virginia, where rates declined by at least 45%.
Conclusions and Comments
This report is the first from CDC to describe trends over time in child and adolescent unintentional injury deaths by mechanism and state. Population subgroup results generally are consistent with previous research. For example, males had higher death rates than females in each age group, racial/ethnic differences were observed with the highest rates among American Indians/Alaska Natives, and motor vehicle traffic–related injuries were the leading cause of unintentional injury death among the three oldest age groups (7,8). The wide variations in death rates among states suggest that environment, exposure to hazards (e.g., vehicle miles traveled, exposure to water settings, urban or rural environment), and differences in public policy might play a role. In 2009, if the overall national rate had been equal to the lowest state unintentional injury death rate, 5,785 lives would have been saved.
The high incidence of infant suffocation underscores the importance of a safe sleeping environment as recommended by the American Academy of Pediatrics, which includes supine positioning, a firm sleep surface, room-sharing without bed-sharing, and avoiding loose bedding (9). CDC has developed the Sudden Unexpected Infant Death (SUID) Case Registry, aimed at better understanding and ultimately preventing SUID deaths, which include suffocation in bed.**
The increasing trend in poisoning deaths among those aged 15–19 years is consistent with the reported increases in drug poisoning deaths seen in the U.S. population overall during this period (10). Poisoning deaths from prescription drug misuse is a growing concern (11); during 2002–2004 an estimated 13.5% of those aged 12–17 years reported ever having misused prescription drugs (12). The percentage of poisoning deaths among those aged 15–19 years with prescription drugs as a contributing cause increased from 30% in 2000 to 57% in 2009 (13). Strategies to reduce the misuse of prescription drugs include appropriate prescribing, proper storage and disposal, discouraging medication sharing, and state-based prescription drug monitoring programs (11).
Improvements in seat belt use, child safety seat and booster seat use, licensing requirements, vehicle design, the road environment, and reductions in alcohol-impaired driving likely contributed to the decline in motor vehicle traffic–related deaths (4,14). Despite this success, traffic crashes remain the leading cause of death for persons in age groups 5–19 years, accounting for 67% of unintentional injury deaths and 28% of deaths from all causes among those aged 15–19 years in 2009 (1). Increasing seat belt use and implementing components of graduated driver licensing practices, such as limiting nighttime driving and limiting teen passengers, likely can lead to further declines. Parents can learn how to reduce their teens' risks of motor vehicle-related injury through the CDC's teen driving initiative, Parents are the Key (http://www.cdc.gov/parentsarethekey/index.html). For communities, the Guide to Community Preventive Services provides evidenced-based strategies to reduce motor vehicle traffic–related injuries (e.g., laws mandating child safety seat use and primary enforcement of seat belt use, and multiple measures to reduce alcohol-impaired driving) (http://www.thecommunityguide.org/mvoi/index.html).
Even with the reported declines, the U.S. unintentional injury death rate among persons aged 0–19 years does not compare favorably with other developed countries. Among the 34 Organization for Economic Cooperation and Development countries, the U.S. unintentional injury death rate for persons aged 0–14 years ranked 30th in 2008, with a rate four times higher than the top performing nations (15). Among persons aged 0–19 years, unintentional injury death rates in 2004 in the United States were almost twice the combined rates of high-income countries in the World Health Organization's European and Western Pacific Regions (4).
The findings in this report are subject to at least two limitations. First, fatalities are based on death certificate data and are subject to misclassification errors if a mechanism is not specified correctly on the death certificate or if classification standards have changed over time. For example, challenges in distinguishing between sudden infant death syndrome and suffocation combined with reporting differences among those completing death certificates might be contributing factors in the increase in reported suffocation deaths among newborns and infants (9). Second, this report is limited to unintentional injury deaths; excluding nonfatal injuries substantially underreports the total burden from injury on society and the medical care system (1).
The frequency and cost of child and adolescent unintentional injury deaths, along with the effectiveness of existing public health interventions, make injury prevention a priority for improving the health of children and adolescents. Efforts to prevent these deaths likely will result in fewer nonfatal injuries as well. Although unintentional injury death rates are declining, findings reported here demonstrate the need to take further action. CDC has developed the Protect the Ones You Love Initiative to help parents reduce unintentional injuries from burns, drowning, falls, poisonings, motor vehicle crashes, suffocation, and sports (http://www.cdc.gov/safechild). Health-care providers, educators, community members and others also can take steps to reduce child injury. CDC and its partners have released the National Action Plan for Child Injury Prevention, providing actions in surveillance, research, communication, education, health care, and public policy (http://www.cdc.gov/safechild/nap). Implementing the National Action Plan could result in significant reductions in needless deaths, injuries, and costs associated with injuries among children and adolescents in the United States.
Reported by
Julie Gilchrist, MD, Michael F. Ballesteros, PhD, Division of Unintentional Injury Prevention, National Center for Injury Prevention and Control, Erin M. Parker, PhD, EIS Officer, CDC. Corresponding contributor: Erin M. Parker, eparker@cdc.gov, 770-488-8477.
References
- CDC. Web-based Injury Statistics Query and Reporting System (WISQARS). Atlanta, GA: US Department of Health and Human Services, CDC; 2009. Available at http://www.cdc.gov/injury/wisqars/index.html. Accessed March 13, 2012.
- National Center for Health Statistics. National Health Interview Survey 2009 data release. Hyattsville, MD: CDC, National Center for Health Statistics; 2010. Available at http://www.cdc.gov/nchs/nhis/nhis_2009_data_release.htm. Accessed March 13, 2012.
- Doll LS, Bonzo SE, Mercy JA, Sleet DA, eds. Handbook of injury and violence prevention. New York, NY: Springer; 2007.
- Peden M, Oyegbite K, Ozanne-Smith J, Hyder AA, Branche C, Rahman AKM, et al., eds. World report on child injury prevention. Geneva, Switzerland: World Health Organization; 2008. Available at http://www.who.int/violence_injury_prevention/child/injury/world_report/report/en/index.html. Accessed March 13, 2012.
- Miller TR, Finkelstein AE, Zaloshnja E, Hendrie D. The cost of child and adolescent injuries and the savings from prevention. In: Liller KD, ed. Injury prevention for children and adolescents: research, practice, and advocacy. 2nd ed. Washington, DC: American Public Health Association 2012.
- Singh G, Kogan M. Widening socioeconomic disparities in U.S. childhood mortality, 1969–2000. Am J Public Health 2007;97:1658–65.
- Borse N, Gilchrist J, Dellinger A, Rudd R, Ballesteros M, Sleet D. CDC childhood injury report: patterns of unintentional injuries among 0–19 year olds in the United States, 2000–2006. Atlanta, GA: US Department of Health and Human Services, CDC; 2008. Available at http://www.cdc.gov/safechild/childhoodinjuryreport/index.html. Accessed March 13, 2012.
- Ballesteros MF, Sleet DA. Epidemiology of injuries among children and adolescents: focus on unintentional injuries. In: Liller KD, ed. Injury prevention for children and adolescents: research, practice, and advocacy. 2nd ed. Washington, DC: American Public Health Association 2012.
- Task force on Sudden Infant Death Syndrome. Moon RY. SIDS and other sleep-related infant deaths: expansion of recommendations for a safe infant sleeping environment. Pediatrics 2011;128:1030–9.
- Warner M, Chen LH, Makuc DM, Anderson RN, Miniño AM. Drug poisoning deaths in the United States, 1980–2008. NCHS data brief no. 81. Hyattsville, MD: CDC, National Center for Health Statistics; 2011. Available at http://www.cdc.gov/nchs/data/databriefs/db81.htm. Accessed March 13, 2012.
- CDC. Vital signs: overdoses of prescription opioid pain relievers —United States, 1999–2008. MMWR 2011;60:1487–92.
- Colliver JD, Kroutil LA, Dai L, Gfroerer JC. Office of Applied Studies. Misuse of prescription drugs: Data from: 2002–2004 national surveys on drug use and health. Table 5. Rockville, MD: Substance Abuse and Mental Health Services Administration, Office of Applied Studies; 2006. Available at http://www.oas.samhsa.gov/prescription/appd.htm#tab5-2b. Accessed March 13, 2012.
- CDC. WONDER [Database]. Atlanta, GA: US Department of Health and Human Services, CDC; 2011. Available at http://wonder.cdc.gov/mcd-icd10.html. Accessed April 9, 2012.
- Longthorne A, Subramanian R, Chen CL. An analysis of the significant decline in motor vehicle traffic crashes in 2008. DOT HS 811 346. Washington, DC: National Highway Traffic Safety Administration; 2010. Available at http://www-nrd.nhtsa.dot.gov/pubs/811346.pdf. Accessed March 13, 2012.
- Global Health Observatory Data Repository. Mortality and burden of disease: disease and injury country estimates, 2008, by sex and age. Available at http://apps.who.int/ghodata. Accessed February 16, 2010.
* Additional information available at http://www.cdc.gov/nchs/nvss.htm.
† Additional information available at http://www.cdc.gov/nchs/injury/injury_tools.htm.
§ Additional information available at http://www.cdc.gov/nchs/nvss/bridged_race.htm.
¶ "Suffocation" refers to ICD-10 codes W75–W84. In 2009 73% of infant and newborn suffocation deaths were coded W75: accidental suffocation or strangulation in bed.
** Additional information available at http://www.cdc.gov/sids/suidabout.htm.
|
Key Points |
|
Figure. Annual unintentional injury death rates* among persons aged ≤19 years, by age group — National Vital Statistics System, United States, 2000–2009
* Per 100,000 population.
Alternate Text: The figure above shows annual unintentional injury death rates among persons aged ≤19 years, by age group in the United States, during 2000-2009, according to the National Vital Statistics System. Death rates varied substantially by age group and mechanism, with the highest rates in the youngest (aged <1 year) and oldest (15-19 years) age groups.
Use of trade names and commercial sources is for identification only and does not imply endorsement by the U.S. Department of
Health and Human Services.
References to non-CDC sites on the Internet are
provided as a service to MMWR readers and do not constitute or imply
endorsement of these organizations or their programs by CDC or the U.S.
Department of Health and Human Services. CDC is not responsible for the content
of pages found at these sites. URL addresses listed in MMWR were current as of
the date of publication.
All MMWR HTML versions of articles are electronic conversions from typeset documents.
This conversion might result in character translation or format errors in the HTML version.
Users are referred to the electronic PDF version (http://www.cdc.gov/mmwr)
and/or the original MMWR paper copy for printable versions of official text, figures, and tables.
An original paper copy of this issue can be obtained from the Superintendent of Documents, U.S.
Government Printing Office (GPO), Washington, DC 20402-9371;
telephone: (202) 512-1800. Contact GPO for current prices.
**Questions or messages regarding errors in formatting should be addressed to
mmwrq@cdc.gov.
