Persons using assistive technology might not be able to fully access information in this file. For assistance, please send e-mail to: mmwrq@cdc.gov. Type 508 Accommodation and the title of the report in the subject line of e-mail.
Vaccination Coverage Among Children in Kindergarten — United States, 2011–12 School Year
Please note: An erratum has been published for this article. To view the erratum, please click here.
In 2011, CDC reported 17 outbreaks of measles and 222 measles cases, most of which were imported cases in unvaccinated persons. This was the highest number of measles cases in any year in the United States since 1996 and highlights the importance of monitoring measles vaccination coverage at the local level (1). To identify areas of undervaccination for measles and other vaccine-preventable diseases, state and local health departments monitor compliance with school immunization requirements using annual school vaccination assessment reports, supported as a CDC immunization funding objective for the 64 grantees, including the 50 states, the District of Columbia (DC), five cities, and eight other reporting areas. CDC also monitors progress toward meeting Healthy People 2020 objectives (2) for the vaccination of children entering kindergarten. This report summarizes vaccination coverage, exemption rates, and reporting methods from the 2011–12 school year kindergarten vaccination assessments submitted by 56 grantees, including 49 states, DC, one city, and five other reporting areas. Median coverage with 2 doses of measles, mumps, and rubella (MMR) vaccine was 94.8% among 47 reporting states and DC. Total exemption rates, including medical, religious, and philosophic exemptions, among 49 reporting states and DC, ranged from <0.1% to 7.0% (median: 1.5%). Although statewide levels of vaccination coverage are at or very near target levels, locally low vaccination coverage for extremely transmissible diseases such as measles remains a threat to health. Monitoring MMR vaccination coverage at the local and state level will continue to be critical as long as the risk for measles importation and outbreaks exist.
Healthy People 2020 objectives include maintaining vaccination coverage among children in kindergarten (objective IID-10) and increasing the number of states (including DC) collecting kindergarten vaccination coverage data in accordance with CDC minimum standards (objective IID-19) (2).* The coverage target is ≥95% vaccination coverage for the following vaccines: MMR; diphtheria, tetanus toxoid, and acellular pertussis (DTaP)†; poliovirus; hepatitis B (HepB); and varicella. The reporting target is 50 states and DC collecting kindergarten vaccination coverage data in accordance with CDC minimum standards.
Vaccination coverage among children entering school is assessed annually by federal immunization grantees. Generally, at the start of the school year, health department or school personnel conduct a vaccination coverage survey or census of enrolled students to determine compliance with school requirements established to protect children from vaccine-preventable diseases. Children receiving an exemption to school requirements are included as enrolled students. Results of the school-level reviews are reported to the grantee health department, which then reports aggregated totals to CDC; not all states reported both vaccination coverage levels and exemption rates. All 54 grantees reporting vaccination coverage by vaccine assessed public schools, and all but North Dakota, Oklahoma, and Palau included private schools in their assessments (Table 1). Surveys were completed by census (36 grantees) or a sample (20 grantees). For grantees surveying <95% of the population of enrolled kindergarten students, data were weighted based on the estimated size of the population of children in kindergarten. Survey methods varied across grantees; however, 20 of the grantees targeted by the Healthy People 2020 objective collected data in accordance with CDC minimum standards.
Vaccination status of kindergarteners was considered up-to-date if they had received all of the vaccine doses required for school entry in their state or area. All reporting grantees required 2 doses of MMR vaccine and 3 or 4 doses of poliovirus vaccine. School entry requirements for other vaccinations varied by grantee: 52 grantees required 4 or 5 doses of DTaP vaccine, 50 grantees required 3 doses of HepB vaccine, and 13 grantees required 1 dose and 37 grantees required 2 doses of varicella vaccine.§ The types of exemptions and the process for obtaining exemptions varied by grantee (3). All reporting grantees allowed medical exemptions, 47 allowed religious exemptions, and 20 allowed philosophic exemptions; two grantees (Mississippi and West Virginia) did not allow exemptions for religious or philosophic reasons. Exemption data reported to CDC were nonspecific; exemptions for one vaccine, a required vaccine dose, or for all required vaccines were not differentiated by type of exemption. Vaccination and/or exemption status might not have been reported as final for each surveyed child because some children might have been in the process of obtaining required vaccines and final vaccination and/or exemption status might have been updated after the survey was completed.
Overall, among grantees in the 47 states and DC that reported 2011–12 school vaccination coverage, median MMR vaccination coverage was 94.8%, with a range of 86.8% in Colorado to 99.3% in Texas; four jurisdictions of these grantees reported <90% MMR coverage (Table 1). Median coverage with 2 doses of varicella vaccine among 33 grantees reporting was 93.2%, with a range of 84.0% in Colorado to 99.2% in Mississippi and Texas. The median coverage levels for DTaP, poliovirus, and HepB vaccines all were at or above the Healthy People 2020 target of 95%.
Overall, among the grantees in the 49 states and DC that reported exemptions for the 2011–12 school year, 10 reported <1%, and nine reported >4% total exemption rates (Figure), with a range of <0.1% in Mississippi to 7.0% in Alaska (Table 2). An estimated 89,133 exemptions were reported, for a total estimated population of 4,124,185 kindergarten children. The median total exemption level was 1.5%, a median increase of 0.2 percentage points compared with the 2009–10 school year. The largest increase in exemption levels was reported by Arkansas, with an increase of 3.4 percentage points; the largest decrease was reported by Nebraska, with a decrease of 2.3 percentage points. Where reported separately, the median medical exemption level was 0.3 %, with a range of 0.0% in New Mexico and North Dakota to 1.3% in DC. Where allowed and reported separately, the median nonmedical exemption level was 1.2 %, with a range of 0.04% in Delaware and Kentucky to 5.8% in Oregon.
Reported by
Stacie M. Greby, DVM, Karen G. Wooten, MA, Cynthia L. Knighton, Bob Avey, Shannon Stokley, MPH, Immunization Services Div, National Center for Immunization and Respiratory Diseases, CDC. Corresponding contributor: Stacie M. Greby, sgreby@cdc.gov, 404-639-6069.
Editorial Note
Sustaining high vaccination coverage among school children is vital to prevent outbreaks and avoid reestablishment of diseases that have been eliminated in the United States. The median MMR and 2-dose varicella vaccination coverage levels for children entering kindergarten for the 2011–12 school year were below the Healthy People 2020 target of ≥95%. The high number of measles cases reported in Europe in 2011 contributed to record numbers of imported cases in the United States (1). Among the U.S. measles cases in persons aged 16 months through 19 years reported in 2011, 76% were in persons not vaccinated for a nonmedical reason (1). Achieving high MMR vaccination coverage rates early in life, including >90% 1-dose coverage at age 12–15 months and >95% 2-dose coverage among school-aged children, is essential to maintain measles elimination in the United States (4). Although median MMR vaccination coverage among children entering kindergarten was close to the ≥95% target, MMR vaccination coverage and exemptions aggregated at national or state levels can mask substantial vulnerability at the local level. Since exemptions cluster geographically (5,6), there might be smaller areas and schools where low levels of immunization could sustain ongoing measles transmission after importation from other countries.
Exemption levels continue to be low overall; however, these low levels are aggregated at the state level before they are reported to CDC. The reported exemptions could be for one or more required vaccines. It is unlikely that children with an exemption were completely unvaccinated. The 2005–2006 birth cohort matriculated into the school system during the 2011–12 school year, and their vaccination coverage was measured using data from the 2006–2009 National Immunization Surveys, which indicate that <1% of children had not received any vaccines (7). A study of school children with nonmedical exemptions found that 75% of these children had received at least one vaccine previously (8). The process of requesting an exemption might be related to exemption levels, with easier standards for exemption being associated with higher levels of exemption (3).
Immunization Information Systems (IISs) used by 55 of the 64 grantees might be able to assist with tracking vaccinations, which can improve vaccination coverage (9), and might reduce the reporting burden on parents at school enrollment. Building links between education and public health departments through the use of the local IIS, where acceptable, can ease reporting burdens at the school level and provide state and local public health departments with an accessible tool to monitor vaccination coverage at the school level. In 2010, 52 grantees allowed schools to view records in their IIS, and 18 grantees allowed schools to update information in their IIS (CDC, unpublished data, 2012).
The findings in this report are subject to at least three limitations. First, these data are cross-sectional and generally collected at the start of the school year, although some states might collect later in the school year. Reports might not be updated as a child obtains the required vaccines or exemptions later in the school year. Vaccination and exemption status might not have been reported for every child. By grantee, the proportion of children not classified as either vaccinated or exempt for each individual vaccine was estimated to range from 0% to 29.1%. Second, the vaccines required and survey methods varied by state, although efforts to improve standardization are in progress. Finally, changes in school vaccination assessment reporting over time limit the ability to compare national trends over time.
In 2011, CDC conducted a study to determine best practices in monitoring school vaccination coverage and exemptions among kindergarteners to help meet the Healthy People 2020 target of 51 grantees collecting kindergarten vaccination coverage in accordance with CDC minimum standards. Best practices included using systematic and standardized approaches to data collection and ensuring communication and partnership between schools and public health systems (CDC, unpublished data, 2012). The annual school vaccination assessment takes place at the local level and might involve school personnel at the time when they are busiest, at the start of a school year. Minimizing the burden on school staff, improving the ease of reporting vaccination coverage and exemption levels, and providing feedback to schools on their vaccination coverage and exemptions levels might help improve school vaccination coverage. Additionally, capturing school vaccination coverage in the local IIS can help ensure a timely response after an imported case of measles, allowing quick identification of those who are not fully vaccinated and need protection. Continued evaluation and understanding of the limitations of the school vaccination assessment reporting system will help identify and address existing limitations and improve the usefulness of the system. Moreover, the ability to compare school vaccination rates across jurisdictions and over time will permit more effective program improvement efforts.
Assessing vaccination coverage compliance with local requirements and exemption levels as children enter kindergarten is essential for identifying and addressing areas of undervaccination and reducing outbreaks of vaccine-preventable disease and accompanying morbidity and mortality (9). This report identifies some concerns at the state and national levels that should be investigated at the local level to ensure that the appropriate population protection for measles is maintained at each school to protect school children, their families, and the community.
References
- CDC. Measles—United States, 2011. MMWR 2012;61:253–7.
- US Department of Health and Human Services. Healthy people 2020: immunization and infectious diseases. Washington, DC: US Department of Health and Human Services; 2010. Available at http://www.healthypeople.gov/2020/topicsobjectives2020/overview.aspx?topicId=23. Accessed August 14, 2012.
- Rota JS, Salmon DA, Rodewald LE, Chen RT, Hibbs BF, Gangarosa EJ. Processes for obtaining nonmedical exemptions to state immunization laws. Am J Public Health 2001;91:645–8.
- Gay N. The theory of measles elimination: implications for the design of elimination strategies. J Infect Dis 2004;189(Suppl 1):S27–35.
- Sugerman D, Barskey AE, Delea MG, et al. Measles outbreak in a highly vaccinated population, San Diego, 2008: role of the intentionally undervaccinated. Pediatrics 2010;125:747–55.
- Omer SB, Enger KS, Moulton LH, Halsey NA, Stokley S, Salmon DA. Geographic clustering of nonmedical exemptions to school immunization requirements and associations with geographic clustering of pertussis. Am J Epidemiol 2008;168:1389–96.
- CDC. National, state, and local area vaccination coverage among children aged 19–35 months—United States, 2009. MMWR 2010;59:1171–7.
- Salmon DA, Moulton LH, Omer SB, DeHart MP, Stokley S, Halsey NA. Factors associated with refusal of childhood vaccines among parents of school-aged children. Arch Pediatr Adolesc Med 2005;159:470–6.
- CDC. Guide to community preventive services: vaccinations to prevent diseases—universally recommended vaccinations. Atlanta, GA: US Department of Health and Human Services, CDC; 2011. Available at http://www.thecommunityguide.org/vaccines/universally/index.html. Accessed August 14, 2012.
* States are asked to use comparable methods to allow comparison and to ensure that the information collected is accurate. The methodology must include these standards: meeting all age-appropriate recommendations of the Advisory Committee on Immunization Practices, including 2 doses of varicella; census or CDC-recommended sampling methodology; validation of data collected by school administrators through subsampling a percentage of schools; data collection by trained personnel; data on vaccination history from a health-care provider; and data collected by December 31 of each year.
† DTaP vaccination coverage might include some diphtheria and tetanus toxoids and pertussis vaccine (DTP) or diphtheria and tetanus toxoids (DT) vaccinations if administered in another country or if the vaccination provider continued to use these vaccines after 2000.
§ One state (South Dakota) assessed vaccination coverage for 3 doses of HepB vaccine, but HepB vaccination is not a requirement for school entry. One state (Nevada) assessed vaccination coverage for 2 doses of varicella vaccine, but the number of doses required varied by school district.
What is already known on this topic?
Outbreaks of some vaccine-preventable diseases can occur despite generally high levels of vaccination coverage. To ensure that children entering school are protected from vaccine-preventable disease, kindergarten vaccination assessments are performed annually. These assessments monitor state and local levels of vaccination coverage and compliance with state vaccination requirements.
What is added by this report?
In 47 states and the District of Columbia, median vaccination coverage for three vaccines (diphtheria and tetanus toxoids and acellular pertussis; poliovirus; and hepatitis B) met the Healthy People 2020 target of ≥95%. However, median coverage for measles, mumps, and rubella vaccine and varicella vaccine were <95%. Exemption levels were low overall, but clusters of unvaccinated children might exist at the school or community level.
What are the implications for public health practice?
Although statewide levels of vaccination coverage are at or very near target levels, locally low vaccination coverage for extremely transmissible diseases such as measles remains a threat to public health. CDC will continue to support and build capacity to assist grantees in identification of local areas with low vaccination coverage or high exemption rates for further intervention.
|
TABLE 1. (Continued) Estimated vaccination coverage among children enrolled in kindergarten, by state/area, type of survey conducted, and vaccine — United States, 2011–12 school year |
|---|
|
Abbreviation: NA = not available. * The reported number of enrolled children is an estimate. † The proportion of eligible children for whom vaccination data were collected. § Sample designs varied by state/area. Census means that all schools and all children within schools were included in the assessment. SRS means a simple random sample design was used. Mixed design means a census was conducted among public schools, and a 2-stage cluster sample was conducted among private schools. 1-stage or 2-stage cluster sample means that schools were randomly selected, and all children in the selected schools were assessed (1-stage) or a random sample of children within the schools were selected (2-stage). Convenient sample means that the selection process is unspecified. ¶ Measles, mumps, and rubella. ** Diphtheria and tetanus toxoids and acellular pertussis vaccine. DTaP vaccination coverage might include some DTP (diphtheria and tetanus toxoids and pertussis vaccine) or DT (diphtheria and tetanus toxoids) vaccinations if administered in another country or vaccination provider continued to use after 2000. Pertussis vaccine is not required in Pennsylvania; the estimate for Pennsylvania represents DT only. †† Vaccine not required for school entry. §§ Coverage levels for 1 dose of varicella are not presented when coverage for 2 doses of varicella were reported. ¶¶ Reported estimate is for 5 doses of DTaP. *** Reported estimate is for 3 doses of DTaP. ††† Did not report antigen-specific information. §§§ Represents public school children only. ¶¶¶ Number of children enrolled in private school is unknown. **** Estimates are based on total children surveyed because total children enrolled is unknown. †††† The center of the estimates in the distribution. The median is based on estimates for 49 states and the District of Columbia. §§§§ Estimates are based on Advisory Committee on Immunization Practices requirements rather than state/jurisdiction requirements; otherwise, 100% of children met state estimates. |
FIGURE. Estimated percentage of children enrolled in kindergarten who have been exempted from receiving one or more vaccines* — United States, 2011–12 school year
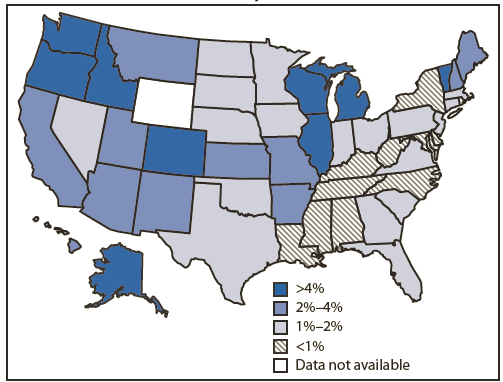
* Exemptions might not reflect a child's vaccination status. Children with an exemption who did not receive any vaccines are indistinguishable from those who have an exemption but are up-to-date for one or more vaccines.
Alternate Text: The figure above shows the estimated percentage of children enrolled in kindergarten who were exempt from receiving one or more vaccines in the United States, during the 2011-12 school year. Overall, among the grantees in the 49 states and DC that reported exemptions for the 2011-12 school year, 10 reported <1%, and nine reported >4% total exemption rates.
|
TABLE 2. (Continued) Number and percentage* of children enrolled in kindergarten with a reported exemption to vaccination, by state/area and type of exemption — United States, 2011–12 school year |
|---|
|
* All estimates of percentages of children with exemptions are weighted to the number of enrolled children unless otherwise noted. Number of exemptions are unweighted counts. † Medical and nonmedical exemptions might not be mutually exclusive. Some children might have both medical and nonmedical exemptions. § Exemptions because of philosophic reasons are not allowed. ¶ Exemptions because of religious reasons are not allowed. ** Rate differences between 2009–10 school year and 2010–11 school year are greater than 1.5 percentage points. †† Exemptions because of medical reasons are allowed but are not reported separately from other exemptions. §§ Exemptions because of religious reasons are allowed but are not reported separately from other exemptions. ¶¶ Exemption because of philosophic reasons are allowed but are not reported separately from other exemptions. *** Did not report exemptions to CDC. ††† Estimates are based on total children surveyed because total children enrolled is unknown. §§§ The median is based on estimates for 49 states and District of Columbia. ¶¶¶ Exemptions are allowed but not tracked. |
Use of trade names and commercial sources is for identification only and does not imply endorsement by the U.S. Department of
Health and Human Services.
References to non-CDC sites on the Internet are
provided as a service to MMWR readers and do not constitute or imply
endorsement of these organizations or their programs by CDC or the U.S.
Department of Health and Human Services. CDC is not responsible for the content
of pages found at these sites. URL addresses listed in MMWR were current as of
the date of publication.
All MMWR HTML versions of articles are electronic conversions from typeset documents.
This conversion might result in character translation or format errors in the HTML version.
Users are referred to the electronic PDF version (http://www.cdc.gov/mmwr)
and/or the original MMWR paper copy for printable versions of official text, figures, and tables.
An original paper copy of this issue can be obtained from the Superintendent of Documents, U.S.
Government Printing Office (GPO), Washington, DC 20402-9371;
telephone: (202) 512-1800. Contact GPO for current prices.
**Questions or messages regarding errors in formatting should be addressed to
mmwrq@cdc.gov.
