Persons using assistive technology might not be able to fully access information in this file. For assistance, please send e-mail to: mmwrq@cdc.gov. Type 508 Accommodation and the title of the report in the subject line of e-mail.
Consumption of Cigarettes and Combustible Tobacco — United States, 2000–2011
Smoking cigarettes and other combustible tobacco products causes adverse health outcomes, particularly cancer and cardiovascular and pulmonary diseases (1). A priority of the U.S. Department of Health and Human Services is to develop innovative, rapid-response surveillance systems for assessing changes in tobacco use and related health outcomes (2). The two standard approaches for measuring smoking rates and behaviors are 1) surveying a representative sample of the public and asking questions about personal smoking behaviors and 2) estimating consumption based on tobacco excise tax data (3). Whereas CDC regularly publishes findings on national and state-specific smoking rates from public surveys (4), CDC has not reported consumption estimates. The U.S. Department of Agriculture (USDA), which previously provided such estimates, stopped reporting on consumption in 2007 (5). To estimate consumption for the period 2000–2011, CDC examined excise tax data from the U.S. Department of Treasury's Alcohol and Tobacco Tax and Trade Bureau (TTB); consumption estimates were calculated for cigarettes, roll-your-own tobacco, pipe tobacco, and small and large cigars. From 2000 to 2011, total consumption of all combustible tobacco decreased from 450.7 billion cigarette equivalents to 326.6, a 27.5% decrease; per capita consumption of all combustible tobacco products declined from 2,148 to 1,374, a 36.0% decrease. However, while consumption of cigarettes decreased 32.8% from 2000 to 2011, consumption of loose tobacco and cigars increased 123.1% over the same period. As a result, the percentage of total combustible tobacco consumption composed of loose tobacco and cigars increased from 3.4% in 2000 to 10.4% in 2011. The data suggest that certain smokers have switched from cigarettes to other combustible tobacco products, most notably since a 2009 increase in the federal tobacco excise tax that created tax disparities between product types.
USDA's previous consumption estimates were based on 1) information from TTB, including data on products that are produced domestically or imported and taxed for legal sale in the United States; 2) tobacco industry reports; and 3) information from industry advisors. CDC developed a method to estimate consumption exclusively by using publicly available federal excise tax data available from TTB on products taxed domestically and imported into the United States (6). Using monthly tax data, CDC calculated the per unit (e.g., per cigarette or per cigar) consumption for each product. To enable comparisons with pipe tobacco and roll-your-own tobacco, CDC converted the tax data from pounds of tobacco to a per cigarette equivalent, based on the conversion formula contained in the Master Settlement Agreement (0.0325 oz [0.9 g] = one cigarette).* Adult per capita cigarette consumption was estimated by dividing total consumption by the number of persons aged ≥18 years in the United States each year using data from the U.S. Census Bureau. When compared with USDA's previous calculations for adult per capita cigarette consumption during 2000–2006, CDC's estimates differed each year by a median of only 0.15% and a mean of 0.76%.
From 2000 to 2011, total cigarette consumption declined from 435.6 billion to 292.8 billion, a 32.8% decrease (Table 1). Per capita cigarette consumption declined from 2,076 in 2000 to 1,232 in 2011, a 40.7% decrease. Conversely, total consumption of noncigarette combustible products increased from 15.2 billion cigarette equivalents in 2000 to 33.8 billion in 2011, a 123.1% increase, and per capita consumption increased from 72 in 2000 to 142 in 2011, a 96.9% increase. Total consumption of all combustible tobacco decreased from 450.7 billion cigarette equivalents to 326.6, a 27.5% decrease from 2000 to 2011, and per capita consumption of all combustible tobacco products declined from 2,148 to 1,374, a 36.0% decrease.
Consumption of loose tobacco (i.e., roll-your-own cigarette tobacco and pipe tobacco) changed substantially from 2000 to 2011. Roll-your-own cigarette equivalent consumption decreased by 56.3%, whereas pipe tobacco consumption increased by 482.1% (Table 2). The largest changes occurred from 2008 to 2011, when roll-your-own consumption decreased from 10.7 billion to 2.6 billion (a 75.7% decrease), whereas pipe tobacco consumption increased from 2.6 billion to 17.5 billion (a 573.1% increase).
Substantial changes also were observed in consumption of small cigars† and large cigars (Figure 1). From 2000 to 2011, consumption of small cigars decreased 65.0%, whereas large cigar consumption increased 233.1% (Table 2). The largest changes occurred from 2008 to 2011, when small cigar consumption decreased from 5.9 billion to 0.8 billion (an 86.4% decrease), whereas large cigar consumption increased from 5.7 billion to 12.9 billion (a 126.3% increase).
Annual cigarette consumption declined each year during 2000–2011, including a 2.6% decrease from 2010 to 2011, but total consumption of combustible tobacco decreased only 0.8% from 2010 to 2011, in part because of the effect of continued increases in the consumption of noncigarette combustible tobacco products (Figure 2). From 2000 to 2011, the percentage of total combustible tobacco consumption composed of loose tobacco and cigars increased from 3.4% (15.2 billion cigarette equivalents out of 450.7 billion) to 10.4% (33.8 billion of 326.6 billion).
Reported by
Michael A. Tynan, Tim McAfee, MD, Gabbi Promoff, MA, Terry Pechacek, PhD, Office on Smoking and Health, National Center for Chronic Disease Prevention and Health Promotion, CDC. Corresponding contributor: Michael A. Tynan, mtynan@cdc.gov, 770-488-5286.
Editorial Note
Despite continued decreases in cigarette smoking in the United States, consumption of pipe tobacco and large cigars has increased substantially since the federal tobacco excise tax was increased in 2009, creating tax disparities that made 1) pipe tobacco less expensive than roll-your-own tobacco and manufactured cigarettes, and 2) large cigars less heavily taxed than small cigars and manufactured cigarettes (7,8). Because loose tobacco products are classified based on how they are labeled, the loose tobacco tax disparity of $21.95 per pound led manufacturers to relabel roll-your-own tobacco as pipe tobacco and then market this relabeled pipe tobacco for roll-your-own use (7–9). In addition, manufacturers were able to increase the per-unit weight of certain small cigars to take advantage of a tax benefit when classified as large cigars, which are taxed based on the product price rather than per cigar (7). As a result of relatively minor increases in per-unit weight, the new "large cigar" can appear almost identical to a "small cigar," which resembles a typical cigarette and can cost as little as 7 cents per cigar (Figure 1) (7).
This analysis shows that cigarette consumption continues to decline in the United States, a trend that has persisted since the 1960s. However, recent changes in consumption patterns, particularly increases in large cigar and pipe tobacco use, have resulted in a slowing of the decline in consumption of all combustible tobacco, and indicate that certain cigarette smokers have switched to using lower-taxed noncigarette combustible products. Moreover, a 2012 Surgeon General's report found that youths and young adults had even higher rates of cigar use and simultaneous use of multiple tobacco products (10).
Recent analysis of excise tax data for pipe tobacco, roll-your-own cigarette tobacco, small cigars, and large cigars reveals that the tobacco industry is adapting the marketing and production of cigars and roll-your-own tobacco products to minimize federal excise tax and thus reduce these tobacco products' prices compared with cigarettes (7–9). Reducing the effective federal and state excise tax rates on tobacco lessens the impact of cost on reducing smoking and preventing smoking initiation. The Government Accountability Office (GAO) recommends modifying federal tobacco taxes to eliminate large tax differentials between roll-your-own and pipe tobacco and small and large cigars (7). In addition, because Food and Drug Administration (FDA) regulations currently do not apply to cigars and pipe tobacco, these products can be produced with flavoring, can be labeled with misleading descriptors such as "light" or "low tar," and can be marketed and sold with fewer restrictions than apply to cigarettes.
The findings in this report are subject to at least one limitation. CDC's measure for cigarette and combustible tobacco consumption only accounts for products taxed for legal sale in the United States and does not account for illicit cigarette sales, such as those smuggled into or out of the country, or for untaxed cigarettes that are produced or sold on American Indian sovereign lands. Currently, no method exists for measuring or estimating illicit or untaxed tobacco trade in the United States.
Smoke from pipes and cigars contains the same toxic chemicals as cigarette smoke (1). The evidence that the increase in cigar and pipe tobacco use is the result of offering cigarette smokers a low-priced alternative product is a particular public health concern, because the morbidity and mortality effects of other forms of combustible tobacco are similar to those of cigarettes. Increasing prices has been one of the most effective ways to reduce tobacco use and prevent youth smoking initiation (10). In addition, combustible tobacco products that are similar in design but not legally considered to be cigarettes are not subject to FDA regulations related to manufacturing, flavoring, labeling, and marketing. The availability of low-priced and less regulated alternative products appears to have led certain cigarette smokers to switch to other combustible tobacco products. This group also might include persons who otherwise might have quit smoking as a result of the 2009 federal tobacco excise tax increase and FDA cigarette regulations. Diminishing the public health impact of excise tax increases and regulation can hamper efforts to prevent youth smoking initiation, reduce consumption, and prompt quitting.
References
- US Department of Health and Human Services. A report of the Surgeon General: how tobacco smoke causes disease: the biology and behavioral basis for smoking-attributable disease, 2010. Atlanta, GA: US Department of Health and Human Services, CDC; 2010. Available at http://www.surgeongeneral.gov/library/reports/tobaccosmoke/index.html. Accessed July 30, 2012.
- US Department of Health and Human Services. Ending the tobacco epidemic: a tobacco control strategic action plan for the US Department of Health and Human Services. Washington, DC: Office of the Assistant Secretary for Health; 2010. Available at http://www.hhs.gov/ash/initiatives/tobacco/tobaccostrategicplan2010.pdf. Accessed July 30, 2012.
- Hatziandreau EJ, Pierce JP, Fiore MC, Grise V, Novotny TE, Davis RM. The reliability of self-reported cigarette consumption in the United States. Am J Public Health 1989;79:1020–3.
- CDC. Vital Signs: current cigarette smoking among adults aged ≥18 years—United States, 2005–2010. MMWR 2011;60:1207–12.
- Economic Research Service, US Department of Agriculture. Tobacco outlook. Washington, DC: US Department of Agriculture; 2007. Available at http://usda.mannlib.cornell.edu/usda/current/TBS/TBS-10-24-2007.pdf. Accessed July 30, 2012.
- Alcohol and Tobacco Tax and Trade Bureau. Tobacco statistics. Washington, DC: US Department of Treasury, Alcohol and Tobacco Tax and Trade Bureau. Available at http://www.ttb.gov/tobacco/tobacco-stats.shtml. Accessed August 1, 2012.
- Government Accountability Office. Tobacco taxes: large disparities in rates for smoking products trigger significant market shifts to avoid higher taxes. Washington, DC: Government Accountability Office; 2012. Available at http://www.gao.gov/products/gao-12-475. Accessed July 30, 2012.
- Morris DS. Tobacco manufacturing data demonstrate industry product switching in response to tax increases. Tob Control 2010;19:421–2.
- Morris DS, Tynan MA. Fiscal and policy implications of selling pipe tobacco for roll-your-own cigarettes in the United States. PLoS One 2012;7:e36487.
- US Department of Health and Human Services. Preventing tobacco use among youth and young adults, 2012: a report of the Surgeon General. Atlanta, GA: US Department of Health and Human Services, CDC; 2012. Available at http://www.surgeongeneral.gov/library/reports/preventing-youth-tobacco-use/index.html. Accessed July 30, 2012.
* Available at http://www.naag.org/backpages/naag/tobacco/msa/msa-pdf.
† In 26 USC 5701, small cigars are defined as cigars that weigh ≥3 pounds (<1.36 kg) per 1,000 cigars, and large cigars are defined as cigars that weigh >3 pounds per 1,000.
What is already known on this topic?
Cigarette use continues to decline in the United States, a trend that has persisted since the 1960s.
What is added by this report?
From 2000 to 2011, consumption of all combustible tobacco products decreased from 450.7 billion cigarette equivalents to 326.6 (a 27.5% decrease), and per capita consumption of all combustible tobacco products declined from 2,148 to 1,374 (a 36.0% decrease). However, whereas consumption of cigarettes decreased 32.8%, consumption of noncigarette combustible tobacco increased 123.1%. As a result, the percentage of combustible tobacco consumption composed of loose tobacco and cigars increased from 3.4% in 2000 to 10.4% in 2011.
What are the implications for public health practice?
The increase in cigar and pipe tobacco use is a public health concern because all combustible tobacco use causes cancer, heart disease, and other smoking-related diseases. A switch from cigarettes to other, lower-taxed, combustible tobacco products blunts the effect of increasing prices, one of the most effective ways to reduce smoking and prevent youth smoking initiation.
FIGURE 1. Physical differences between combustible tobacco products — Government Accountability Office, United States
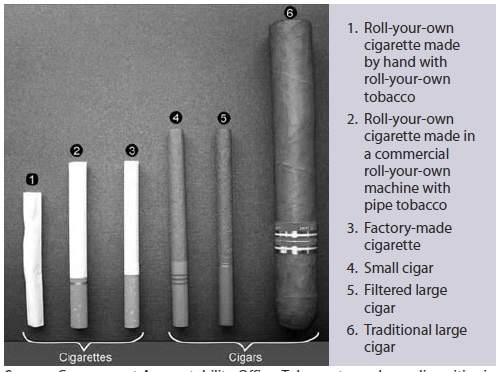
Source: Government Accountability Office. Tobacco taxes: large disparities in rates for smoking products trigger significant market shifts to avoid higher taxes. Available at http://www.gao.gov/products/gao-12-475.
Alternate Text: The figure above shows physical differences between combustible tobacco products in the United States.
FIGURE 2. Consumption of cigarettes and other combustible tobacco products — United States, 2001–2011
Alternate Text: The figure above shows consumption of cigarettes and other combustible tobacco products in the United States during 2001-2011. Annual cigarette consumption declined each year during 2000-2011, including a 2.6% decrease from 2010 to 2011, but total consumption of combustible tobacco decreased only 0.8% from 2010 to 2011, in part, because of the effect of continued increases in the consumption of noncigarette combustible tobacco products. From 2000 to 2011, the percentage of total combustible tobacco consumption composed of loose tobacco and cigars increased from 3.4% (15.2 billion cigarette equivalents out of 450.7 billion) to 10.4% (33.8 billion of 326.6 billion).
Use of trade names and commercial sources is for identification only and does not imply endorsement by the U.S. Department of
Health and Human Services.
References to non-CDC sites on the Internet are
provided as a service to MMWR readers and do not constitute or imply
endorsement of these organizations or their programs by CDC or the U.S.
Department of Health and Human Services. CDC is not responsible for the content
of pages found at these sites. URL addresses listed in MMWR were current as of
the date of publication.
All MMWR HTML versions of articles are electronic conversions from typeset documents.
This conversion might result in character translation or format errors in the HTML version.
Users are referred to the electronic PDF version (http://www.cdc.gov/mmwr)
and/or the original MMWR paper copy for printable versions of official text, figures, and tables.
An original paper copy of this issue can be obtained from the Superintendent of Documents, U.S.
Government Printing Office (GPO), Washington, DC 20402-9371;
telephone: (202) 512-1800. Contact GPO for current prices.
**Questions or messages regarding errors in formatting should be addressed to
mmwrq@cdc.gov.
