Persons using assistive technology might not be able to fully access information in this file. For assistance, please send e-mail to: mmwrq@cdc.gov. Type 508 Accommodation and the title of the report in the subject line of e-mail.
Tornado-Related Fatalities — Five States, Southeastern United States, April 25–28, 2011
During April 25–28, 2011, a massive storm system generated 351 tornadoes (including 15 registering 4 or 5 on the Enhanced Fujita [EF] scale*), killing 338 persons in Alabama, Arkansas, Georgia, Mississippi, and Tennessee (1). This was the third-deadliest tornado event in the United States, surpassing an April 1974 event that resulted in 315 fatalities (1,2). This event also was historic because of the record number of fatalities that occurred despite modern advances in tornado forecasting, advanced warning times, and media coverage (1–3). Risk factors for death and injury from tornadoes are sheltering in mobile homes, proximity to an EF-4 or EF-5 tornado, being an older adult (aged ≥65 years), lack of accessibility to safe rooms (e.g., basements or reinforced shelters), and a night-time tornado impact (4–6). To describe the fatalities by demographic characteristics, type of shelter used, cause of death, and tornado severity and location, CDC reviewed data from the American Red Cross (Red Cross), death certificates, and the National Weather Service (NWS). This report summarizes the results of that review. Among the 338 decedents, median age was 55.0 years (range: 4 days–97 years); approximately one third were older adults. On tornado impact, 46.7% of decedents were in single-family homes, and 26.6% were in mobile homes. The leading cause of death was traumatic injury, including 21.9% with head injuries. Half of the deadly tornadoes were rated EF-4 or EF-5 and were responsible for 89.5% of the deaths. To prevent tornado-related deaths, health messaging should encourage the public (especially older adults and residents of mobile/manufactured homes) to pre-identify an accessible safe room, prepare the room with personal protection items (e.g., blankets and helmets), and monitor local weather (7,8).
NWS forecast the storm system 5 days in advance and issued numerous tornado watches (mean lead time: 2.4 hours) and warnings (mean lead time: 22 minutes) (1,3). Through extensive local media coverage, residents were encouraged to prepare for tornado impact and to seek immediate cover in a safe place (1,3). Because of the limitations of tornado meteorology, the exact geographic impact and strength of the tornadoes were not determined by NWS (per protocol) until after the storm (1,9).
The Red Cross identified tornado-related fatalities from various sources, such as media reports, coroners, funeral homes, and emergency managers. Volunteers conducted semi-structured interviews with available next-of-kin to identify any disaster-related needs. For each fatality, the Red Cross completed a standardized mortality surveillance form that captured demographics of the deceased, the location of the deceased at the time of injury, the location of the recovery of the body, the cause of the injury, and the circumstance surrounding the death. A case was defined as any fatality attributed directly (e.g., house collapse) or indirectly (e.g., stress-induced myocardial infarction) to the April 25–28 tornado disaster that affected the southeastern states. The mortality form data, including the immediate and underlying cause(s) of death, were verified with official death certificates from the state health departments of the five affected states. A list of the decedents' names was provided to the five state vital statistics offices by CDC to obtain the death certificates. The five vital statistics offices conducted additional searches using key word searches (e.g., tornado) and International Classification of Diseases, 10th Revision code X37 ("cataclysmic storm") to identify additional tornado-related deaths occurring through December 31, 2011. Frequencies of the variables were calculated.
Spatial information on the tornado tracks, including the lengths and widths and maximum strength (on the EF scale) were available via NWS post-storm damage assessments (1,2). Using these data, a composite of the multistate tornado tracks was created, and physical address at the time of injury or illness for each fatality was geocoded using mapping software. Addresses were then spatially assigned to specific tornadoes by nearest proximity using a 5-mile (8-km) radius. A death within the radius was linked to that particular tornado.
A total of 338 fatalities caused by 27 tornadoes occurred in the five states; 15 of the 27 deadly tornadoes reached EF-4 or EF-5 strengths (Figure). These powerful EF-4 and EF-5 tornadoes were especially dangerous because of their rapid forward velocity of >50 mph (>81 km/h) and prolonged duration on the ground, averaging 66 miles (106 km) and crossing multiple counties and states (1,2,9). The majority of the fatalities occurred during the late afternoon and evening hours on April 27, when numerous long-track tornadoes (paths >15 miles [>24 km]) moved from central and northern Mississippi to the major metropolitan areas of Tuscaloosa and Birmingham, Alabama, as well as across parts of eastern Tennessee and Georgia (1,9; Gregory Carbin, NWS, personal communication, 2012). A total of 306 (90.5%) addresses of decedents were within a 5-mile (8-km) radius of a tornado; of these, 274 (89.5%) were attributed to an EF-4 or EF-5 tornado (Figure).
Overall, 57.7% of the decedents' were female, and 32.5% were aged ≥65 years (median: 55.0 years [range: 4 days–97 years]). The majority of the deceased were white (83.7%) and non-Hispanic (92.9%). The most common locations of injury were single-family homes (46.7%) and mobile homes (26.6%) (Table 1). Based on the narratives documented on the death certificates and from interviews with next-of-kin, 306 (90.5%) of the injuries occurred indoors, yet 125 (37.0%) of the bodies were recovered outside (Table 1). The majority of the deaths were on the date of the tornado exposure (319 [94.0%]), directly related to the tornado (318 [94.1%]), and from multisystem trauma (324 [95.6%]), including 74 (21.9%) that indicated a head injury (Table 2). A total of 20 deaths were indirectly related to the tornados: seven from smoke and carbon monoxide asphyxiation, four from cardiovascular events, three from medical equipment failure during a power failure, two from medical complications secondary to tornado injuries, two from motor vehicle crashes, and two from falls or injuries during cleanup (Table 2).
Reported by
Mary Casey-Lockyer, MHS, American Red Cross. Catherine Molchan Donald, MBA, Center for Health Statistics, Alabama Dept of Health. Judy Moulder, MHS, Office of Health Statistics, Mississippi State Dept of Health. Deborah Aderhold, State Office of Vital Records, Georgia Dept of Public Health. Doreen Harris, Div of Health, Arkansas Center for Health Statistics. Gary Woodall, MS, Douglas Young, Brenton MacAloney, Gregory Carbin, National Weather Svc. Melissa Morrison, MPH, Thomas Chester, MD, Jay Roth, MPH, Career Epidemiology Field Officer Program, Office of Public Health Research; Rebecca S. Noe, MN, MPH, Amy Schnall, MPH, Amy Wolkin, MSPH, Sara Vagi, PhD, Div of Environmental Hazards and Health Effects, National Center for Environmental Health; Caitlin E. Mertzlufft, MPH, Agency for Toxic Substances and Disease Registry; David Sugerman, MD, National Center for Injury Control and Prevention; Cindy Chiu, PhD, EIS Officer, CDC. Corresponding contributor: Rebecca S. Noe, rnoe@cdc.gov, 770-488-3437.
Editorial Note
The southeastern United States is considered particularly vulnerable to tornado fatalities because of the high concentration of mobile homes and tornados with EF-4 and EF-5 ratings (6). In the tornado storms of April 25–28, 2011, nearly half of the 338 fatalities occurred in single-family homes, and approximately 40% of bodies were recovered outdoors near the impact area. Similar to other tornadoes, the leading cause of death was trauma (96%), with nearly one fifth of trauma deaths involving head injuries (4–6,10). Multisystem trauma and recovery of bodies outdoors was not unexpected because 90% of the deaths were associated with EF-4 or EF-5 tornadoes. Tornados reaching this strength are capable of removing a house off its foundation and debarking trees, and historically these tornadoes have been responsible for 70% of tornado-related deaths (1,5,6). Nearly half of the deadly tornadoes in this disaster reached EF-4 or EF-5. The precise strength and geographic extent of a tornado track are not determined until after an event; therefore, persons should prepare for the worst-case scenario when they receive a tornado warning (1).
Federal and state assessments conducted after this disaster found a general inadequacy of available storm shelters in the impacted areas (1,3,9). The overall magnitude of tornado-related deaths observed in the wake of the disaster and the high proportion of deaths occurring in single-family homes support current CDC recommendations to shelter in a safe room, take personal protective actions, and develop a disaster-preparedness plan ahead of time (7). In addition, emergency planning for vulnerable older adults is important; guidance on developing plans, building registries, sheltering, and caregiver preparedness are available from CDC online at http://www.cdc.gov/aging/emergency. A safe room is either an underground shelter, such as the interior part of a basement, or a specific tornado-safe room that is a hardened (e.g., concrete) above-ground structure specifically designed to meet Federal Emergency Management Administration (FEMA) criteria for providing "near-absolute protection" in extremely powerful weather events (1,8,9). Personal protective actions include preparing a safe room with items to provide protection of the body, including the head, and remaining informed of storm watches and warnings by using a weather band radio or other means (1,7). Currently, no data are available regarding the effectiveness of helmet use to prevent head injuries during a tornado. If persons choose to use helmets to protect their heads, they should know where the helmets are and have them readily accessible, because time to react might be short. Choosing to use helmets to protect the head should not be considered an alternative to seeking appropriate shelter. Tornado preparedness also should include preparation for power outages (e.g., flashlights) and plans to prevent potentially fatal hazards such as house fires, falls, and carbon monoxide exposure (4,7,10)
The findings in this report are subject to at least two limitations. First, spatial analysis might not accurately reflect the exact location of death or tornado-relatedness because of geocoding limitations, tornado track overlap, and path estimates based on few NWS survey points (1,6). For this reason, the exposed population and rates were not estimated or calculated. Second, data on warnings heard, protective actions taken, and housing damage incurred are not described in this report because the Red Cross did not collect these data in all five affected states.
Given the number of fatalities and current limitations in determining a tornado's characteristics, increased awareness of the need to prepare for the worst-case scenario by pre-identifying and sheltering in an adequate tornado-safe room during a tornado remain critical to saving lives (5,6).
Acknowledgments
Jeanne Spears, April Wood, American Red Cross. John Deblock, Gary Goggins, Chris Buonanno, Lans Rothfusz, Thomas Salem, National Weather Svc. Elaine Hallisey, MA, Michael Wellman, MS, Agency for Toxic Substances and Disease Registry, CDC.
References
- National Oceanic and Atmospheric Administration. Service assessment: the historic tornadoes of April 2011. Silver Spring, MD: US Department of Commerce, National Oceanic and Atmospheric Administration; 2011. Available at http://www.nws.noaa.gov/om/assessments/pdfs/historic_tornadoes.pdf. Accessed July 9, 2012.
- National Oceanic and Atmospheric Administration. Preliminary killer tornadoes, updated February 5, 2012. Silver Spring, MD: US Department of Commerce, National Oceanic and Atmospheric Administration; 2012. Available at http://www.spc.noaa.gov/climo/torn/STATIJ11.txt. Accessed July 9, 2012.
- Tornado Recovery Action Council of Alabama. Cultivating a state of readiness—our response to April 27, 2011. Birmingham, AL: Tornado Recovery Action Council of Alabama; 2012. Available at http://tracalabama.org/wp-content/uploads/2012/01/TRAC_Report.pdf. Accessed July 9, 2012.
- Daley WR, Brown S, Archer P, et al. Risk of tornado-related death and injury in Oklahoma, May 3, 1999. Am J Epidemiol 2005;161:1144–50.
- Brown S, Archer P, Kruger E, et al. Tornado-related death and injuries in Oklahoma due to the 3 May 1999 tornadoes. Weather and Forecasting 2002;17:343–53.
- Ashley WS. Spatial and temporal analysis of tornado fatalities in the United States: 1880–2005. Weather and Forecasting 2007;22:1214–28.
- CDC. Emergency preparedness and response: tornadoes. Atlanta, GA: US Department of Health and Human Services, CDC; 2012. Available at http://emergency.cdc.gov/disasters/tornadoes. Accessed July 9, 2012.
- Federal Emergency Management Agency. FEMA 320 - taking shelter from the storm: building a safe room for your home or small business. Washington , DC: US Department of Homeland Security, Federal Emergency Management Agency; CDC. Available at http://www.fema.gov/plan/prevent/saferoom/fema320.shtm. Accessed July 9, 2012.
- Prevatt DO, van de Lindt JW, Graettinger A, et al. Damage study and future direction for structural design following the Tuscaloosa tornado of 2011. Arlington, VA: US National Science Foundation; 2011. Available at http://www.strongtie.com/ftp/articles/tuscaloosatornadoreport2011.pdf. Accessed July 9, 2012.
- Bohonos L, Hogan D. The medical impact of tornadoes in North America. J Emerg Med 1999;17:67–73.
* EF tornado rating scale estimates the strongest wind gusts that occur 10 meters above the ground: EF-0 (65–85 mph [105–137 km/h]), EF-1 (86–110 mph [138–177 km/h]), EF-2 (111–135 mph [178–217 km/h]), EF-3 (136–165 mph [218–266 km/h]), EF-4 (166–200 mph [267–322 km/h]), and EF-5 (>200 mph [>322 km/h]). Additional information available at http://www.depts.ttu.edu/weweb/pubs/fscale/efscale.pdf.
What is already known on this topic?
Known risk factors for death and injury from tornadoes are sheltering in mobile homes, proximity to the path of a tornado registering 4 or 5 on the Enhanced Fujita (EF) scale, being an older adult (aged ≥65 years), lack of accessibility to a safe room (e.g., a basement or reinforced shelter), and night-time tornado impacts. The southeastern United States is considered particularly vulnerable to tornado fatalities because of the high concentration of mobile homes and frequency of EF-4 and EF-5 tornadoes. Traumatic injury, including head injury, is the leading cause of death during tornadoes.
What is added by this report?
Although extensive public health warnings were broadcast before the tornadoes touched down, this was the third-deadliest tornado disaster in U.S. history, with 338 confirmed fatalities. Head injury was the cause of death in nearly 22% of fatalities. Approximately 47% of the fatalities were in single-family homes. A composite of the multistate deadly tornado tracks was created from the National Weather Service's tornado survey points in a geographic information system (GIS); more than 90% of the geocoded addresses were spatially linked to a deadly tornado.
What are the implications for public health practice?
To prevent tornado-related fatalities, public health messaging needs to specify what constitutes a safe room and to increase awareness that these should be used during all tornadoes. Spatial analysis of health impacts of tornadoes using GIS provides a better understanding of risk factors and the underlying characteristics of the affected population for public health preparedness and response.
FIGURE. All direct and indirect tornado-related fatalities and associated tornado tracks — southeastern United States, April 25–28, 2011
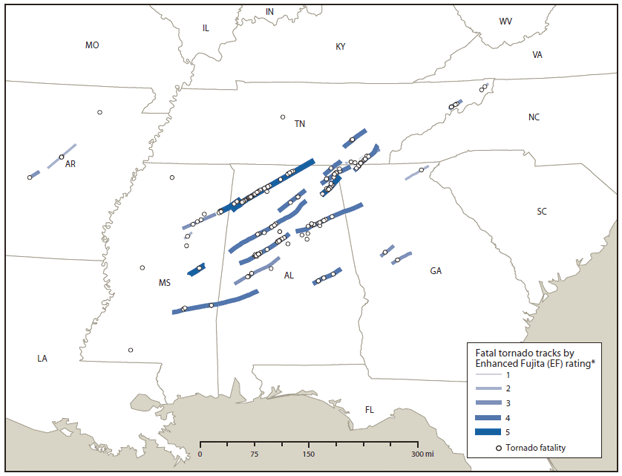
* EF tornado rating scale estimates the strongest wind gusts that occur 10 meters above the ground: EF-0 (65–85 mph [105–137 km/h]), EF-1 (86–110 mph [138–177 km/h]), EF-2 (111–135 mph [178–217 km/h]), EF-3 (136–165 mph [218–266 km/h]), EF-4 (166–200 mph [267–322 km/h]), and EF-5 (>200 mph [>322 km/h]). Additional information available at http://www.depts.ttu.edu/weweb/pubs/fscale/efscale.pdf.
Alternate Text: The figure above shows all direct and indirect tornado-related fatalities and associated tornado tracks in the southeastern United States, during April 25-28, 2011. A total of 338 fatalities caused by 27 tornadoes occurred in five states (Alabama, Arkansas, Georgia, Mississippi, and Tennessee); 15 of the 27 deadly tornadoes reached level 4 or 5 on the Enhanced Fujita scale.
Use of trade names and commercial sources is for identification only and does not imply endorsement by the U.S. Department of
Health and Human Services.
References to non-CDC sites on the Internet are
provided as a service to MMWR readers and do not constitute or imply
endorsement of these organizations or their programs by CDC or the U.S.
Department of Health and Human Services. CDC is not responsible for the content
of pages found at these sites. URL addresses listed in MMWR were current as of
the date of publication.
All MMWR HTML versions of articles are electronic conversions from typeset documents.
This conversion might result in character translation or format errors in the HTML version.
Users are referred to the electronic PDF version (http://www.cdc.gov/mmwr)
and/or the original MMWR paper copy for printable versions of official text, figures, and tables.
An original paper copy of this issue can be obtained from the Superintendent of Documents, U.S.
Government Printing Office (GPO), Washington, DC 20402-9371;
telephone: (202) 512-1800. Contact GPO for current prices.
**Questions or messages regarding errors in formatting should be addressed to
mmwrq@cdc.gov.
