Persons using assistive technology might not be able to fully access information in this file. For assistance, please send e-mail to: mmwrq@cdc.gov. Type 508 Accommodation and the title of the report in the subject line of e-mail.
Helmet Use Among Motorcyclists Who Died in Crashes and Economic Cost Savings Associated With State Motorcycle Helmet Laws — United States, 2008–2010
In 2010, the 4,502 motorcyclists (operators and passengers) killed in motorcycle crashes made up 14% of all road traffic deaths, yet motorcycles accounted for <1% of all vehicle miles traveled (1,2). Helmet use consistently has been shown to reduce motorcycle crash–related injuries and deaths, and the most effective strategy to increase helmet use is enactment of universal helmet laws (3). Universal helmet laws require all motorcyclists to wear helmets whenever they ride. To examine the association between states' motorcycle helmet laws and helmet use or nonuse among fatally injured motorcyclists, CDC analyzed 2008–2010 National Highway Traffic Safety Administration (NHTSA) data from the Fatality Analysis Reporting System (FARS), a census of fatal traffic crashes in the United States (1). Additionally, economic cost data from NHTSA were obtained to compare the costs saved as a result of helmet use, by type of state motorcycle helmet law. The findings indicated that, on average, 12% of fatally injured motorcyclists were not wearing helmets in states with universal helmet laws, compared with 64% in partial helmet law states (laws that only required specific groups, usually young riders, to wear helmets) and 79% in states without a helmet law. Additionally, in 2010, economic costs saved from helmet use by society in states with a universal helmet law were, on average, $725 per registered motorcycle, nearly four times greater than in states without such a law ($198).
Motorcyclist death data for operators and passengers were obtained from FARS. To be included in FARS, a crash must result in the death of at least one person (occupant of a vehicle or a nonmotorist) within 30 days of the crash. Percentages of fatally injured motorcyclists who were not wearing a helmet were calculated as a proportion of all motorcyclist fatalities by state for 2008–2010. Percentages were suppressed for states with fewer than 10 fatalities involving motorcyclists who were not wearing helmets.
Information on economic costs saved from helmet use (e.g., medical and productivity costs saved) was obtained from NHTSA (NHTSA, unpublished data, 2012). The methods used to estimate 2010 costs were first used to calculate 2008 cost estimates.* For 2010, the number of fatally injured motorcyclists who wore helmets was derived from FARS, and estimates of the number of helmeted motorcyclists who were injured were obtained from NHTSA's General Estimates System, a nationally representative sample of nonfatal traffic crashes.† These values were divided by 1 minus the corresponding effectiveness estimate for preventing motorcycle crash fatalities and injuries§ (4) to obtain estimates of the potential number of motorcycle crash fatalities and injuries expected if helmeted riders had not been wearing a helmet. The numbers of fatalities and injuries involving helmeted motorcyclists were then subtracted from the expected numbers of motorcycle crash fatalities and injuries to estimate the numbers of motorcyclist lives saved and serious and minor injuries prevented. Corresponding cost calculations from NHTSA¶ were then applied to these estimates, and the resulting costs were adjusted to year 2010 dollars. Costs saved were estimated to be $1,212,800 per fatality, $171,753 per serious injury, and $7,523 per minor injury (in year 2010 dollars) (NHTSA, unpublished data, 2012). Costs saved included injury-related costs (e.g., medical and emergency services costs, and household and work productivity losses) and excluded costs (e.g., property damage and travel delay). For this report, costs saved were standardized by state by dividing the total costs saved in each state by the number of registered motorcycles in that state in 2010** to determine costs saved per registered motorcycle.
During 2008–2010, a total of 14,283 motorcyclists were killed in crashes, among whom 6,057 (42%) were not wearing a helmet. In the 20 states with a universal helmet law, 739 (12%) fatally injured motorcyclists were not wearing a helmet, compared with 4,814 motorcyclists (64%) in the 27 states with partial helmet laws and 504 (79%) motorcyclists in the three states without a helmet law (Figure 1).
By preventing motorcyclist deaths and protecting against injuries, helmet use also translated to economic costs saved. In 2010, approximately $3 billion in costs were saved as a result of helmet use in the United States; however, another $1.4 billion could have been saved if all motorcyclists had worn helmets (NHTSA, unpublished data, 2012). Total costs saved from helmet use ranged from $394 million in California to $2.6 million in New Mexico. Economic costs saved from helmet use per registered motorcycle ranged from $1,627 in North Carolina to $48 in New Mexico, with a median of $286 (Figure 2). Nearly all (23 of the 25) states with costs saved per registered motorcycle below the median had either a partial helmet law or no helmet law. Costs saved in states with a universal helmet law were, on average, nearly four times greater per registered motorcycle than in states without such a law ($725 versus $198).
Reported by
Rebecca B. Naumann, MSPH, Ruth A. Shults, PhD, Div of Unintentional Injury Prevention, National Center for Injury Prevention and Control, CDC. Corresponding contributor: Rebecca B. Naumann, rnaumann@cdc.gov, 770-488-3922.
Editorial Note
The findings in this report indicate that fatally injured motorcycle riders were less likely to wear helmets in states that do not have universal helmet laws. During 2008–2010, fatally injured motorcyclists in states with a partial helmet law were more than five times as likely not to have been wearing a helmet as those in states with a universal helmet law (64% versus 12%). Fatally injured motorcyclists in states with no helmet law were more than six times as likely not to have been wearing a helmet as those in states with a universal helmet law (79% versus 12%). In addition, the economic costs saved by helmet use are substantial. The savings in states with a universal helmet law were, on average, $725 per registered motorcycle, nearly four times greater than in states without such a law ($198).
As of April 2012, 19 states and the District of Columbia had universal helmet laws, 28 states had partial helmet laws, and three states had no helmet law (5). Motorcycle helmet legislation in the United States has been marked by change, with cycles of helmet law enactments followed by periods of helmet law repeals (Figure 3) (5). In the mid-1970s, 47 states and the District of Columbia had universal helmet laws, prompted in part by a 1967 federal requirement that states have such laws or lose a portion of their federal highway funds. In 1976, however, Congress removed penalties for not having a universal helmet law and states began to change or repeal their laws. By 1980, 20 states had changed their universal helmet laws to partial helmet laws and eight states had repealed their laws altogether (5). In 1991, Congress reintroduced financial penalties for states without universal helmet laws; California and Maryland responded by passing universal helmet laws. In 1995, federal sanctions against states without universal helmet laws again were lifted, and New Hampshire's helmet law immediately was repealed. During 1997–2003, Arkansas, Texas, Kentucky, Louisiana, Florida, and Pennsylvania followed by changing their helmet laws from universal helmet laws to partial helmet laws (5). In 2004, Louisiana reinstated its universal helmet law. Since then, state legislatures have continued to debate helmet laws, and bills to change or repeal universal helmet laws routinely are introduced. In 2011, such bills were introduced in 10 of the 20 universal helmet law states, and in April 2012, Michigan changed its universal helmet law to a partial helmet law (5,6).
Research has shown that when a state repeals its helmet law or opts for less restrictive requirements, helmet use decreases and motorcycle-related deaths, injuries, and costs increase. In 2000, for example, Florida changed its universal helmet law to a partial helmet law that covered only riders aged <21 years and those with <$10,000 in medical insurance coverage. During the 2 years after the law was changed, the motorcyclist death rate per 10,000 registered motorcycles in Florida increased by 21%, deaths among motorcycle riders aged <21 years nearly tripled, and hospital admissions of motorcyclists with injuries to the head, brain, and skull increased by 82% (7). In addition, gross costs charged to hospital-admitted motorcyclists with head, brain, or skull injuries in Florida more than doubled, from $21 million to $50 million (7). Studies that have examined nonfatal injury outcomes among motorcyclists who wore helmets and those who did not have found that hospitalized riders who had not worn helmets incurred higher health-care costs (8,9). Riders who do not wear helmets are more likely to suffer traumatic brain injuries, and median hospital charges for those with traumatic brain injuries are 13 times higher than for those without such injuries (8). Riders who do not wear helmets also are less likely to have health insurance, and therefore are more likely to require publicly funded health care (9).
The findings in this report are subject to at least three limitations. First, the NHTSA cost estimates are based on year 2000 estimates, converted to year 2010 dollars; however, these are the most recent and comprehensive motorcyclist injury cost estimates available. Second, costs estimates are derived from national data and do not reflect variation in costs across states. Cost estimates also do not include intangible costs, such as those for pain, suffering, and decreased quality of life, nor do they account for the costs associated with a universal helmet law or owning a helmet. Finally, helmet use was unknown and therefore estimated for 2.5% of motorcyclist fatalities; however, no meaningful differences resulted from inclusion of these estimates.
Helmet use is estimated to prevent 37% of fatalities among motorcycle operators and 41% of fatalities among passengers (4). NHTSA estimates that in 2010, helmet use saved the lives of 1,544 motorcyclists, and an additional 709 lives might have been saved if all motorcyclists had worn helmets (NHTSA, unpublished data, 2012). With motorcycle ownership at an all-time high (8.2 million registered motorcycles in 2010, compared with 4.3 million in 2000),†† motorcycle-related deaths and their associated costs are expected to remain at high levels unless more effective protective measures are implemented (10). Helmets are proven to save lives and money, and universal helmet laws are the most effective way to increase helmet use (3).
Acknowledgments
Marie Walz, Larry Blincoe, Umesh Shankar, National Highway Traffic Safety Admin. Curtis Florence, National Center for Injury Prevention and Control, CDC.
References
- National Highway Traffic Safety Administration. Fatality Analysis Reporting System. Washington, DC: US Department of Transportation, National Highway Traffic Safety Administration; 2011. Available at http://www.nhtsa.gov/FARS. Accessed May 11, 2012.
- Federal Highway Administration. Highway statistics 2010: annual vehicle distance traveled in miles and related data—by highway category and vehicle type (table VM-1). Washington, DC: US Department of Transportation, Federal Highway Administration; 2011. Available at http://www.fhwa.dot.gov/policyinformation/statistics/2010/vm1.cfm. Accessed May 11, 2012.
- National Highway Traffic Safety Administration. Countermeasures that work: a highway safety countermeasure guide for state highway safety offices. 6th ed. Washington, DC: US Department of Transportation, National Highway Traffic Safety Administration; 2011. Available at http://www.nhtsa.gov/staticfiles/nti/pdf/811444.pdf. Accessed May 11, 2012.
- National Center for Statistics and Analysis. Motorcycle helmet effectiveness revisited. Washington, DC: US Department of Transportation, National Highway Traffic Safety Administration; 2004. Available at http://www-nrd.nhtsa.dot.gov/Pubs/809715.pdf. Accessed May 11, 2012.
- Insurance Institute for Highway Safety. Motorcycle helmet laws history. Arlington, VA: Insurance Institute for Highway Safety, Highway Loss Data Institute; 2012. Available at http://www.iihs.org/laws/helmet_history.html. Accessed May 11, 2012.
- National Conference of State Legislatures. State traffic safety legislation database. Washington, DC: National Conference of State Legislatures; 2012. Available at http://www.ncsl.org/?tabid=13599. Accessed May 11, 2012.
- Ulmer RG, Northrup VS. Evaluation of the repeal of the all rider motorcycle helmet law in Florida. Washington. DC: US Department of Transportation, National Highway Traffic Safety Administration; 2005. Available at http://www.nhtsa.gov/staticfiles/nti/motorcycles/pdf/809849.pdf. Accessed May 11, 2012.
- Cook LJ, Kerns T, Burch C, Thomas A, Bell E. Motorcycle helmet use and head and facial injuries: crash outcomes in CODES-linked data. Washington, DC: US Department of Transportation, National Highway Traffic Safety Administration; 2009. Available at http://www-nrd.nhtsa.dot.gov/pubs/811208.pdf. Accessed May 11, 2012.
- Croce MA, Zarzaur BL, Magnotti LJ, Fabian TC. Impact of motorcycle helmets and state laws on society's burden: a national study. Ann Surg 2009;250:390–4.
- National Highway Traffic Safety Administration. Traffic safety facts, 2009: motorcycles. Washington, DC: US Department of Transportation, National Highway Traffic Safety Administration; 2011. Available at http://www-nrd.nhtsa.dot.gov/Pubs/811389.pdf. Accessed May 11, 2012.
* Additional information available at http://www-nrd.nhtsa.dot.gov/pubs/811433.pdf, and at http://www-nrd.nhtsa.dot.gov/pubs/809861.pdf.
† Additional information available at http://www.nhtsa.gov/Data/National+Automotive+Sampling+System+(NASS)/NASS+General+Estimates+System.
§ 37% for preventing fatal injuries to riders and 41% for passengers, 13% for preventing serious injuries to riders and passengers, and 8% for preventing minor injuries to riders and passengers.
¶ Additional information available at http://www.nhtsa.gov/DOT/NHTSA/Communication%20&%20Consumer%20Information/Articles/Associated%20Files/EconomicImpact2000.pdf.
** Additional information available at http://www.fhwa.dot.gov/policyinformation/statistics/2010/mv1.cfm.
†† Data available at http://www.fhwa.dot.gov/ohim/hs00/pdf/mv1.pdf, and at http://www.fhwa.dot.gov/policyinformation/statistics/2010/mv1.cfm.
What is already known on this topic?
In 2010, motorcycle crashes made up 14% of all road traffic deaths, yet motorcycles accounted for <1% of all vehicle miles traveled. Helmet use prevents an estimated 37% of fatalities among motorcycle operators and 41% of fatalities among passengers.
What is added by this report?
Compared with motorcyclists in states with a universal helmet law during 2008–2010, fatally injured motorcyclists in states with a partial helmet law were more than five times as likely not to have been wearing a helmet, and fatally injured motorcyclists in states with no helmet law were more than six times as likely not to have been wearing a helmet. Economic costs saved in states with a universal helmet law were, on average, $725 per registered motorcycle, nearly four times greater than in states without such a law ($198). Although approximately $3 billion in economic costs were saved as a result of helmet use in the United States in 2010, another $1.4 billion could have been saved if all motorcyclists had worn helmets.
What are the implications for public health practice?
Helmet use by motorcyclists is proven to save lives, decrease the severity of crash injuries, and reduce costs. Universal helmet laws are demonstrated to be the most effective way to increase helmet use.
FIGURE 1. Percentage of motorcyclist fatalities in which riders were not wearing helmets, by state — United States, 2008–2010
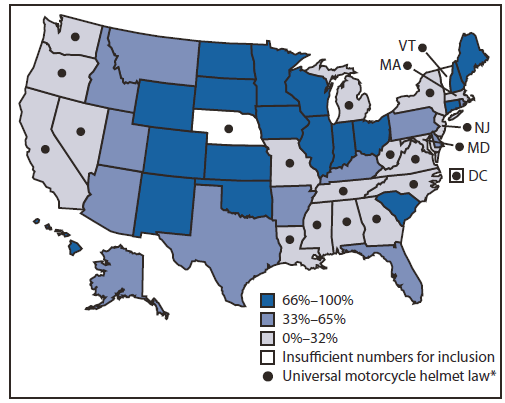
* All other states had partial helmet laws, with the exception of Iowa, Illinois, and New Hampshire, which had no helmet laws. Michigan changed to a partial helmet law in April 2012; however, this analysis reflects the situation during 2008–2010, when a universal helmet law was in effect.
Alternate Text: The figure above shows the percentage of motorcyclist fatalities among which riders were not wearing helmets, by state in the United States during 2008-2010. During 2008-2010, a total of 14,283 motorcyclists were killed in crashes, among whom 6,057 (42%) were not wear¬ing a helmet. In the 20 states with a universal helmet law, 739 (12%) fatally injured motorcyclists were not wearing a helmet, compared with 4,814 motorcyclists (64%) in the 27 states with partial helmet laws and 504 (79%) motorcyclists in the three states without a helmet law.
FIGURE 2. Estimated economic costs saved as a result of motorcycle helmet use, per registered motorcycle, by state — National Highway Traffic Administration, United States, 2010
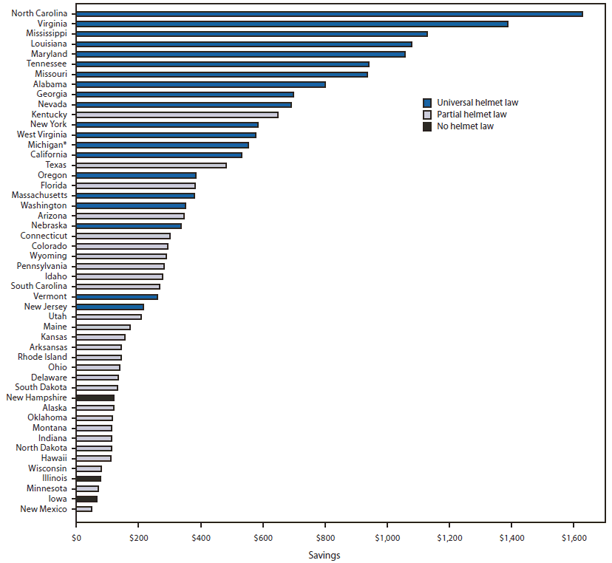
* Michigan changed to a partial helmet law in April 2012; however, this analysis reflects the situation during 2010, when a universal helmet law was in effect.
Alternate Text: The figure above shows the estimated economic costs saved as a result of motorcycle helmet use, per registered motorcycle, by state during 2010. In 2010, more than $3 billion in costs were saved as a result of helmet use in the United States; however, another $1.4 billion could have been saved if all motorcyclists had worn helmets. Total costs saved from helmet use ranged from $394 million in California to $2.6 million in New Mexico. Economic costs saved from helmet use per registered motorcycle ranged from $1,627 in North Carolina to $48 in New Mexico, with a median of $286.
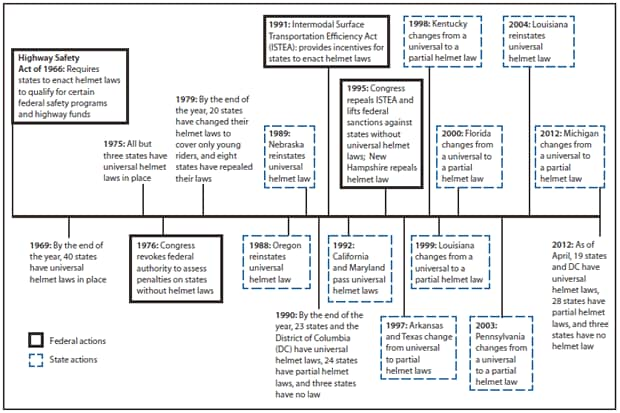
Alternate Text: The figure above shows a timeline for motorcycle helmet legislation in the United States during 1966-2012. As of April 2012, 19 states and the District of Columbia had universal helmet laws, 28 states had partial helmet laws, and three states had no helmet law. Motorcycle helmet legisla¬tion in the United States has been marked by change, with cycles of helmet law enactments followed by periods of helmet law repeals.
Use of trade names and commercial sources is for identification only and does not imply endorsement by the U.S. Department of
Health and Human Services.
References to non-CDC sites on the Internet are
provided as a service to MMWR readers and do not constitute or imply
endorsement of these organizations or their programs by CDC or the U.S.
Department of Health and Human Services. CDC is not responsible for the content
of pages found at these sites. URL addresses listed in MMWR were current as of
the date of publication.
All MMWR HTML versions of articles are electronic conversions from typeset documents.
This conversion might result in character translation or format errors in the HTML version.
Users are referred to the electronic PDF version (http://www.cdc.gov/mmwr)
and/or the original MMWR paper copy for printable versions of official text, figures, and tables.
An original paper copy of this issue can be obtained from the Superintendent of Documents, U.S.
Government Printing Office (GPO), Washington, DC 20402-9371;
telephone: (202) 512-1800. Contact GPO for current prices.
**Questions or messages regarding errors in formatting should be addressed to
mmwrq@cdc.gov.
