Persons using assistive technology might not be able to fully access information in this file. For assistance, please send e-mail to: mmwrq@cdc.gov. Type 508 Accommodation and the title of the report in the subject line of e-mail.
Tracking Progress Toward Global Polio Eradication, 2010–2011
In January 2012, polio eradication was declared a "programmatic emergency for global public health" by the Executive Board of the World Health Organization (WHO) (1). Since the Global Polio Eradication Initiative (GPEI) began in 1988 (2), progress has been tracked by surveillance of acute flaccid paralysis (AFP) cases and testing of linked stool specimens for polioviruses (PVs) in WHO-accredited Global Polio Laboratory Network (GPLN) laboratories, complemented by sewage testing (environmental surveillance) in selected areas. Monitoring AFP surveillance quality at national and subnational administrative levels using standard performance indicators identifies potential gaps where PV circulation might go undetected; monitoring specimen transport and laboratory reporting timeliness identifies areas where reporting delays could lead to late response, permitting ongoing transmission. This report provides an assessment of 2010–2011 performance indicators for AFP surveillance at national and subnational levels in polio-affected countries and laboratory reporting at the regional level, updated from 2009–2010 (3). Overall, 16 (62%) of 26 countries with circulating wild PV (WPV) met national AFP surveillance indicator targets during both 2010 and 2011. All three countries with reestablished WPV transmission and 16 of 19 countries with WPV outbreaks had substantial proportions (>20%) of their respective populations living in areas with underperforming surveillance during 2010 or 2011. Targets for timely reporting of PV isolation and type characterization results were met in three of six WHO regions in 2010 and five regions in 2011. To achieve polio eradication, efforts are needed to improve AFP surveillance and laboratory performance.
AFP Surveillance
AFP surveillance detects paralytic illness of many causes, including paralytic poliomyelitis caused by WPV. The objectives of AFP surveillance are to identify areas with PV transmission and areas with low AFP reporting where polio cases might go undetected. AFP surveillance sensitivity is measured by the annual proportion of AFP cases that are negative for WPV among children aged <15 years (nonpolio AFP [NPAFP] rate). Adequacy of stool specimen collection is measured by the proportion of AFP cases from which two adequate stool specimens (collected ≥24 hours apart and within 14 days after paralysis onset) arrived in good condition at a GPLN laboratory.
The WHO Region of the Americas, the Western Pacific Region, and European Region are certified as polio-free. However, four countries in the European Region (Kazakhstan, Tajikistan, Turkmenistan, and the Russian Federation) experienced WPV outbreaks in 2010, and China in the Western Pacific Region experienced an outbreak in 2011 (Table 1). Collectively, the polio-free regions maintained overall AFP surveillance sensitivity at the WHO-specified target NPAFP rate of ≥1 case per 100,000 children aged <15 years, and all but the Region of the Americas met the WHO-specified target of ≥80% AFP cases with adequate stool specimens at the regional level during 2010 and 2011 (Table 1).
During 2010–2011, a total of 21 countries in the polio-endemic African, Eastern Mediterranean, and South-East Asia regions experienced WPV transmission. Endemic WPV transmission continued in Afghanistan, Nigeria, and Pakistan. As of February 2012, endemic WPV transmission had ceased in India, with 42 WPV cases reported in 2010, one case reported in 2011, and no cases reported since (4,5). Reestablished transmission continued in the previously polio-free countries of Angola, Chad, and Democratic Republic of Congo (DRC) (6), and WPV outbreaks occurred in 13 African countries and Nepal during 2010–2011 (Table 1). A target NPAFP rate of ≥2 cases per 100,000 children aged <15 years has been established in the polio-endemic regions, all countries reporting WPV cases, and in neighboring countries at risk for WPV outbreaks (7). The three regions that had polio-endemic countries met the ≥2 NPAFP rate target and the ≥80% specimen adequacy regional target during 2010 and 2011 (Table 1).
Twenty-four (92%) of 26 polio-affected countries met the ≥2 NPAFP rate target in both 2010 and 2011 (Table 1). Eighteen (69%) of 26 of polio-affected countries met the ≥80% target for the proportion of AFP cases with adequate stool specimens in both 2010 and 2011 (Table 1). Among polio-affected countries, surveillance quality varied substantially at the subnational level (states and provinces). A NPAFP rate of ≥2 cases per 100,000 children aged <15 years in ≥80% of subnational areas was achieved in 19 (73%) countries in 2010, 16 (62%) countries in 2011, and 14 (54%) countries in both years (Table 1, Figure). Meeting the standard of ≥80% specimen adequacy in ≥80% of subnational areas was achieved in 14 (54%) countries in 2010, 12 (46%) countries in 2011, and 11 (42%) countries in both years (Table 1). The countries where ≥80% of the population lived in areas with AFP surveillance meeting targets during 2010 and 2011 included all four countries with endemic WPV transmission, none of the three countries with reestablished WPV transmission, and three of 19 countries with WPV outbreaks.
GPLN
The GPLN, established in 1990 by WHO, consists of 146 laboratories in 97 countries. Accredited members in the network follow standardized protocols and procedures appropriate for each laboratory tier: 1) isolation and identification of PVs; 2) intratypic differentiation (ITD) of the three (1, 2, and 3) WPV serotypes, Sabin vaccine–related PVs, and vaccine-derived PVs (VDPVs) (8); and 3) genomic sequencing of the VP1 region of WPVs and VDPVs to investigate transmission links among isolates. The laboratory performance standard for five of the six WHO regions is to report PV isolation results for ≥80% of specimens within 14 days of receipt; in 2011, the European Region and China (Western Pacific Region) maintained a standard of PV isolation and serotyping within 28 days. Although the introduction of real-time polymerase chain reaction assays into laboratories allows ITD testing within 7 days (9), the official standard in five WHO regions for timely reporting of ITD results is within 60 days of paralysis onset, allowing time for case detection, investigation, and transport of specimens; however, the Eastern Mediterranean Region introduced an ITD reporting standard of 45 days.
Targets for timely reporting of PV detection were met in five WHO regions in 2011, compared with four WHO regions in 2010, when delays occurred during the European outbreak because of batching of samples (Table 2). Five WHO regions met the standard of reporting ITD results within 60 days of paralysis onset for ≥80% of specimens for both 2010 and 2011 (Table 2). The Region of the Americas was the only region meeting neither timeliness standard in 2011.
GPLN tested 206,899 stool specimens from AFP case investigations in 2011, a 6% increase from the 194,374 stool specimens tested in 2010. A total of 10,235 PV isolates (including 1,570 WPVs and 86 VDPVs) were detected in 2011 from AFP case specimens, a 13% increase from 9,090 PV isolates (including 1,679 WPVs and 188 VDPVs) in 2010 because of an increase in Sabin-related PV isolation. During 2010–2011, a total of 274 (1.7%) of the 16,076 vaccine-related viruses screened were determined by genomic sequencing to be VDPVs (Table 2). Genomic sequencing identified three genotypes in the African Region during 2011: WPV1 West Africa-B (WEAF-B) in Chad, Central African Republic, Kenya, Niger, and Nigeria; WPV3 WEAF-B in Chad, Côte d'Ivoire, Guinea, Mali, and Nigeria; and WPV1 South Asia (SOAS) in Angola, Congo, DRC, and Gabon. In the Eastern Mediterranean Region, WPV3 SOAS isolates were detected in Pakistan, and WPV1 SOAS isolates were detected in Pakistan and Afghanistan. Sequence analysis provided evidence that AFP surveillance of varying qualities had missed chains of WPV transmission during 2011 in Afghanistan, Angola, Chad, Côte d'Ivoire, Kenya, Mali, Nigeria, and Pakistan.
Environmental Surveillance
During 2010–2011, environmental surveillance of WPV transmission was accomplished through testing of sewage samples (10) in 21 countries without active PV transmission (20 counties in the European Region and Egypt in the Eastern Mediterranean Region) and three countries with WPV transmission (India, Nigeria, and Pakistan). In India, sewage sampling expanded from 10 sites in two states in 2010 to 15 sites in four states in 2011. The last detected WPV from sewage testing in India was in November 2010 (4). In Pakistan (with 18 sites in four states), widespread WPV1 circulation was detected in sewage during 2010–2011, although WPV3 has not been detected in sewage since October 2010. Sewage testing in Nigeria began in 2011 (with three sites in Kano state) and detected only circulating VDPVs (and no WPVs) during 2011, despite the continued occurrence of WPV cases (3).
Reported by
Polio Eradication Dept, World Health Organization, Geneva, Switzerland. Div of Viral Diseases, Global Immunization Div, Center for Global Health; Heather M. Scobie, PhD, EIS Officer, CDC. Corresponding contributor: Heather M. Scobie, hscobie@cdc.gov, 404-718-4543.
Editorial Note
The GPEI relies on sensitive AFP surveillance (complemented by environmental surveillance) and virologic testing and sequencing to track the transmission of PVs globally. Standardized case definitions, protocols for case investigation and laboratory testing, and surveillance performance indicators, allow comparability across countries and WHO regions. Assessing subnational surveillance indicators is important because national indicators can mask substantial gaps in surveillance quality.
AFP surveillance performance among polio-affected countries during 2010–2011 was varied, with some key countries not meeting indicator targets. Genomic sequence analysis of WPV isolates provided evidence that several chains of transmission were missed by deficiencies in AFP surveillance during 2010–2011, including some countries where subnational performance standards were met. Among countries with reestablished transmission, Angola had subnational gaps in NPAFP detection that worsened from 2010 to 2011; although Chad and DRC struggled to attain subnational stool specimen adequacy standards in both years, both showed slight improvement from 2010 to 2011. Countries with WPV outbreaks also had surveillance gaps, with 12 (63%) of 19 countries having majorities of their populations residing in subnational areas with poor AFP surveillance in either 2010 or 2011. The clustering of states and provinces with substandard surveillance indicators within countries and across borders (as observed in Central and West Africa) also is concerning. Detailed AFP surveillance reviews are being conducted or planned in countries with suboptimal surveillance indicators or with evidence of missed WPV transmission from genomic sequence analysis to assess reasons for poor performance in AFP case detection, specimen collection, and reporting, and to make recommendations for improving surveillance quality.
Combined with sensitive AFP surveillance, environmental surveillance has provided additional evidence to monitor the absence of WPV transmission in India and the extent of WPV transmission in Pakistan. However, a lack of WPV detection in sewage does not exclude the possibility of ongoing transmission if areas and populations at highest risk for WPV transmission are not included. Environmental surveillance could be expanded in countries where undetected transmission is a concern or where the risk for importation is high. Feasibility assessments in Luanda, Angola, and Nairobi, Kenya, are planned.
GPLN overall performance during 2010–2011 remains high and actually improved in 2011, despite continued annual increases in workload (9% in 2010 [3] and 6% in 2011). Over 90% of PV isolation and ITD results were reported within the target periods. The prompt provision of laboratory test results allows a more rapid and well-targeted response. Timely ITD of PVs in the African Region has been complicated by difficulties in international specimen transport (3), which is a challenge that needs to be addressed continually.
To achieve polio eradication, national immunization programs and partners should make greater efforts to strengthen polio surveillance and to improve monitoring at all administrative levels, especially in polio-affected countries and neighboring countries at risk for outbreaks. Evidence also suggests that maintenance of high-quality AFP surveillance in polio-free regions is critical. These efforts require strengthened commitments on all levels and the provision of sufficient human and financial resources to meet target indicators at both national and subnational levels.
References
- World Health Organization Executive Board. Poliomyelitis: intensification of the global eradication initiative. Geneva, Switzerland: World Health Organization; 2012. Available at http://apps.who.int/gb/ebwha/pdf_files/eb130/b130_r10-en.pdf. Accessed April 10, 2012.
- CDC. Progress toward interruption of wild poliovirus transmission—worldwide, January 2010–March 2011. MMWR 2011;60:582–6.
- CDC. Tracking progress toward global polio eradication—worldwide, 2009–2010. MMWR 2011;60:441–5.
- CDC. Progress toward poliomyelitis eradication—India, January 2010–September 2011. MMWR 2011;60:1482–6.
- World Health Organization. Global Polio Eradication Initiative: three to go. Geneva, Switzerland: World Health Organization; 2012. Available at http://www.polioeradication.org/tabid/461/iid/201/default.aspx. Accessed April 10, 2012.
- CDC. Progress toward global polio eradication—Africa, 2011. MMWR 2012;61:190–4.
- World Health Organization. Conclusions and recommendations of the Advisory Committee on Poliomyelitis Eradication, Geneva, 11–12 October 2005. Wkly Epidemiol Rec 2010;80:410–6.
- CDC. Update on vaccine-derived polioviruses—worldwide, July 2009–March 2011. MMWR 2011;60:846–50.
- CDC. Laboratory surveillance for wild and vaccine-derived polioviruses—worldwide, January 2008–June 2009. MMWR 2009;58:950–4.
- Deshpande JM, Shetty SJ, Siddiqui ZA. Environmental surveillance system to track wild poliovirus transmission. Appl Environ Microbiol 2003;69:2919–27.
What is already known on this topic?
The Global Polio Eradication Initiative (GPEI) tracks progress towards polio eradication through surveillance of acute flaccid paralysis (AFP) cases, testing of linked stool specimens for polioviruses (PVs), typing and sequencing of PVs to track transmission, as well as environmental sewage testing. Standardized case definitions, case investigation and laboratory protocols, and performance indicator targets allow comparability of surveillance performance across countries over time.
What is added by this report?
AFP surveillance is suboptimal in some key countries and unimproved overall. During 2010–2011, only 62% of countries with circulating wild PV (WPV) met national AFP surveillance indicator targets. Surveillance at the subnational level varied, and sequencing of WPV isolates provided evidence that several chains of transmission were missed by AFP surveillance deficiencies. All three countries with reestablished WPV transmission and 16 of 19 countries with WPV outbreaks had >20% of their respective populations living in areas with underperforming surveillance during 2010 or 2011.
What are the implications for public health practice?
Assessing subnational surveillance quality indicators is important in identifying areas where WPV transmission might go undetected and would otherwise be masked by national indicators. Given the current elevated status of polio eradication as a "programmatic emergency for global public health," efforts are needed to improve or maintain sufficient AFP surveillance quality at all administrative levels to track PV transmission and provide timely response to new PV importations.
|
TABLE 1. National and subnational acute flaccid paralysis (AFP) surveillance indicators and number of confirmed wild poliovirus (WPV) cases in persons with AFP, by World Health Organization (WHO) region and polio-affected country, 2010 and 2011* |
||||||||||||||
|---|---|---|---|---|---|---|---|---|---|---|---|---|---|---|
|
WHO region†/country |
2010 |
2011 |
||||||||||||
|
No. of AFP cases |
National NPAFP rate§ |
% subnational areas with NPAFP rate ≥2¶ |
National % AFP cases with adequate specimens** |
% subnational areas with ≥80% adequate specimens |
% population in areas meeting both indicators |
No. of confirmed WPV cases |
No. of AFP cases |
National NPAFP rate§ |
% subnational areas with NPAFP rate ≥2¶ |
National % AFP cases with adequate specimens** |
% subnational areas with ≥80% adequate specimens |
% population in areas meeting both indicators |
No. of confirmed WPV cases |
|
|
Americas |
2,006 |
1.2 |
— |
79 |
— |
— |
— |
1,728 |
1.0 |
— |
78 |
— |
— |
— |
|
African |
16,500 |
4.3 |
— |
87 |
— |
— |
657 |
16,635 |
4.4 |
— |
88 |
— |
— |
350 |
|
Angola†† |
387 |
3.1 |
94 |
87 |
83 |
76 |
33 |
257 |
2.3 |
56 |
91 |
89 |
43 |
5 |
|
CAR§§ |
137 |
7.2 |
100 |
89 |
86 |
87 |
— |
142 |
6.0 |
100 |
81 |
71 |
68 |
4 |
|
Chad†† |
302 |
4.5 |
94 |
67 |
17 |
12 |
26 |
468 |
5.7 |
100 |
75 |
39 |
33 |
132 |
|
Congo§§ |
582 |
5.1 |
100 |
23 |
27 |
7 |
441 |
93 |
3.1 |
60 |
74 |
55 |
20 |
1 |
|
Côte d'Ivoire§§ |
309 |
3.3 |
95 |
79 |
53 |
47 |
— |
511 |
5.1 |
95 |
64 |
0 |
0 |
36 |
|
DRC†† |
2,194 |
5.5 |
100 |
73 |
18 |
24 |
100 |
2,216 |
4.9 |
100 |
79 |
27 |
34 |
93 |
|
Gabon§§ |
24 |
2.7 |
50 |
46 |
30 |
19 |
— |
30 |
2.9 |
0 |
60 |
33 |
10 |
1 |
|
Guinea§§ |
215 |
4.0 |
100 |
67 |
13 |
9 |
— |
203 |
3.7 |
100 |
68 |
0 |
0 |
3 |
|
Kenya§§ |
403 |
2.2 |
88 |
87 |
88 |
66 |
— |
563 |
3.1 |
88 |
82 |
75 |
49 |
1 |
|
Liberia§§ |
50 |
2.8 |
60 |
88 |
79 |
36 |
2 |
55 |
3.3 |
40 |
85 |
80 |
34 |
— |
|
Mali§§ |
171 |
2.2 |
50 |
93 |
100 |
53 |
4 |
210 |
2.7 |
100 |
84 |
67 |
64 |
7 |
|
Mauritania§§ |
65 |
4.4 |
86 |
97 |
100 |
90 |
5 |
53 |
3.8 |
100 |
92 |
92 |
90 |
— |
|
Niger§§ |
358 |
4.4 |
100 |
73 |
25 |
32 |
2 |
319 |
3.9 |
88 |
72 |
13 |
3 |
5 |
|
Nigeria¶¶ |
5,996 |
7.9 |
100 |
93 |
100 |
100 |
21 |
6,096 |
8.1 |
100 |
93 |
100 |
100 |
62 |
|
Senegal§§ |
312 |
5.3 |
100 |
59 |
9 |
6 |
18 |
115 |
2.1 |
55 |
79 |
55 |
38 |
— |
|
Sierra Leone§§ |
168 |
6.3 |
100 |
86 |
75 |
77 |
1 |
173 |
6.6 |
100 |
83 |
50 |
57 |
— |
|
Uganda§§ |
424 |
2.9 |
61 |
87 |
75 |
45 |
4 |
466 |
3.2 |
53 |
87 |
71 |
41 |
— |
|
Eastern Mediterranean |
11,338 |
5.6 |
— |
91 |
— |
— |
169 |
11,669 |
5.7 |
— |
90 |
— |
— |
278 |
|
Afghanistan¶¶ |
1,572 |
8.8 |
100 |
93 |
97 |
95 |
25 |
1,827 |
10.0 |
100 |
92 |
91 |
91 |
80 |
|
Pakistan¶¶ |
5,392 |
6.7 |
88 |
88 |
100 |
99 |
144 |
5,696 |
7.0 |
100 |
88 |
88 |
95 |
198 |
|
European |
2,087 |
1.2 |
— |
86 |
— |
— |
478 |
1,542 |
1.3 |
— |
86 |
— |
— |
— |
|
Kazakhstan§§ |
112 |
3.5 |
73 |
99 |
100 |
80 |
1 |
100 |
3.2 |
93 |
97 |
94 |
88 |
— |
|
Russian Federation§§ |
387 |
1.7 |
28 |
95 |
93 |
26 |
14 |
354 |
1.6 |
28 |
93 |
88 |
18 |
— |
|
Tajikistan§§ |
583 |
5.3 |
80 |
87 |
80 |
53 |
460 |
52 |
2.1 |
60 |
96 |
100 |
69 |
— |
|
Turkmenistan§§ |
50 |
3.2 |
83 |
100 |
100 |
91 |
3 |
33 |
2.3 |
50 |
100 |
100 |
32 |
— |
|
South-East Asia |
60,456 |
11.2 |
— |
83 |
— |
— |
48 |
65,604 |
12.2 |
— |
85 |
— |
— |
1 |
|
India¶¶ |
55,785 |
12.4 |
94 |
83 |
76 |
87 |
42 |
59,683 |
13.6 |
91 |
84 |
79 |
87 |
1 |
|
Nepal§§ |
604 |
5.4 |
100 |
88 |
80 |
90 |
6 |
566 |
5.1 |
100 |
88 |
80 |
90 |
— |
|
Western Pacific |
6,401 |
1.8 |
— |
89 |
— |
— |
— |
7,247 |
2.0 |
— |
90 |
— |
— |
21 |
|
China§§ |
5,285 |
1.9 |
27 |
91 |
100 |
37 |
— |
6,136 |
2.8 |
77 |
94 |
100 |
89 |
21 |
|
Total |
98,788 |
5.6 |
— |
85 |
— |
— |
1,352 |
104,425 |
5.9 |
— |
86 |
— |
— |
650 |
|
Abbreviations: NPAFP = nonpolio AFP, CAR = Central African Republic, DRC = Democratic Republic of Congo. * Data as of February 21, 2012. † Regional NPAFP rates use United Nations Development Program populations as denominators, and thus tend to be higher than country rates, which use their own subnational populations as denominators. Regional data available at http://apps.who.int/immunization_monitoring/en/diseases/poliomyelitis/case_count.cfm. § Per 100,000 persons aged <15 years. ¶ For subnational areas (states and provinces) with populations >100,000. ** Standard WHO target is adequate stool specimen collection from ≥80% of AFP cases, in which two specimens are collected ≥24 hours apart and within 14 days of paralysis onset, shipped on ice or frozen ice packs, and arriving in good condition in a WHO-accredited laboratory. Stool adequacy proportions from regions and countries in the European Region and China do not include the criteria of good stool specimen condition. For the Americas, an adequate stool specimen is one specimen collected within 14 days of paralysis onset. †† Countries with reestablished WPV transmission. §§ Countries with WPV outbreaks. ¶¶ Countries with endemic WPV transmission. |
||||||||||||||
FIGURE. Combined performance indicators for the quality of acute flaccid paralysis (AFP) surveillance* in subnational areas (states and provinces) of 26 current or recently polio-affected countries and neighboring countries, 2011†
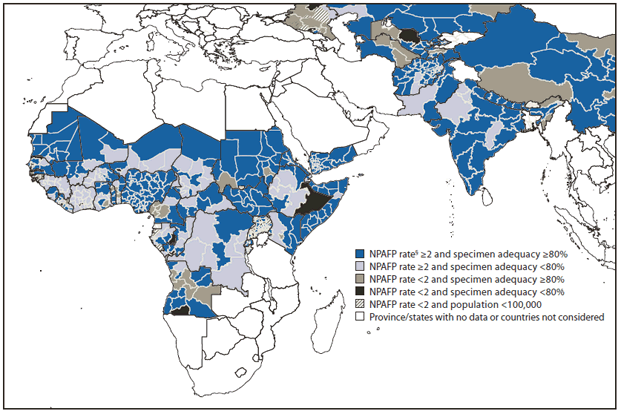
Abbreviation: NPAFP = nonpolio AFP.
* The Global Polio Eradication Initiative 2010−2012 strategic plan sets the following targets for countries with current or recent wild poliovirus (WPV) transmission and their states/provinces: 1) an NPAFP detection rate of ≥2 cases per 100,000 persons aged <15 years, and 2) adequate stool specimen collection from ≥80% of AFP cases, with specimen adequacy defined as two specimens collected ≥24 hours apart, both within 14 days of paralysis onset, shipped on ice or frozen ice packs, and arriving in good condition (without leakage or desiccation) at a World Health Organization–accredited laboratory.
† Data are for AFP cases with onset during 2011, reported as of February 21, 2012.
§ Per 100,000 persons aged <15 years.
Alternate Text: The figure above shows combined performance indicators for the quality of acute flaccid paralysis surveillance in subnational areas (states and provinces) of 26 current or recently polio-affected countries and neighboring countries during 2011. A nonpolio acute flaccid paralysis rate of ≥2 cases per 100,000 children aged <15 years in ≥80% of subnational areas was achieved in 19 (73%) countries in 2010, 16 (62%) countries in 2011, and 14 (54%) countries in both years.
Use of trade names and commercial sources is for identification only and does not imply endorsement by the U.S. Department of
Health and Human Services.
References to non-CDC sites on the Internet are
provided as a service to MMWR readers and do not constitute or imply
endorsement of these organizations or their programs by CDC or the U.S.
Department of Health and Human Services. CDC is not responsible for the content
of pages found at these sites. URL addresses listed in MMWR were current as of
the date of publication.
All MMWR HTML versions of articles are electronic conversions from typeset documents.
This conversion might result in character translation or format errors in the HTML version.
Users are referred to the electronic PDF version (http://www.cdc.gov/mmwr)
and/or the original MMWR paper copy for printable versions of official text, figures, and tables.
An original paper copy of this issue can be obtained from the Superintendent of Documents, U.S.
Government Printing Office (GPO), Washington, DC 20402-9371;
telephone: (202) 512-1800. Contact GPO for current prices.
**Questions or messages regarding errors in formatting should be addressed to
mmwrq@cdc.gov.
