Persons using assistive technology might not be able to fully access information in this file. For assistance, please send e-mail to: mmwrq@cdc.gov. Type 508 Accommodation and the title of the report in the subject line of e-mail.
Vital Signs: Overdoses of Prescription Opioid Pain Relievers --- United States, 1999--2008
On November 1, 2011, this report was posted as an MMWR Early Release on the MMWR website (http://www.cdc.gov/mmwr).
Abstract
Background: Overdose deaths involving opioid pain relievers (OPR), also known as opioid analgesics, have increased and now exceed deaths involving heroin and cocaine combined. This report describes the use and abuse of OPR by state.
Methods: CDC analyzed rates of fatal OPR overdoses, nonmedical use, sales, and treatment admissions.
Results: In 2008, drug overdoses in the United States caused 36,450 deaths. OPR were involved in 14,800 deaths (73.8%) of the 20,044 prescription drug overdose deaths. Death rates varied fivefold by state. States with lower death rates had lower rates of nonmedical use of OPR and OPR sales. During 1999--2008, overdose death rates, sales, and substance abuse treatment admissions related to OPR all increased substantially.
Conclusions: The epidemic of overdoses of OPR has continued to worsen. Wide variation among states in the nonmedical use of OPR and overdose rates cannot be explained by underlying demographic differences in state populations but is related to wide variations in OPR prescribing.
Implications for Public Health Practice: Health-care providers should only use OPRs in carefully screened and monitored patients when non-OPR treatments are insufficient to manage pain. Insurers and prescription drug monitoring programs can identify and take action to reduce both inappropriate and illegal prescribing. Third-party payers can limit reimbursement in ways that reduce inappropriate prescribing, discourage efforts to obtain OPR from multiple health-care providers, and improve clinical care. Changes in state laws that focus on the prescribing practices of health-care providers might reduce prescription drug abuse and overdoses while still allowing safe and effective pain treatment.
Introduction
In 2007, nearly 100 persons per day died of drug overdoses in the United States (1). The death rate of 11.8 per 100,000 population in 2007 was roughly three times the rate in 1991. Prescription drugs have accounted for most of the increase in those death rates since 1999 (2). In 2009, 1.2 million emergency department (ED) visits (an increase of 98.4% since 2004) were related to misuse or abuse of pharmaceuticals, compared with 1.0 million ED visits related to use of illicit drugs such as heroin and cocaine (3). Prominent among these prescription drug--related deaths and ED visits are opioid pain relievers (OPR), also known as narcotic or opioid analgesics, a class of drugs that includes oxycodone, methadone, and hydrocodone, among others. OPR now account for more overdose deaths than heroin and cocaine combined. OPR frequently are diverted for nonmedical use by patients or their friends or sold on the street. In 2010, 4.8% of the U.S. population aged ≥12 years used OPR nonmedically (4). Nonmedical use of OPR costs insurance companies up to $72.5 billion annually in health-care costs (5).
States regulate the use of prescription drugs, such as OPR, and the practices of prescribers and pharmacists. States also finance and regulate health care for Medicaid populations, which are at greater risk for overdose (6). States therefore have a central role in ensuring that OPR are used legally and safely.
Comparisons among jurisdictions in drug overdose mortality, nonmedical use of OPR, and OPR sales can help identify risk factors and effective prevention measures. Among the states, OPR sales varied fourfold in 2002 (7), and death rates for overdoses involving OPR varied from 1.8 to 15.6 per 100,000 population in 2006 (2). More rural and more impoverished counties tend to have higher prescription drug overdose death rates (8,9).
Methods
For this report, death rates are based on the National Vital Statistics System multiple cause of death files (10). Rates were age-adjusted to the 2000 U.S. Census population using bridged-race* population figures. Drug poisoning deaths, referred to as drug overdose deaths in this report, were defined as those with an underlying cause of death classified by the International Classification of Diseases, 10th Revision (ICD-10) external cause of injury codes as X40--X44, X60--X64, X85, or Y10--Y14. Rates include injury deaths of any intent (unintentional, suicide, homicide, or undetermined) for U.S. residents. Among deaths with drug overdose as the underlying cause, CDC identified the type of drug involved using ICD-10 codes: prescription drugs (T36--T39, T40.2--T40.4, T41--T43.5, and T43.7--T50.8), including prescription opioid pain relievers (T40.2--T40.4); illicit drugs (T40.1, T40.5, T40.7--T40.9, and T43.6); or only unspecified drugs (T50.9 alone). The prescription drug category includes some over-the-counter medications. Some deaths involved prescription and illicit drugs and are counted in both drug categories. Years of potential life lost (YPLL) before age 65 years were calculated by subtracting age at death from 65 years and summing to get the total YPLL.
Rates of nonmedical OPR use in the past year by state were obtained from the 2008--2009 National Surveys on Drug Use and Health (NSDUH) (11). Nonmedical use was defined as use of a prescription pain reliever without a prescription belonging to the respondent or use for the experience or feeling the drug causes. The prescription pain reliever category includes OPR and selected barbiturate combination products used for headaches.
Annual drug sales for 1999--2010 were determined from the Automation of Reports and Consolidated Orders System (ARCOS) of the Drug Enforcement Administration (DEA) (12). For this report, ARCOS sales data were used as a surrogate for OPR use. DEA provided data on sales to pharmacies, hospitals, and practitioners for codeine, fentanyl, hydrocodone, hydromorphone, meperidine, methadone, morphine, and oxycodone (Kyle Wright, personal communication, April 11, 2011). Sales of drugs to substance abuse treatment programs were not included. Amounts of drugs were standardized to morphine milligram equivalents (13).
The percentage of the state population below the federal poverty level by race and ethnicity during 2007--2008 was provided by the Kaiser Family Foundation (Rachel Licata, personal communication, August 10, 2011). Trends in substance abuse treatment admission rates were based on the Treatment Episode Data Set (14). Rates were calculated for admissions for treatment of substance abuse where the primary substance was an OPR.
Spearman's correlation coefficient was used to correlate the absolute increase in the non-Hispanic white overdose death rate during 1999--2008 with poverty level by state. Fisher's exact test was used to compare the proportions of states above and below national rates. Test results are statistically significant at p<0.05.
Results
In 2008, a total of 36,450 deaths were attributed to drug overdose, a rate of 11.9 per 100,000 population (Table 1), among which a drug was specified in 27,153 (74.5%) deaths. One or more prescription drugs were involved in 20,044 (73.8%) of the 27,153 deaths, and OPR were involved in 14,800 (73.8%) of the 20,044 prescription drug overdose deaths. Rates varied by sex, race/ethnicity, and age. For deaths involving OPR, the rate among non-Hispanic whites and American Indians/Alaska Natives was three times higher than the rates in blacks and Hispanic whites. All death rates were highest among persons aged 35--54 years. Overdose resulted in 830,652 YPLL before age 65 years, a number comparable to the YPLL from motor vehicle crashes.
Rates for all outcomes studied varied widely by state (Table 2, Figure 1)† Overdose death rates ranged from 5.5 per 100,000 population in Nebraska to 27.0 in New Mexico. The prevalence of nonmedical use of OPR during 2008--2009 ranged from 3.6% in Nebraska to 8.1% in Oklahoma. The rate of OPR sales ranged from 3.7 kg per 10,000 population in Illinois to 12.6 kg in Florida. The highest sales rates were clustered in the Southeast and the Northwest. Among the 27 states with overdose death rates above the national rate, 21 (77.8%) had rates of nonmedical use above the national rate. Among the 24 states with death rates at or below the national rate, six (25.0%) had rates of nonmedical use above the national rate (p<0.001). Among the 27 states with death rates above the national rate, 21 (77.8%) had rates of OPR sales above the national rate. Among the 24 states with death rates at or below the national rate, five (20.8%) had rates of OPR sales above the national rate (p<0.001).
During 1999--2008, overdose death rates, sales, and substance abuse treatment admissions related to OPR increased in parallel (Figure 2). The overdose death rate in 2008 was nearly four times the rate in 1999. Sales of OPR in 2010 were four times those in 1999. The substance abuse treatment admission rate in 2009 was almost six times the rate in 1999. The rate of sales of OPR in 2010, 7.1 kg per 10,000 population, was equivalent to 710 mg per person in the United States. The percentage of the non-Hispanic white population below the poverty level during 2007--2008 correlated positively with the increase in overdose death rates among non-Hispanic whites from 1999 to 2008 by state (r = 0.54; p<0.001). Louisiana, Mississippi, Kentucky, and West Virginia had some of the largest mortality increases and some of the highest poverty levels among non-Hispanic whites.
Conclusions and Comment
The epidemic of prescription drug overdoses in the United States has worsened over the last decade, and by 2008, drug overdose deaths (36,450) were approaching the number of deaths from motor vehicle crashes (39,973), the leading cause of injury death in the United States. Parallel trends in deaths and OPR sales between 1999 and 2008, combined with continuing upward trends in ED visits (4), OPR abuse treatment admissions (14), and OPR sales after 2008 suggest that the death rate also has increased since 2008. Preliminary 2009 death data are consistent with such an increase (15). These increases occurred despite numerous warnings and recommendations over the past decade for voluntary education of providers about more cautious use of OPR (16).
Differences in OPR overdose mortality by race/ethnicity match the pattern for medical and nonmedical use of OPR, with the lowest rates for medical and nonmedical use among Asians and blacks and the highest rates among American Indians/Alaska Natives and non-Hispanic whites (4,17). Differences in OPR overdose mortality by race and ethnicity cannot explain the wide variation in death rates among states, given the equally large differences in non-Hispanic white mortality between states. Nor can demographic differences fully explain the wide variations among states in the nonmedical use and sales of OPR. Montana and Iowa, for example, have largely non-Hispanic white populations but widely varying rates of nonmedical use and sales of OPR.
By 2010, enough OPR were sold to medicate every American adult with a typical dose of 5 mg of hydrocodone every 4 hours for 1 month. Increased use of OPR has contributed to the overall increases in rates of overdose death and nonmedical use, and variation among states in OPR sales probably contributes to state variation in these outcomes. Given that 3% of physicians accounted for 62% of the OPR prescribed in one study (18), the proliferation of high-volume prescribers can have a large impact on state use of OPR and overdose death rates. Large increases in overdoses involving the types of drugs sold by illegitimate pain clinics (i.e., "pill mills") have been reported in Florida (19) and Texas (20). Such clinics provide OPR to large volumes of patients without adequate evaluation or follow-up. Another possible contributor to state disparities is poverty, which was associated with greater increases in state death rates during 1999--2008. Medicaid populations are at greater risk of OPR overdose than non-Medicaid populations (6).
The findings in this report are subject to at least four limitations. First, vital statistics underestimate the rates of prescription and illicit drugs because the type of drug is not specified on many death certificates. Second, respondents might underreport nonmedical use of OPR in surveys such as the NSDUH. Third, ARCOS data reflect sales to retail outlets by state, but some drugs might have been used by nonstate residents or sent to other states by mail-order pharmacies or otherwise not used by state residents. Finally, sales data did not include buprenorphine, an opioid primarily used for substance abuse treatment, though sometimes prescribed for pain. Its inclusion with drugs primarily used to treat pain would have inappropriately increased sales rates.
Public health interventions to reduce prescription drug overdose must strike a balance between reducing misuse and abuse and safeguarding legitimate access to treatment. To find this balance, health-care providers should only use OPR in carefully screened and monitored patients when non-OPR treatments have not been sufficient to treat pain, as recommended in evidence-based guidelines (21). States, as regulators of health-care practice, have the responsibility and authority to monitor and correct inappropriate and illegal prescribing. Data from state prescription drug monitoring programs, which collect records of prescription drugs prone to abuse from pharmacies, and Medicaid claims data can be used to identify and address OPR misuse and abuse. State Medicaid programs and other public insurers can use economic measures to hold providers accountable for their prescribing of OPR and other controlled prescription drugs. State professional licensing boards can take action against prescribers misusing their licenses, and law enforcement agencies can take action against illegal activities. State policies that focus on providers operating outside of normal medical practice, such as laws prohibiting so-called "pill mills," are a promising approach (19). All interventions need to be evaluated further and new interventions developed. Concerted attempts to address this problem, especially in states with high rates of OPR sales, nonmedical use, or overdose mortality, might help control the epidemic.
Reported by
Leonard J. Paulozzi, MD, Christopher M. Jones, PharmD, Karin A. Mack, PhD, Rose A. Rudd, MSPH, Div of Unintentional Injury Prevention, National Center for Injury Prevention and Control, CDC. Corresponding contributor: Leonard J. Paulozzi, lpaulozzi@cdc.gov.
References
- CDC. WONDER [Database]. Atlanta, GA: US Department of Health and Human Services, CDC; 2010. Available at http://wonder.cdc.gov. Accessed September 27, 2011.
- Warner M, Chen L, Makuc D. Increase in fatal poisonings involving opioid analgesics in the United States, 1999--2006. NCHS Data Brief. Hyattsville, MD: National Center for Health Statistics; 2009. Available at http://www.cdc.gov/nchs/data/databriefs/db22.htm. Accessed October 3, 2011.
- Substance Abuse and Mental Health Services Administration. Highlights of the 2009 Drug Abuse Warning Network (DAWN) findings on drug-related emergency department visits. The DAWN Report. Rockville, MD: US Department of Health and Human Services, Substance Abuse and Mental Health Services Administration; 2010. Available at http://oas.samhsa.gov/2k10/dawn034/edhighlights.htm. Accessed October 3, 2011.
- Substance Abuse and Mental Health Services Administration. Results from the 2009 National Survey on Drug Use and Health: volume 1: summary of national findings. Rockville, MD: US Department of Health and Human Services, Substance Abuse and Mental Health Services Administration, Office of Applied Studies; 2010. Available at http://oas.samhsa.gov/nsduh/2k9nsduh/2k9resultsp.pdf. Accessed October 3, 2011.
- Coalition Against Insurance Fraud. Prescription for peril: how insurance fraud finances theft and abuse of addictive prescription drugs. Washington, DC: Coalition Against Insurance Fraud; 2007. Available at http://www.insurancefraud.org/downloads/drugDiversion.pdf. Accessed September 26, 2011.
- CDC. Overdose deaths involving prescription opioids among Medicaid enrollees---Washington, 2004--2007. MMWR 2009;58:1171--5.
- Paulozzi LJ, Ryan GW. Opioid analgesics and rates of fatal drug poisoning in the United States. Am J Prev Med 2006;31:506--11.
- Hall AJ, Logan JE, Toblin RL, et al. Patterns of abuse among unintentional pharmaceutical overdose fatalities. JAMA 2008;300:2613--20.
- Paulozzi LJ, Xi Y. Recent changes in drug poisoning mortality in the United States by urban--rural status and by drug type. Pharmacoepidemiol Drug Safety 2008;17:997--1005.
- Xu J, Kochanek KD, Murphy S, Tejada-Vera B. Deaths: final data for 2007. Natl Vital Stat Rep 2010;58(19). Available at http://www.cdc.gov/nchs/data/nvsr/nvsr58/nvsr58_19.pdf. Accessed October 3, 2011.
- Substance Abuse and Mental Health Services Administration. State estimates of substance use and mental disorders from the 2008--2009 National Surveys on Drug Use and Health. NSDUH Series H-40. Rockville, MD: US Department of Health and Human Services, Substance Abuse and Mental Health Services Administration; 2011. Available at http://store.samhsa.gov/shin/content/SMA11-4641/SMA11-4641.pdf. Accessed October 3, 2011.
- US Department of Justice. Automation of Reports and Consolidated Orders System (ARCOS). Springfield, VA: US Department of Justice, Drug Enforcement Administration; 2011. Available at http://www.deadiversion.usdoj.gov/arcos/index.html. Accessed September 26, 2011.
- Gammaitoni AR, Fine P, Alvarez N, McPherson M, Bergmark S. Clinical application of opioid equianalgesic data. Clin J Pain 2003;19:286--97.
- Substance Abuse and Mental Health Services Administration. Quick statistics from the Drug and Alcohol Services Information System. Rockville, MD: Substance Abuse and Mental Health Services Administration; 2011. Available at http://www.oas.samhsa.gov/quick.cfm. Accessed September 29, 2011.
- Kochanek KD, Xu JQ, Murphy SL, et al. Deaths: preliminary data for 2009. Natl Vital Stat Rep 2011;59(4). Available at http://www.cdc.gov/nchs/products/nvsr.htm#vol59. Accessed September 30, 2011.
- Kuehn BM. Efforts aim to curb opioid deaths, injuries. JAMA 2009;301:1213--5.
- CDC. Health, United States, 2006. Hyattsville, MD: US Department of Health and Human Services, CDC, National Center for Health Statistics; 2006. Available at http://www.cdc.gov/nchs/data/hus/hus06.pdf. Accessed September 27, 2011.
- Swedlow A, Ireland J, Johnson G. Prescribing patterns of schedule II opioids in California Workers' Compensation. Oakland, CA: California Workers' Compensation Institute; 2011. Available at http://www.cwci.org/document.php?file=1438.pdf. Accessed October 3, 2011.
- CDC. Drug overdose deaths---Florida, 2003--2009. MMWR 2011;60:869--72.
- Forrester MB. Ingestions of hydrocodone, carisoprodol, and alprazolam in combination reported to Texas poison centers. J Addictive Dis 2011;30:110--5.
- Chou R, Fanciullo GJ, Fine PG, Adler JA, Ballantyne JC, Davies P, et al. Clinical guidelines for the use of chronic opioid therapy in chronic noncancer pain. J Pain 2009;10:113--30.
* Information about bridged-race categories is available at http://www.cdc.gov/nchs/nvss/bridged_race.htm.
† For this report, District of Columbia is grouped with the states.
|
Key Points |
|
FIGURE 1. Drug overdose death rate in 2008 and rate of kilograms (kg) of opioid pain relievers (OPR) sold in 2010 --- United States
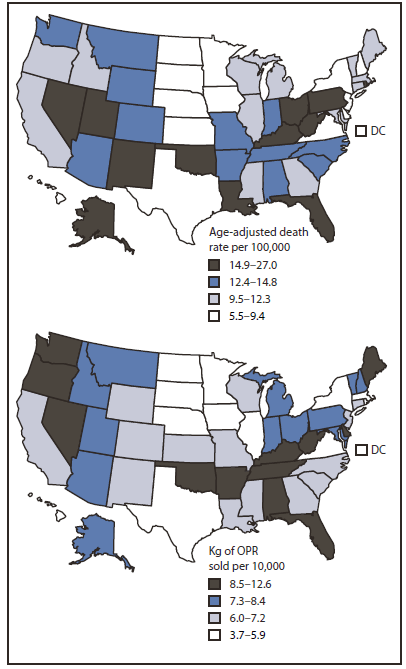
Alternate Text: The figure above shows drug overdose death rates in 2008 and rates of kilograms (kg) of opioid pain relievers (OPR) sold in 2010 in the United States. Rates for all outcomes studied varied widely.
FIGURE 2. Rates* of opioid pain reliever (OPR) overdose death, OPR treatment admissions, and kilograms of OPR sold --- United States, 1999--2010
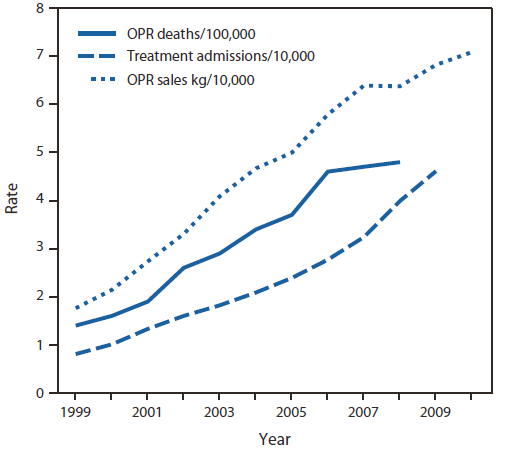
* Age-adjusted rates per 100,000 population for OPR deaths, crude rates per 10,000 population for OPR abuse treatment admissions, and crude rates per 10,000 population for kilograms of OPR sold.
Alternate Text: The figure above shows rates of opioid pain reliever (OPR) overdose death, OPR treatment admissions, and kilograms of OPR sold in the United States during 1999-2010. During 1999-2008, overdose death rates, sales, and substance abuse treatment admissions related to OPR all increased substantially.
Use of trade names and commercial sources is for identification only and does not imply endorsement by the U.S. Department of
Health and Human Services.
References to non-CDC sites on the Internet are
provided as a service to MMWR readers and do not constitute or imply
endorsement of these organizations or their programs by CDC or the U.S.
Department of Health and Human Services. CDC is not responsible for the content
of pages found at these sites. URL addresses listed in MMWR were current as of
the date of publication.
All MMWR HTML versions of articles are electronic conversions from typeset documents.
This conversion might result in character translation or format errors in the HTML version.
Users are referred to the electronic PDF version (http://www.cdc.gov/mmwr)
and/or the original MMWR paper copy for printable versions of official text, figures, and tables.
An original paper copy of this issue can be obtained from the Superintendent of Documents, U.S.
Government Printing Office (GPO), Washington, DC 20402-9371;
telephone: (202) 512-1800. Contact GPO for current prices.
**Questions or messages regarding errors in formatting should be addressed to
mmwrq@cdc.gov.
